


Despite well developed guidelines for managing acute coronary syndrome (ACS),1-6 local registries in Australia and New Zealand have demonstrated incomplete implementation of evidence-based recommendations,7-10 with variations in care appearing to correlate with differences in clinical outcomes. Geographical challenges, patient characteristics (including cultural diversity), health workforce and the health policy environment are likely factors affecting the optimal translation of this evidence base into timely, effective and risk-appropriate ACS care.11,12
Audits of hospitalisation for ACS in New Zealand have been crucial in defining treatment and resource gaps in practice.9,13 In Australia, registries have included relatively few patients from regional and remote centres.7 However, health service design and workforce provision have been found to be associated with variations in clinical outcomes in Australia.14 Hence, gaining a binational perspective from multiple health services of current ACS management is an essential step in health services redesign. The SNAPSHOT ACS study sought to inform these efforts by documenting care and outcomes among patients with suspected ACS through a comprehensive audit encompassing all hospitals and jurisdictions in Australia and New Zealand.
Methods
Study design and organisation
The SNAPSHOT ACS study was a prospective audit of the care provided to consecutive patients admitted with suspected ACS during a 2-week period in Australia and New Zealand. The study was designed by a binational academic network of clinicians and researchers, and managed by a steering committee with key stakeholder representation. It was developed as a collaborative quality improvement initiative between the Cardiac Society of Australia and New Zealand, the Heart Foundation of Australia, the Australian Commission on Safety and Quality in Health Care, the George Institute for Global Health, and health networks or state governments in New South Wales, Queensland, Victoria, South Australia and Western Australia (Appendix 1). The national organisations provided endorsement, in-kind resources and seed funding for central study management. State governments and health networks provided study coordinators to engage facilities, educate staff and assist with gaining ethics committee approval and data collection. The George Institute built the online database and coordinated data management.
All hospitals (public or private, metropolitan or rural) receiving patients with suspected ACS were identified through public records and health networks and approached about participating. Although sites were given training and support with data entry, each hospital's participation was discretionary and resourced locally. Written study protocols were provided to all participating sites, and state-based education forums were held to standardise recruitment and data collection. Results were fed back to each site, benchmarked against the relevant state or territory and national aggregate at the end of the audit.
In Australia, ethics approval for opt-out consent was granted in all but two sites in Victoria, where opt-in consent was implemented. In New Zealand, expedited review by the National Multicentre Ethics Committee concluded that this was an audit of health service delivery, and a consent waiver was applied. In Australia, a consent waiver was applied to all inhospital deaths among patients with suspected ACS.
Patient eligibility and classification
Patients were eligible for inclusion if they were admitted for suspected or confirmed ACS between 14 and 27 May 2012 (inclusive). Consecutive first admissions within the audit window were included. Patients were tracked for the duration of the acute care episode, including all transfers between hospitals.
Patients were classified by primary discharge diagnosis into the following groups:
- ST-segment-elevation myocardial infarction/left bundle branch block (STEMI/LBBB): patients with ST-segment elevation or LBBB on an electrocardiogram (ECG) at any time during the admission, with elevation of cardiac biomarkers (except where the patient died before biomarkers were measured).
- Non-STEMI (NSTEMI): patients with evidence of biomarker elevation, with or without ECG changes consistent with ischaemia.
- Unstable angina: recorded separately but combined with “likely ischaemic chest pain” for analysis.
- Likely ischaemic chest pain: patients for whom the diagnosis remained uncertain in the absence of definitive ECG changes and/or biomarker elevation, but who received inhospital coronary revascularisation with either percutaneous coronary intervention (PCI) or coronary artery bypass grafting (CABG).
- Unlikely ischaemic chest pain: extracted from the medical record, reflecting local clinician determination.
- Other diagnosis: patients for whom a clear alternative primary diagnosis emerged, or where evidence of myonecrosis was considered secondary to another disease process (eg, pulmonary embolus).
Patient risk, inhospital care and events
Using a common case-record form with standardised completion note, data collection focused on patients' presenting characteristics, including clinical variables enabling calculation of the Global Registry of Acute Coronary Events (GRACE) risk score, as well as logistical details of patient presentation and transfers between hospitals.15 Care provided across all institutions involved in acute care was documented, focusing on therapies recommended by published guidelines and inhospital events. Each participating hospital was also asked to complete a survey describing local resources, including cardiac investigation and management capabilities and workforce characteristics.
Inhospital events were defined as shown in Box 1. Reporting of clinical events relied on local documentation using the standardised completion note. Formal adjudication of events was not possible, but monitoring of 2%–5% of all case-record forms for data accuracy and quality was performed during and in the weeks after enrolment by coordinators across all jurisdictions.
Statistical analysis
Patient demographic and clinical characteristics, and rates of interhospital transfer, investigations, invasive procedures, provision of guideline-recommended therapies to patients surviving to hospital discharge, and inhospital events are presented as standard descriptive statistics stratified by discharge diagnosis, Australian Institute of Health and Welfare hospital classification, and health jurisdiction (Australian states or territories and New Zealand).4,5 Due to small sample sizes, the two tiers of medium regional hospital classification were combined, as were the other smaller hospital classifications. Private hospitals were considered as a separate group. These criteria were also applied to New Zealand hospitals. For stratification by jurisdiction, the Australian Capital Territory was combined with NSW, and Tasmania with the Northern Territory.
Dichotomous variables are reported as numbers and percentages and compared using the χ2 test. Continuous variables are reported as medians and interquartile ranges (IQRs) and compared using the Kruskal–Wallis test.
Propensity score-adjusted estimates of the influence of hospital classification and health jurisdiction on provision of angiography, provision of four or five guideline-recommended medications at discharge, referral to cardiac rehabilitation, and major adverse cardiac events (MACE) were generated using logistic regression modelling, stratified by discharge diagnosis. Assessment of angiography and MACE used all patients, while evaluation of rehabilitation referral and discharge medications was confined to patients with a discharge diagnosis of ACS. Propensity scores using age, sex, GRACE score, diagnostic group, heart failure at presentation, renal impairment, diabetes, hypertension, nursing home residence, dementia or cognitive impairment, private insurance, and primary language other than English were constructed for the likelihood of living in each jurisdiction and presenting to a hospital of each classification. Each model included the hospital classifications and jurisdictions as indicator variables, as well as their respective propensity scores, when reporting the jurisdiction or hospital estimates. Interaction terms of each jurisdiction and hospital classification were explored for significance, but no interactions were found. Given the observational and hypothesis-generating nature of these analyses, no adjustment of significance levels was undertaken.
Analyses were performed using Stata 11.2 (StataCorp), and P < 0.05 was considered statistically significant.
Results
Participating hospitals
Of 525 hospitals approached to participate, 478 gained ethics approval, and 435 provided site survey data describing their local resources. Within the 2-week enrolment period, 286 hospitals enrolled 4398 patients with suspected or confirmed ACS. Hospitals not enrolling patients were smaller centres and did not treat patients with suspected ACS during the audit window.
Most patients (65.7%; 2891/4398) presented to principal referral hospitals or hospitals in major cities (7.7%; 337/4398), while 7.3% (319/4398) presented to private hospitals. In terms of cardiac services available at the first presenting hospital, 79.7% of patients (3415/4283) presented where fibrinolysis could be administered, and 59.0% (2528/4283) presented to hospitals capable of providing primary PCI. Only 1.4% of patients (59/4283) presented to hospitals with no reperfusion therapy for STEMI. A quarter of patients (25.9%; 1138/4398) required transfer to at least one other hospital.
The distribution of hospital types by jurisdiction was comparable, except for Victoria, where a selective hospital recruitment strategy operated and there were fewer small regional hospitals (Box 2). Patient characteristics by health jurisdiction and hospital classification are presented in Appendix 2 and Appendix 3, respectively.
Patients with ACS
The risk profile of enrolled patients was high, with a median GRACE risk score of 119 (IQR, 96–144) across the entire population, and 138 (IQR, 114–161) among those with a discharge diagnosis of myocardial infarction (MI), including STEMI and NSTEMI.
Of the 4398 patients, 252 (5.7%) were Indigenous, Pacific Islander or Maori, and 165 (3.8%) were Asian. A primary language other than English was spoken by 294 patients (6.7%). Patient characteristics by discharge diagnosis are shown in Box 3. Among the 837 patients who were discharged with a diagnosis other than ACS, 317 (37.9%) had a troponin level above the local upper reference limit.
Provision of ACS care
Among the 421 patients with a discharge diagnosis of STEMI/LBBB, 106 (25.2%) received fibrinolytic therapy, 163 (38.7%) received primary PCI, and 152 (36.1%) received no reperfusion therapy. Of 1436 patients with STEMI or NSTEMI, coronary angiography was performed in 1019 (71.0%), PCI in 610 (42.5%), and CABG in 116 (8.1%). Reduced provision of invasive management with increasing risk was evident (GRACE score < 100, 90.1% v 101–150, 81.3% v 151–200, 49.4% v > 200, 36.1%; P < 0.001).
Guideline-recommended investigations and therapies were provided less frequently to patients presenting to non-principal referral hospitals, regardless of patient transfers (Box 4). Similar heterogeneity in the provision of care was observed when the results were stratified by jurisdiction (Appendix 4). Variation in the timeliness of care was also evident across jurisdictions; this was most marked in the median time to angiography and, to a lesser extent, in the overall length of stay (Appendix 5).
Inhospital events
Among the patients diagnosed with MI, the inhospital mortality rate was 4.5% (65/1436) and recurrent MI rate was 5.1% (73/1436). Inhospital adverse clinical events were highest among patients with STEMI/LBBB (Box 5). Inhospital mortality and recurrent cardiac failure were frequent among patients discharged with a diagnosis thought not to be ACS. Box 6 shows substantial heterogeneity in clinical events between hospital classifications, in all patients and in those discharged with a diagnosis of ACS.
Adjusted analyses
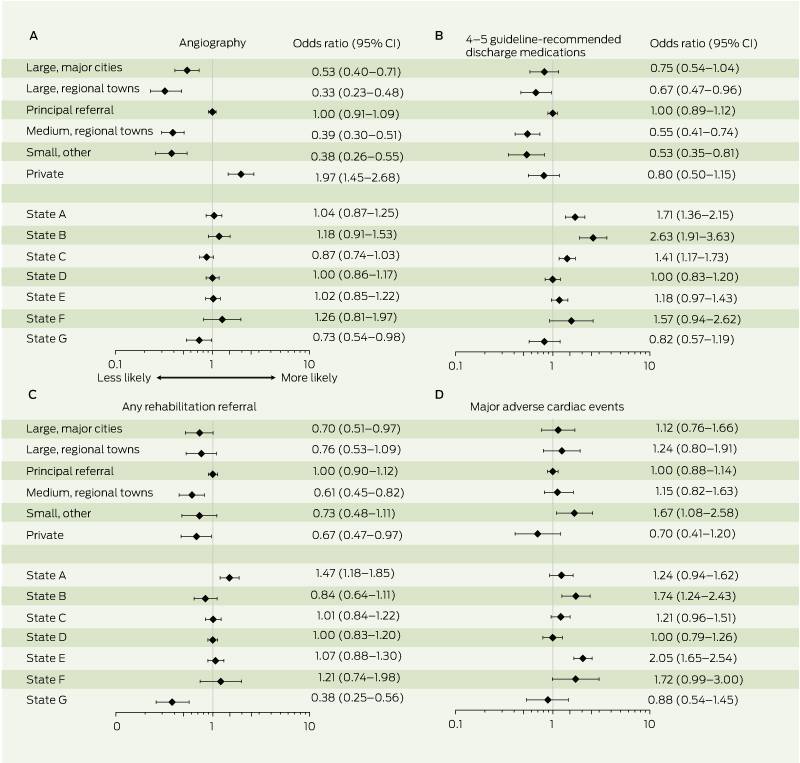
The propensity-adjusted odds ratios and confidence intervals describing the likelihood of undergoing inpatient angiography, receiving four or five guideline-recommended medications at discharge, receiving referral to rehabilitation, and experiencing inhospital MACE are shown in Box 7. There was a consistently lower likelihood of receiving guideline-recommended medications among patients originally presenting to non-principal referral hospitals. Patients in private hospitals were significantly more likely to undergo angiography, but not necessarily to receive guideline-recommended medications or rehabilitation referral. There was more variation in the occurrence of inhospital MACE at the health jurisdiction level than between hospital types.
Discussion
Optimising patient outcomes after MI through standardisation of care has emerged as a major near-term goal in the health agenda of Australia and New Zealand.17 Through the most representative assessment of ACS health service resources, clinical care provision and outcomes yet conducted in Australasia, this study provides unique insights into the challenges of providing timely and effective ACS care. These include the complexity of patient comorbidities, which brings the logistical challenges of providing timely invasive management to many patients in regional, remote and outer metropolitan centres into sharp focus.11,12
Translating evidence into practice requires a sophisticated understanding of determinants of care provision at the patient, clinical service and health policy level. Variations in clinical decision making, service availability and health policy represent potential targets for improving translation of the ACS evidence base and outcomes. An integrated approach to health service design is paramount to meeting the needs of our culturally diverse and geographically dispersed communities.
The efficient management of patients presenting with suspected ACS remains challenging. More sensitive markers of myonecrosis, such as high-sensitivity troponin assays, have not simplified this.18 This is demonstrated in our study by the substantial proportion of patients with suspected ACS who had elevated troponin levels, but in whom further investigations confirmed a final diagnosis other than ACS.19,20 Nevertheless, our data demonstrate high rates of inhospital events among such patients, as has been observed by others;21,22 yet the current evidence informing their management is very limited.
Similarly, our data demonstrate the substantial burden of clinical complexity among ACS patients, with relatively high prevalences of comorbidities including prior major bleeding events, cerebrovascular disease, cognitive impairment and concurrent malignancy.23 This complexity underscores the everyday challenges in applying the evidence among patients with typical ACS presentations. Reduced application of evidence-based therapies among patients with increased comorbidities has been found in other studies.24,25 Objective risk stratification that balances the benefits of evidence-based therapies against the risks associated with comorbidities may help narrow the evidence–practice gap for ACS patients with comorbidities.26
Our study highlights the potential for variation in care attributable to jurisdictional and geographical differences. The challenge of providing timely access to invasive management, not only in rural areas but also in the growing outer suburbs of cities, is highlighted by the fact that 26% of all ACS patients in our study required transfer. Attempts to improve consistency and quality of care, such as through clinical guidelines and clinical standards,17 need to consider the significant issues of transfer and coordination of care, particularly outside metropolitan areas, if such initiatives are to be effective and cost-effective.
In combination, these observations call for judicious and validated approaches to the development and implementation of clinical standards and performance measures that take these diagnostic and therapeutic complexities into account.
The broad hospital recruitment approach, consecutive patient enrolment, and high inhospital event rates in our study underscore the importance of representative patient inclusion when evaluating practice and outcomes.27 For the effective integration of clinical guidelines, clinical standards and performance measures into everyday care, the real challenge is to develop mechanisms to acquire and feed back such data on a routine and sustainable basis.28 The SNAPSHOT ACS study was the culmination of significant efforts to engage with national agencies and professional bodies, while implementation depended on the jurisdictional health networks. However, the study also required local hospital commitment to data collection and entry, an enormous unresourced effort that is difficult to quantify but attests to the dedication of health care providers to the quality of ACS care and outcomes. Future attempts to understand the lingering evidence–practice gaps will need to consider such resourcing issues carefully. Nevertheless, this study is unique in its ability to gain insights into the provision of care across multiple levels of decision making. Effectively delivering these insights to key decisionmakers at clinical, health service and health policy levels to enable the design and implementation of fully integrated approaches to ACS care remains the “translational” promise of this initiative.
1 Definitions of inhospital events
Inhospital mortality: included any-cause mortality
New or recurrent myocardial infarction (MI): recurrent chest pain lasting ≥ 30 minutes and ≥ 2 mm of ST-segment elevation within 18 hours of presentation, the development of a new left bundle branch block pattern or new Q waves or the following biomarker patterns: a rise in creatine kinase (CK) level to > 2 × upper reference limit (URL) and > 50% above previous baseline level; or CK-MB > 50% above prior level or troponin > 20% above previous baseline level
New MI after percutaneous coronary intervention: a rise in CK, CK-MB or troponin level to > 3 × URL if not previously elevated, or > 50% and > 20% rise above previous levels of CK-MB and troponin, respectively, if previously elevated
New MI after coronary artery bypass grafting: a rise in CK or CK-MB level to > 10 × and > 5 × URL, respectively, if not previously elevated, or a > 50% rise above previous level if elevated, or a 10-fold elevation in troponin level
Major bleeding: an event requiring a blood transfusion or involving a fall in haemoglobin level of > 4 g/dL
Stroke: a new neurological event involving single vascular territory, confirmed with neurological imaging
Cardiac arrest: sudden loss of cardiac function with loss of consciousness and spontaneous breathing
Worsening congestive heart failure: deterioration in Killip classification of one or more grades at any time during hospitalisation
Major adverse cardiac event: the occurrence of any one of the above events
2 Characteristics of hospitals enrolling patients with suspected or confirmed acute coronary syndrome (ACS), by health jurisdiction
Total | NZ | NSW/ACT | Queensland | Victoria | WA | SA | NT/Tas | P | |||||||
No. of patients with suspected or confirmed ACS | 4398 | 1007 | 1140 | 695 | 726 | 354 | 362 | 114 | |||||||
Estimated rate of admission for suspected ACS (per 100 000/year) | 420 | 588 | 380 | 398 | 336 | 381 | 553 | 397 | |||||||
No. of hospitals participating | 435 | 39 | 130 | 121 | 46 | 53 | 39 | 6 | |||||||
No. of hospitals enrolling patients | 286 | 35 | 91 | 61 | 41 | 21 | 32 | 5 | |||||||
Principal referral* | 88 (30.8%) | 9 (25.7%) | 29 (31.9%) | 17 (27.9%) | 19 (46.3%) | 5 (23.8%) | 5 (15.6%) | 4 (80.0%) | < 0.001 | ||||||
Large, major cities* | 19 (6.6%) | 4 (11.4%) | 7 (7.7%) | 2 (3.3%) | 2 (4.9%) | 3 (14.3%) | 1 (3.1%) | 0 | |||||||
Large, regional towns* | 19 (6.6%) | 3 (8.6%) | 4 (4.4%) | 2 (3.3%) | 6 (14.6%) | 3 (14.3%) | 0 | 1 (20.0%) | |||||||
Medium, regional towns* | 56 (19.6%) | 8 (22.9%) | 20 (22.0%) | 10 (16.4%) | 7 (17.1%) | 0 | 11 (34.4%) | 0 | |||||||
Small, other* | 81 (28.3%) | 11 (31.4%) | 29 (31.9%) | 20 (32.8%) | 2 (4.9%) | 6 (28.6%) | 13 (40.6%) | 0 | |||||||
Private* | 23 (8.0%) | 0 | 2 (2.2%) | 10 (16.4%) | 5 (12.2%) | 4 (19.0%) | 2 (6.3%) | 0 | |||||||
Onsite cardiac intensive care*† | 188 (65.7%) | 29 (82.9%) | 58 (63.7%) | 43 (70.5%) | 29 (70.7%) | 13 (61.9%) | 11 (34.4%) | 5 (100%) | 0.001 | ||||||
Onsite echocardiography service* | 144 (50.3%) | 24 (68.6%) | 40 (44.0%) | 28 (45.9%) | 25 (61.0%) | 11 (52.4%) | 12 (37.5%) | 4 (80.0%) | 0.07 | ||||||
Onsite PCI service* | 80 (28.0%) | 10 (28.6%) | 22 (24.2%) | 16 (26.2%) | 16 (39.0%) | 7 (33.3%) | 7 (21.9%) | 2 (40.0%) | 0.61 | ||||||
Onsite cardiac surgical service* | 53 (18.5%) | 5 (14.3%) | 15 (16.5%) | 11 (18.0%) | 10 (24.4%) | 5 (23.8%) | 5 (15.6%) | 2 (40.0%) | 0.72 | ||||||
NZ = New Zealand. NSW = New South Wales. ACT = Australian Capital Territory. WA = Western Australia. SA = South Australia. NT = Northern Territory. Tas = Tasmania. PCI = percutaneous coronary intervention. * Percentages use number of enrolling hospitals in each jurisdiction as the denominator. † Dedicated higher cardiac acuity area such as intensive care, coronary care, high-dependency unit or integrated cardiac unit. | |||||||||||||||
3 Characteristics of patients, by clinical diagnosis at time of discharge
Total | STEMI/LBBB | NSTEMI | Unstable angina/likely ischaemic chest pain | Unlikely ischaemic chest pain | Other diagnosis* | P | |||||||||
No. of patients | 4398 | 421 | 1015 | 929 | 1196 | 837 | |||||||||
Age in years, mean (SD) | 66.5 (14.6) | 65.6 (14.4) | 71.2 (13.2) | 68.1 (12.9) | 62.1 (14.9) | 65.8 (15.7) | 0.001 | ||||||||
Female | 1771 (40.3%) | 119 (28.3%) | 376 (37.0%) | 343 (36.9%) | 567 (47.4%) | 366 (43.7%) | < 0.001 | ||||||||
Median creatinine level, µmol/L (25th–75th percentile) | 84 (70–104) | 89 (73–106) | 89 (74–113) | 86 (71–106) | 78 (66–93) | 85 (68–110) | < 0.001 | ||||||||
Killip Class II–IV at presentation | 599 (13.6%) | 81 (19.2%) | 206 (20.3%) | 78 (8.4%) | 69 (5.8%) | 165 (19.7%) | < 0.001 | ||||||||
Presentation with cardiac arrest | 78 (1.8%) | 35 (8.3%) | 12 (1.2%) | 4 (0.4%) | 3 (0.3%) | 24 (2.9%) | < 0.001 | ||||||||
Median GRACE risk score (25th–75th percentile) | 119 (96–144) | 140 (118–165) | 137 (114–159) | 115 (96–136) | 101 (80–122) | 120 (94–147) | 0.001 | ||||||||
Diabetes | 1115 (25.4%) | 83 (19.7%) | 314 (30.9%) | 289 (31.1%) | 217 (18.1%) | 212 (25.3%) | < 0.001 | ||||||||
Hypertension | 2785 (63.3%) | 229 (54.4%) | 699 (68.9%) | 677 (72.9%) | 672 (56.2%) | 508 (60.7%) | < 0.001 | ||||||||
Dyslipidaemia | 2391 (54.4%) | 192 (45.6%) | 588 (57.9%) | 618 (66.5%) | 578 (48.3%) | 415 (49.6%) | < 0.001 | ||||||||
Current smoker | 800 (18.2%) | 130 (30.9%) | 175 (17.2%) | 134 (14.4%) | 218 (18.2%) | 143 (17.1%) | < 0.001 | ||||||||
Prior myocardial infarction | 1195 (27.2%) | 75 (17.8%) | 345 (34.0%) | 335 (36.1%) | 250 (20.9%) | 190 (22.7%) | < 0.001 | ||||||||
Prior PCI | 892 (20.3%) | 48 (11.4%) | 184 (18.1%) | 308 (33.2%) | 199 (16.6%) | 153 (18.3%) | < 0.001 | ||||||||
Prior CABG | 466 (10.6%) | 21 (5.0%) | 135 (13.3%) | 133 (14.3%) | 88 (7.4%) | 89 (10.6%) | < 0.001 | ||||||||
Prior atrial fibrillation | 667 (15.2%) | 31 (7.4%) | 174 (17.1%) | 126 (13.6%) | 144 (12.0%) | 192 (22.9%) | < 0.001 | ||||||||
Known PAD | 267 (6.1%) | 22 (5.2%) | 91 (9.0%) | 67 (7.2%) | 41 (3.4%) | 46 (5.5%) | < 0.001 | ||||||||
Prior TIA or CVA | 454 (10.3%) | 23 (5.5%) | 144 (14.2%) | 108 (11.6%) | 93 (7.8%) | 86 (10.3%) | < 0.001 | ||||||||
Prior admission for major bleeding or transfusion | 107 (2.4%) | 10 (2.4%) | 26 (2.6%) | 20 (2.2%) | 25 (2.1%) | 26 (3.1%) | 0.63 | ||||||||
Active cancer limiting life expectancy | 106 (2.4%) | 8 (1.9%) | 27 (2.7%) | 21 (2.3%) | 26 (2.2%) | 24 (2.9%) | 0.76 | ||||||||
Cognitive impairment or dementia | 149 (3.4%) | 11 (2.6%) | 42 (4.1%) | 27 (2.9%) | 38 (3.2%) | 31 (3.7%) | 0.46 | ||||||||
Nursing home resident | 116 (2.6%) | 13 (3.1%) | 33 (3.3%) | 28 (3.0%) | 12 (1.0%) | 30 (3.6%) | 0.001 | ||||||||
STEMI/LBBB = ST-segment elevation myocardial infarction/left bundle branch block. NSTEMI = non-STEMI. GRACE = Global Registry of Acute Coronary Events. PCI = percutaneous coronary intervention. CABG = coronary artery grafting. PAD = peripheral artery disease. TIA = transient ischaemic attack. CVA = cerebrovascular accident. * Includes secondary myonecrosis. | |||||||||||||||
4 Provision of (A) investigations and revascularisation and (B) guideline-recommended therapies, among patients with a discharge diagnosis of acute coronary syndrome, by enrolling hospital classification*
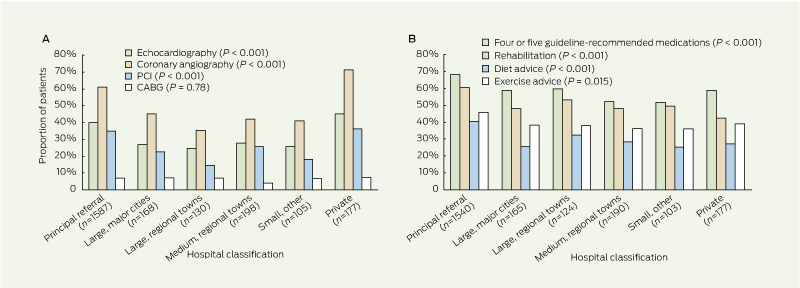
|
|
PCI = percutaneous coronary intervention. CABG = coronary artery grafting. * n refers to number of patients. |
5 Inhospital clinical events, by principal diagnosis at time of discharge*
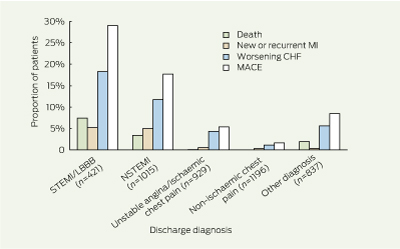
|
|
MI = myocardial infarction. CHF = congestive heart failure. MACE = major adverse cardiac events. STEMI/LBBB = ST-segment elevation myocardial infarction/left bundle branch block. NSTEMI = non-STEMI. * All comparisons of outcomes between diagnostic categories are significant (P < 0.001). n refers to number of patients. |
6 Inhospital clinical events among (A) all patients and (B) patients with a discharge diagnosis of acute coronary syndrome, by enrolling hospital classification
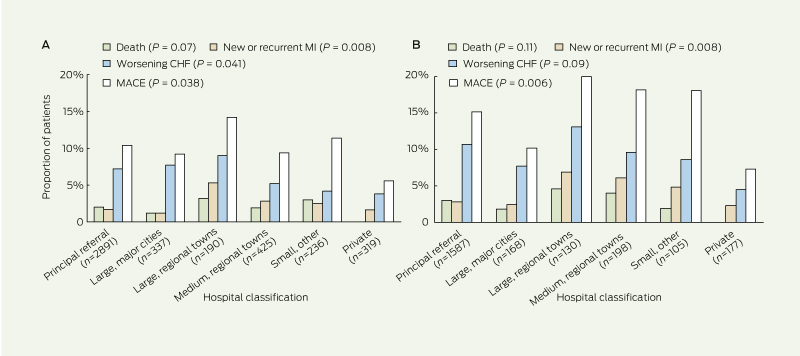
|
|
MI = myocardial infarction. CHF = congestive heart failure. MACE = major adverse cardiac events. * n refers to number of patients. |
7 Adjusted odds ratios* for likelihood of (A) provision of angiography, (B) provision of four or five guideline-recommended medications at discharge, (C) referral to cardiac rehabilitation, and (D) inhospital major adverse cardiac events, by hospital classification and health jurisdiction
|
|
* Principal referral hospitals and State D are the referent categories for hospital classification and health jurisdiction, respectively. Bars indicate 95% confidence intervals, which have been produced using the floating absolute risk method.16 |
Received 20 December 2012, accepted 2 May 2013
- Derek P Chew1
- John French2
- Tom G Briffa3
- Christopher J Hammett4
- Christopher J Ellis5
- Isuru Ranasinghe6
- Bernadette J Aliprandi-Costa7
- Carolyn M Astley8
- Fiona M Turnbull6
- Jeffrey Lefkovits9
- Julie Redfern6
- Bridie Carr10
- Greg D Gamble11
- Karen J Lintern10
- Tegwen E J Howell12
- Hella Parker13
- Rosanna Tavella14
- Stephen G Bloomer15
- Karice K Hyun6
- David B Brieger7
- 1 Department of Cardiovascular Medicine, Flinders University, Adelaide, SA.
- 2 Department of Cardiology, Liverpool Hospital, Sydney, NSW.
- 3 School of Population Health, University of Western Australia, Perth, WA.
- 4 Royal Brisbane and Women's Hospital, Brisbane, QLD
- 5 Department of Cardiology, Auckland City Hospital, Auckland, New Zealand.
- 6 The George Institute for Global Health, Sydney, NSW.
- 7 Department of Cardiology, Concord Hospital, Sydney, NSW.
- 8 Statewide Systems Strategy, SA Health, Adelaide, SA.
- 9 Royal Melbourne Hospital, Melbourne, VIC.
- 10 Agency for Clinical Innovation, Sydney, NSW.
- 11 Department of Medicine, University of Auckland, Auckland, New Zealand.
- 12 Clinical Access and Redesign Unit, Queensland Department of Health, Brisbane, QLD.
- 13 Clinical Service Development, Victoria Health, Melbourne, VIC.
- 14 SA Health, Adelaide, SA.
- 15 Health Networks Branch, Department of Health of Western Australia, Perth, WA.
- 1. Steg PG, James SK, Atar D, et al. ESC Guidelines for the management of acute myocardial infarction in patients presenting with ST-segment elevation: the task force on the management of ST-segment elevation acute myocardial infarction of the European Society of Cardiology (ESC). Eur Heart J 2012; 33: 2569-2619. doi: 10.1093/eurheartj/ehs215.
- 2. Anderson JL, Adams CD, Antman EM, et al. 2011 ACCF/AHA focused update incorporated into the ACC/AHA 2007 guidelines for the management of patients with unstable angina/non-ST-elevation myocardial infarction: a report of the American College of Cardiology Foundation/American Heart Association Task Force on Practice Guidelines. Circulation 2011; 123: e426-e579.
- 3. Wright RS, Anderson JL, Adams CD, et al. 2011 ACCF/AHA focused update of the guidelines for the management of patients with unstable angina/non-ST-elevation myocardial infarction (updating the 2007 guideline): a report of the American College of Cardiology Foundation/American Heart Association Task Force on Practice Guidelines. Circulation 2011; 123: 2022-2060.
- 4. Aroney CN, Aylward P, Kelly A-M, at al; Acute Coronary Syndrome Guidelines Working Group. Guidelines for the management of acute coronary syndromes 2006. Med J Aust 2006; 184 (8 Suppl): S1-S30. <MJA full text>
- 5. Chew DP, Aroney CN, Aylward PE, et al. 2011 Addendum to the National Heart Foundation of Australia/Cardiac Society of Australia and New Zealand Guidelines for the management of acute coronary syndromes (ACS) 2006. Heart Lung Circ 2011; 20: 487-502.
- 6. Brieger D, Kelly A-M, Aroney C, et al. Acute coronary syndromes: consensus recommendations for translating knowledge into action. Med J Aust 2009; 191: 334-338. <MJA full text>
- 7. Chew DP, Amerena JV, Coverdale SG, et al. Invasive management and late clinical outcomes in contemporary Australian management of acute coronary syndromes: observations from the ACACIA registry. Med J Aust 2008; 188: 691-697. <MJA full text>
- 8. Aliprandi-Costa B, Ranasinghe I, Chow V, et al. Management and outcomes of patients with acute coronary syndromes in Australia and New Zealand, 2000–2007. Med J Aust 2011; 195: 116-121. <MJA full text>
- 9. Ellis C, Devlin G, Matsis P, et al. Acute coronary syndrome patients in New Zealand receive less invasive management when admitted to hospitals without invasive facilities. N Z Med J 2004; 117: U954.
- 10. Ellis C, Gamble G, Hamer A, et al. Patients admitted with an acute coronary syndrome (ACS) in New Zealand in 2007: results of a second comprehensive nationwide audit and a comparison with the first audit from 2002. N Z Med J 2010; 123: 25-43.
- 11. Ranasinghe I, Turnbull F, Tonkin A, et al. Comparative effectiveness of population interventions to improve access to reperfusion for ST-segment-elevation myocardial infarction in Australia. Circ Cardiovasc Qual Outcomes 2012; 5: 429-436.
- 12. Clark RA, Coffee N, Turner D, et al. Application of geographic modeling techniques to quantify spatial access to health services before and after an acute cardiac event: the Cardiac Accessibility and Remoteness Index for Australia (ARIA) project. Circulation 2012; 125: 2006-2014.
- 13. Ellis C, Devlin G, Elliott J, et al. ACS patients in New Zealand experience significant delays to access cardiac investigations and revascularisation treatment especially when admitted to non-interventional centres: results of the second comprehensive national audit of ACS patients. N Z Med J 2010; 123: 44-60.
- 14. Astley CM, Macdougall CJ, Davidson PM, Chew DP. Lost in translation: health resource variability in the achievement of optimal performance and clinical outcome. Circ Cardiovasc Qual Outcomes 2011; 4: 512-520.
- 15. Fox KAA, Dabbous OH, Goldberg RJ, et al. Prediction of risk of death and myocardial infarction in the six months after presentation with acute coronary syndrome: prospective multinational observational study (GRACE). BMJ 2006; 333: 1091.
- 16. Easton DF, Peto J, Babiker AG. Floating absolute risk: an alternative to relative risk in survival and case-control analysis avoiding an arbitrary reference group. Stat Med 1991; 10: 1025-1035.
- 17. Smith MC. From the Australian Commission on Safety and Quality in Health Care. Towards national clinical care standards. Med J Aust 2012; 197: 540. <MJA full text>
- 18. Reichlin T, Hochholzer W, Bassetti S, et al. Early diagnosis of myocardial infarction with sensitive cardiac troponin assays. N Engl J Med 2009; 361: 858-867.
- 19. Agewall S, Giannitsis E, Jernberg T, Katus H. Troponin elevation in coronary vs. non-coronary disease. Eur Heart J 2011; 32: 404-411.
- 20. Gallagher S, Jones DA, Anand V, Mohiddin S. Diagnosis and management of patients with acute cardiac symptoms, troponin elevation and culprit-free angiograms. Heart 2012; 98: 974-981.
- 21. Saunders JT, Nambi V, de Lemos JA, et al. Cardiac troponin T measured by a highly sensitive assay predicts coronary heart disease, heart failure, and mortality in the Atherosclerosis Risk in Communities Study. Circulation 2011; 123: 1367-1376.
- 22. Aldous SJ, Florkowski CM, Crozier IG, et al. High sensitivity troponin outperforms contemporary assays in predicting major adverse cardiac events up to two years in patients with chest pain. Ann Clin Biochem 2011; 48: 249-255.
- 23. Steg PG, López-Sendón J, Lopez de Sa E, et al. External validity of clinical trials in acute myocardial infarction. Arch Intern Med 2007; 167: 68-73.
- 24. Scott IA, Derhy PH, O'Kane D, et al. Discordance between level of risk and intensity of evidence-based treatment in patients with acute coronary syndromes. Med J Aust 2007; 187: 153-159. <MJA full text>
- 25. Joynt KE, Huynh L, Amerena JV, et al. Impact of acute and chronic risk factors on use of evidence-based treatments in patients in Australia with acute coronary syndromes. Heart 2009; 95: 1442-1448.
- 26. Yan AT, Yan RT, Tan M, et al. Management patterns in relation to risk stratification among patients with non-ST elevation acute coronary syndromes. Arch Intern Med 2007; 167: 1009-1016.
- 27. Ferreira-Gonzalez I, Marsal JR, Mitjavila F, et al. Patient registries of acute coronary syndrome: assessing or biasing the clinical real world data? Circ Cardiovasc Qual Outcomes 2009; 2: 540-547.
- 28. Chew D, Brieger D, Astley CM, Georgiou A. Measuring performance and outcomes of acute coronary syndromes management in Australia. Med J Aust 2012; 197: 140-142. <MJA full text>
Abstract
Objectives: To characterise management of suspected acute coronary syndrome (ACS) in Australia and New Zealand, and to assess the application of recommended therapies according to published guidelines.
Design, setting and patients: All patients hospitalised with suspected or confirmed ACS between 14 and 27 May 2012 were enrolled from participating sites in Australia and New Zealand, which were identified through public records and health networks. Descriptive and logistic regression analysis was performed.
Main outcome measures: Rates of guideline-recommended investigations and therapies, and inhospital clinical events (death, new or recurrent myocardial infarction [MI], stroke, cardiac arrest and worsening congestive heart failure).
Results: Of 478 sites that gained ethics approval to participate, 286 sites provided data on 4398 patients with suspected or confirmed ACS. Patients’ mean age was 67 years (SD, 15 years), 40% were women, and the median Global Registry of Acute Coronary Events (GRACE) risk score was 119 (interquartile range, 96–144). Most patients (66%) presented to principal referral hospitals. MI was diagnosed in 1436 patients (33%), unstable angina or likely ischaemic chest pain in 929 (21%), unlikely ischaemic chest pain in 1196 (27%), and 837 patients (19%) had other diagnoses not due to ACS. Of the patients with MI, 1019 (71%) were treated with angiography, 610 (43%) with percutaneous coronary intervention and 116 (8%) with coronary artery bypass grafting. Invasive management was less likely with increasing patient risk (GRACE score < 100, 90.1% v 101–150, 81.3% v 151–200, 49.4% v > 200, 36.1%; P < 0.001). The inhospital mortality rate was 4.5% and recurrent MI rate was 5.1%. After adjusting for patient risk and other variables, significant variations in care and outcomes by hospital classification and jurisdiction were evident.
Conclusion: This first comprehensive combined Australia and New Zealand audit of ACS care identified variations in the application of the ACS evidence base and varying rates of inhospital clinical events. A focus on integrated clinical service delivery may provide greater translation of evidence to practice and improve ACS outcomes in Australia and New Zealand.