


Australia is a world leader in tobacco control and in reducing its national smoking prevalence. However, 42% of Aboriginal and Torres Strait Islander Australians aged 15 years or older were daily smokers in 2012–2013 — 2.6 times the age-standardised prevalence among other Australians.1 Tobacco smoking was responsible for 20% of deaths and 12% of the total burden of disease in the Aboriginal and Torres Strait Islander population, and 17% of the health gap with other Australians in 2003.2,3
In response, community and government attention to Aboriginal and Torres Strait Islander tobacco control has increased in recent years, including increased government funding.4 It is important to understand what is assisting Aboriginal and Torres Strait Islander smokers to quit, both to evaluate the impact of current tobacco control efforts and to identify new strategies.
The International Tobacco Control Policy Evaluation Project (ITC Project) was established in 2002 to assess the effectiveness of national policy provisions in the World Health Organization Framework Convention on Tobacco Control.5,6 ITC Project studies have been undertaken in more than 20 countries, following up nationally representative cohorts of smokers, asking questions about smoking attitudes, behaviour and exposure to different tobacco control policies and activities. Additional smokers are recruited in subsequent survey waves to replenish the sample, replacing those lost to follow-up. The survey questions are based on a conceptual model that describes the causal pathways from policies to public health impact.6 This allows assessment of the impact of policies on behaviour and attitudes along the theorised causal pathway, and the investigation of how these impacts are moderated by other factors, such as sociodemographic factors, dependence and smoking history.
These key elements of the ITC Project (longitudinal design, comparisons between groups and countries exposed to different policies, and the conceptual model) have led to it being accepted as the most rigorous method of evaluating national tobacco control policies. They have now been used and adapted by those researching alcohol policy.7,8
Here, we describe the research methods used in the Talking About The Smokes (TATS) project, the first ITC Project study to sample only a high smoking prevalence subpopulation within a country; in this case, Aboriginal and Torres Strait Islander peoples. Like other studies of the ITC Project, it will answer research questions about the impact of tobacco control policies and activities along the theorised causal pathway to quitting, and compare findings with other ITC Project studies, especially the broader Australian surveys. We also compare the baseline community sample with a national household survey of Aboriginal and Torres Strait Islander peoples.
Methods
Design features
The TATS project is a collaboration between research institutions and Aboriginal community-controlled health services (ACCHSs) and their state and national representative bodies. These partnerships and project governance are described elsewhere in this supplement.9 Aboriginal organisations and Aboriginal and Torres Strait Islander people have been involved in all stages of the research project: design, data collection, analysis and research translation.
The project was approved by three Aboriginal human research ethics committees (HRECs) and two HRECs with Aboriginal subcommittees: Aboriginal Health & Medical Research Council Ethics Committee, Sydney; Aboriginal Health Research Ethics Committee, Adelaide; Central Australian HREC, Alice Springs; HREC for the Northern Territory Department of Health and Menzies School of Health Research, Darwin; and the Western Australian Aboriginal Health Ethics Committee, Perth.
Other Australian ITC Project surveys have been completed by random telephone survey, with an option to complete recontact surveys on the internet since 2008.10 In contrast, we chose to conduct face-to-face surveys, as telephone ownership is incomplete in the Aboriginal and Torres Strait Islander population.11 More importantly, past experiences have led to considerable distrust of research among the Aboriginal and Torres Strait Islander community, and we decided that the necessary respectful relationships to overcome this distrust were more likely to be created face to face.12,13
In addition to the surveys of community members, each ACCHS completed a single policy monitoring survey describing key tobacco control policies at each survey wave, and all staff of the ACCHSs were invited to complete an abbreviated version of the main community survey.
Sampling of clusters (ACCHSs)
Truly random probabilistic sampling was impractical as Aboriginal and Torres Strait Islander people account for only 3% of the total Australian population.14 We used a quota sampling design, based on meaningful clusters: the communities served by ACCHSs (and a community in the Torres Strait). Involving ACCHSs built local trust, facilitated local use of results and employment of local staff, and enabled us to examine differences between policies and practices of ACCHSs. We invited all 150 member services of the National Aboriginal Community Controlled Health Organisation that provided comprehensive primary health care to participate, excluding smaller member organisations that provided more limited services, such as aged care or drug and alcohol rehabilitation. We also included a cluster in the Torres Strait where 15% of Torres Strait Islanders live, but where there is no ACCHS.15
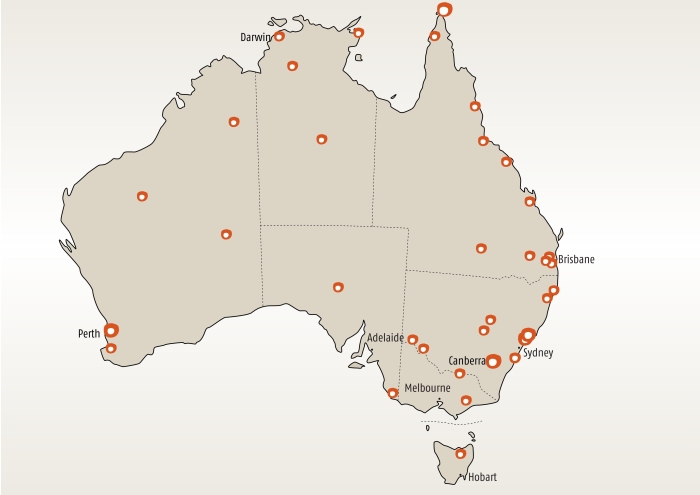
We aimed to collect data from 40 clusters or sites reflecting the geographic distribution of the Aboriginal and Torres Strait Islander population. Target numbers of clusters for each of three remoteness categories (major cities, inner and outer regional, remote and very remote) were calculated for each jurisdiction using 2006 Census data.15 As there were smaller numbers of eligible ACCHSs in the major cities, each eligible major-city ACCHS was invited to recruit double the standard cluster quota of participants, as was the Torres Strait community. Recruitment of sites occurred over 18 months.
Forty quotas (including double quotas from four major-city sites and the Torres Strait community) were recruited from 35 clusters (Box 1). This closely matched the national geographic distribution of the population: 28% of the 40 quotas were from major cities, 45% from regional areas, and 28% from remote and very remote areas, compared with 32%, 44% and 25%, respectively, of the total estimated resident Aboriginal and Torres Strait Islander population on 30 June 2006. For the three states with the largest Aboriginal and Torres Strait Islander population, 28% of quotas were from New South Wales, 30% from Queensland and 15% from Western Australia, compared with 29%, 28% and 15%, respectively, of the population.15
Sampling within each cluster (ACCHS)
In the baseline survey (Wave 1) at each site, we aimed to survey samples of 50 smokers or recent ex-smokers (who had quit ≤ 12 months previously, to examine relapse) and 25 non-smokers (never-smokers and ex-smokers who had quit > 12 months previously) from the Aboriginal and Torres Strait Islander community, with equal numbers of men and women and in each of two age groups (18–34 and ≥ 35 years). The age cut-point was chosen because the median age of an Aboriginal or Torres Strait Islander smoker aged ≥ 18 years in the 2008 National Aboriginal and Torres Strait Islander Social Survey (NATSISS) was 34 years. People were excluded if they were: non-Indigenous, aged less than 18 years, acutely unwell, not usual residents of the area, staff members of the ACCHS, unable to complete the survey in English (if there was no interpreter available), or if the quota for the relevant age–sex–smoking category had been filled.
In each location, we negotiated with the ACCHS to decide on the method of sampling. While we explained to local research assistants (RAs) the need to collect a representative sample of their community (eg, not just all the people from a few adjacent households), sampling was non-random. Methods included sampling of known Aboriginal or Torres Strait Islander households, opportunistic sampling at Aboriginal community events and organisations (including the ACCHS), and snowballed invitations to people whom others suggested might be interested. The project compensated participants with a $20 local business voucher on completion of the survey, except in nine sites where the ACCHS supplemented this to $30 or $50, reflecting local perceptions of fair compensation.
In the follow-up survey (Wave 2) at each site, we focused on recontacting the smokers and recent ex-smokers who had completed the Wave 1 survey. As we did not expect to recontact them all, we replenished our sample with smokers who had not completed Wave 1 (to a maximum of 50, or 100 if a double quota, recontacted or replenished in each location), using the same sampling methods as in Wave 1. Participant compensation was increased to facilitate follow-up, ranging from $30 to $50. We did not recontact non-smokers from Wave 1, nor survey a new community sample of non-smokers. All staff at each ACCHS were invited at each wave to complete the short staff survey.
Sample size
Our target sample size in Wave 1 was 2000 smokers or recent ex-smokers (of whom we expected to recontact 1000 in Wave 2) and 1000 non-smokers. These sample sizes were not primarily based on power calculations but on available resources and the experience of other ITC Project studies that suggested 2000 baseline and 1000 recontacted smokers or recent ex-smokers would provide sufficient power for meaningful estimates. The sample size of non-smokers was smaller, to concentrate resources on sampling smokers and recent ex-smokers. Rather than simply excluding non-smokers at screening, we took the opportunity to ask fewer questions to examine differences between them and smokers.
Questionnaire development
Three surveys were developed for each survey wave: (1) the main survey for smokers and non-smokers in each community; (2) the ACCHS staff survey; and (3) the policy monitoring survey for each ACCHS. The final versions of all Wave 1 questionnaires were produced by a collaborative effort based on email exchanges, teleconferences and five face-to-face meetings of the research team, the Project Reference Group and project staff.9
The main community survey included sections on smoking behaviour, smoking in the participant's social network, second-hand smoke, quitting history, tobacco brands and prices, use of smokeless tobacco, knowledge about health effects, attitudes, advertising and promotion (including health warnings), medications to stop smoking and cessation support. It was based on core questions from ITC Project surveys, to enable comparisons with other studies. Other questions reflecting specific concerns in this setting were added. For example, the smokeless tobacco section included questions about chewing pituri or native tobaccos as well as store-bought tobacco, and the second-hand smoke section included specific questions about smoking bans at ACCHSs. The wording of some questions was modified to better reflect Aboriginal and Torres Strait Islander colloquial speech.
The main survey was piloted with 24 participants in Darwin in Wave 1. Our first site (with 48 participants) was treated as a quasi-pilot in Wave 1, trialling all aspects of the project, which were reviewed before the second site commenced. This led to us dropping some questions and revising the wording of others (mainly abbreviating questions and their preambles). As these changes were modest, data from this first site were included in the total sample.
The staff survey used a small selection of questions from the main community survey, supplemented by additional questions about staff roles at the ACCHS. The policy monitoring survey included questions about the ACCHS and the community it served, tobacco control activities run by the ACCHS and tobacco control policies (especially smoking bans) at the ACCHS.
Wave 2 survey instruments were closely based on Wave 1 and were not separately piloted. In Wave 2, some Wave 1 questions were dropped after review, and new questions were added to reflect changes in the policy environment. The main survey was restructured by referring to responses in Wave 1, to accommodate people being recontacted, and did not repeat questions to which the answers were unlikely to have changed.
Copies of all the surveys are available at http://www.itcproject.org/countries/australia/tats.
Data collection methods
Wave 1 surveys were conducted between April 2012 and October 2013, and Wave 2 surveys between July 2013 and August 2014. The project funded participating ACCHSs to employ RAs for 6 weeks of data collection for each wave; however, many sites chose to continue recruitment longer in order to meet target numbers. In the Torres Strait community, the project funded the Queensland Aboriginal and Islander Health Council to employ RAs. Of the 101 local RAs (72 in Wave 1 and 57 in Wave 2, including 28 in both), all except seven were Aboriginal or Torres Strait Islander people. RAs received training on site from project staff for 1–3 days before each wave, followed by ongoing telephone and electronic support.
The main community surveys were conducted face to face, with results recorded on a computer tablet and data uploaded to a secure server. Depending on their answers, smokers generally completed the survey (including the consent process) in just under an hour, and non-smokers in 40 minutes, although some participants took much longer because of additional (unrecorded) “yarning” about the issues raised. Anonymous staff surveys were self-administered on paper or online and took 5–10 minutes to complete. The policy monitoring survey was completed on paper with key informants from the ACCHS at each wave.
Statistical methods
In this article, we compare baseline frequencies and percentages (by smoking status) for questions in the main community survey with unweighted and weighted results from the 2008 NATSISS. The NATSISS was a national, stratified, multistage, random, face-to-face household survey of 7823 Aboriginal and Torres Strait Islander adults and 5484 children conducted by the Australian Bureau of Statistics (ABS) from August 2008 to April 2009.16 Visitors and those not in private dwellings were excluded. We analysed these data using the ABS's Remote Access Data Laboratory, with replicate weights used to estimate random sampling error and confidence intervals, as previously described.17
Person weights were used to generalise results to the total Aboriginal and Torres Strait Islander population, based on the inverse of the probability of selection in the NATSISS calibrated to benchmarks based on combinations of age, sex, remoteness and state in the estimated resident population in private dwellings on 31 December 2008. The ABS adjusted these person weights further due to the high estimated 53% undercoverage, in particular for those selected not being contacted or not responding, and for Indigenous people not identifying themselves as Indigenous.16
For one item not available in the NATSISS (having seen a health professional in the past year), we made comparisons with the National Aboriginal and Torres Strait Islander Health Survey (NATSIHS), a similar ABS household survey of 5757 adults and 4682 children conducted from August 2004 to July 2005, using similar person and replicate weights.18 We also investigated the effect of the slightly different definitions of smoking status in our survey, the NATSISS and the Australian ITC Project surveys.
In other analyses of the baseline survey reported in this supplement, we mainly compared frequencies and percentages (by smoking status) for questions in the main community survey with weighted results from Australian ITC Project surveys — usually the most recent survey conducted by telephone or the internet from September 2011 to February 2012 (Wave 8.5, n = 1504). When appropriate (eg, if questions were not asked in the latest survey), we have made comparisons with earlier surveys.
As the Aboriginal and Torres Strait Islander population is much younger than the general Australian population, we weighted the Australian ITC Project results to the distribution of age (18–24, 25–34, 35–44, 45–54, ≥ 55 years), sex and smoking status (smoker, ex-smoker, never-smoker) in the total Aboriginal and Torres Strait Islander population in the 2008 NATSISS, analogous to direct standardised comparisons. We concentrated comparisons on daily smokers, due to slightly different definitions of smokers in each survey which meant that only daily and weekly smokers were directly comparable.
We examined associations between variables in our main community sample using either simple logistic regression or multiple logistic regression (adjusted for sociodemographic and other variables) to generate odds ratios and Wald tests. Stata 13 (StataCorp) survey [SVY] commands were used to adjust for the sampling design, using 35 site clusters and eight strata based on age (18–34 v ≥ 35 years), sex and smoking status (smokers and recent ex-smokers v non-smokers).19
Similar statistical methods were used to analyse results of the policy monitoring and staff surveys. However, given the different age and sex structure of Aboriginal and Torres Strait Islander staff at ACCHSs, staff responses have been weighted as above for comparisons with the community survey or the NATSISS.
As data from the follow-up survey (Wave 2) are not yet available and are not included in this supplement, we have not described the statistical methods for these longitudinal analyses.
Results
The Wave 1 survey sample included 2522 community members: 1643 smokers, 78 ex-smokers who quit ≤ 12 months previously, 233 ex-smokers who quit > 12 months previously, and 568 never-smokers. At the five sites with participation data available, a median of 9% of those approached by RAs refused to participate, with marked variation between sites. Only 37 participants were excluded because they were ineligible; a further 12 people did not complete the full survey but were retained in the final sample. Of the eligible smokers and recent ex-smokers, 75% (1295/1721) consented to be recontacted in Wave 2, and 49% (849/1721) were successfully recontacted and resurveyed.
The representativeness of the 645 staff surveyed is discussed elsewhere in this supplement, but as we were not able to determine the exact number of current staff in each ACCHS, we could not determine what proportion had been surveyed.20
Generalisability and comparison of our sample with other surveys
Our Wave 1 sample closely matched the distribution of the Aboriginal and Torres Strait Islander population in the weighted NATSISS by age, sex, jurisdiction and remoteness (Box 2). Similarly, most of our sample (89%) identified as Aboriginal, 5% as Torres Strait Islander, and 6% as both, compared with 91%, 6% and 3%, respectively, of Indigenous people aged ≥ 20 years in the 2011 Census.22
However, compared with the weighted NATSISS, our sample had higher proportions of participants who were from less disadvantaged areas, were unemployed, had completed Year 12 at school, and reported speaking an Indigenous language at home or being treated unfairly because they were Indigenous (Box 2). Among smokers only, a higher proportion had poor or fair self-reported health (Box 3). A higher proportion of smokers in our sample were non-daily smokers and, among the non-smokers, a higher proportion were never-smokers. However, similar proportions of smokers in our sample and the NATSISS reported having attempted to quit in the past year, and daily smokers reported similar numbers of cigarettes smoked per day (Box 3).
The unweighted NATSISS included smaller proportions of participants from the two jurisdictions with most Aboriginal and Torres Strait Islander people (New South Wales and Queensland), non-remote areas and the youngest age group (18–24 years) compared with the population benchmarks used for providing the weighted NATSISS estimates. Apart from these weighting variables, there were only small differences between the unweighted and weighted NATSISS estimates for the other common variables.
Discussion
The 2008 NATSISS and related Aboriginal and Torres Strait Islander health and social surveys conducted by the ABS are assumed to provide the most accurate available national estimates of the prevalence of key smoking-related and other health and social indicators. Unfortunately, access to detailed data from the most recent survey in this series, with its lower estimate of smoking prevalence, was not available at the time of writing.1 Sampling errors in the NATSISS are small and can be estimated due to the probabilistic sampling design. However, the ABS acknowledges that non-sampling errors due to the large level of undercoverage in the 2008 NATSISS may introduce bias, if, for example, the estimated 31% of Indigenous people screened in areas other than discrete Indigenous communities who did not identify as Indigenous were different from those who did identify and so could participate.16 Similarly, those excluded from the sample because they were not usual residents of private dwellings (eg, visitors and people in hostels, caravan parks, prisons or hospitals) may have responded differently to those who were included.
In contrast, it is not considered statistically acceptable to estimate sampling error in our non-probabilistic quota sample, and confidence intervals for prevalence estimates are not included. Probabilistic sampling was considered impractical in this instance, and accommodating local practical concerns in our sampling was part of building strong relationships with the local ACCHSs, RAs and communities.13 These relationships not only facilitated the use of local and national results by ACCHSs, but built local trust in the research, reducing non-sampling bias and facilitating follow-up. We felt people would be more comfortable talking with a known RA from the local community than with an outsider. In contrast, the NATSISS was administered by ABS interviewers, only accompanied by local Indigenous facilitators in discrete Indigenous communities “where possible”.16 This may explain the higher proportions of people in our sample who reported speaking an Indigenous language at home or being treated unfairly because they were Indigenous.
The distribution of some sociodemographic factors was different in the NATSISS and our sample: our sample had higher proportions of unemployed people, but also higher proportions who had completed Year 12 and who lived in more advantaged areas. As our sample purposefully oversampled smokers (and recent ex-smokers), we have not combined smokers and non-smokers and have avoided providing estimates for the total sample in this and other articles in the supplement, as smokers and non-smokers vary for many of the variables we examined.
Potential bias may have been introduced by using the local ACCHSs to access the community, as we would expect people with greater links to the health services to be sampled. However, similar proportions of participants in our sample reported seeing a health professional in the past year as for the narrower question about seeing a doctor in the NATSIHS. The poorer self-reported health among smokers in our sample than in the NATSISS may be due to bias by sampling through ACCHSs or by this question coming at the end of a long survey specifically about smoking rather than as part of a much broader social survey in the NATSISS. Nevertheless, Aboriginal and Torres Strait Islander people with connections to an ACCHS may be different to others who have limited links to their local ACCHS or who do not live near an ACCHS. However, most tobacco control activity specifically targeting Aboriginal and Torres Strait Islander peoples has been delivered through ACCHSs, so our sample is focused on those who are also the target of this activity.
It is uncertain what potential biases were introduced by the compensation provided, or the differences in compensation, but we expect these to be small.
Unlike either ABS or other ITC Project surveys, we based smoking status entirely on self-definition rather than using additional probing questions. Other ITC Project surveys excluded smokers who said they had smoked less than 100 cigarettes in their lifetime and those who smoked less than monthly, but when recontacted smokers then said they smoked less than monthly, they were asked to self-identify as either smokers or ex-smokers (and then treated accordingly). In the 2008 NATSISS, the question about 100 lifetime cigarettes was only used to distinguish between ex-smokers and never-smokers. In our sample, 33 smokers and 36 ex-smokers said they had not smoked 100 lifetime cigarettes, and 16 of the total sample answered “don't know”. We are concerned that this question may be sometimes misinterpreted in this population. As our sample included 64 less-than-monthly smokers, in this supplement we have concentrated our comparisons with Australian ITC Project results on daily smokers rather than all smokers.
In summary, we found no evidence of large systematic bias in our sample and, with appropriate caution, we can compare our prevalence estimates, cross-sectional associations and longitudinal analyses with other surveys, and generalise our findings to the national Aboriginal and Torres Strait Islander population. We are most confident in the methodological strengths of the longitudinal design and future longitudinal analyses.7 More caution is needed in interpreting our prevalence estimates, but in spite of the methodological uncertainties of using a non-probabilistic sample, we believe this, like many other quota samples, is likely to give estimates similar to a probabilistic sample (which may be subject to different biases, as we have shown with the NATSISS).23
We do not report confidence intervals around our prevalence estimates, only report percentages of our sample to the nearest integer, and concentrate on large differences from other samples. Similarly, we have chosen not to present results at the state or territory level, in spite of policy interest, as for many jurisdictions the sample sizes were small and from a small number of clusters, and the results are not generalisable to the entire state or territory. Some caution is necessary in comparisons with Australian ITC Project results, as our survey was administered face to face, and Australian ITC Project surveys were conducted on the telephone or internet, which can influence how people respond to some questions.7
In conclusion, the TATS project provides a detailed and nationally representative description of Aboriginal and Torres Strait Islander smoking behaviour, attitudes, knowledge and exposure to tobacco control activities and policies and their association with quitting, and comparisons with other contexts. This information has the potential to transform the evidence base being used to inform policies and programs to reduce Aboriginal and Torres Strait Islander smoking and the preventable illness and suffering it causes.
2 Comparison of sociodemographic characteristics of the baseline community sample in the Talking About The Smokes (TATS) project with the 2008 National Aboriginal and Torres Strait Islander Social Survey (NATSISS)*
Smokers† | Non-smokers† | ||||||||||||||
TATS (n = 1643) | NATSISS (n = 3612) | TATS (n = 879) | NATSISS (n = 3551) | ||||||||||||
Characteristic | % (n) | Unweighted, % (n) | Weighted, % (95% CI) | % (n) | Unweighted, % (n) | Weighted, % (95% CI) | |||||||||
Jurisdiction | |||||||||||||||
New South Wales | 27% (441) | 15.1% (547) | 30.0% (27.9%–32.1%) | 27% (241) | 13.9% (494) | 28.8% (26.7%–30.9%) | |||||||||
Victoria | 5% (82) | 17.0% (615) | 6.6% (6.0%–7.2%) | 6% (51) | 16.4% (581) | 6.7% (6.1%–7.2%) | |||||||||
Queensland | 31% (517) | 15.2% (550) | 26.3% (24.4%–28.2%) | 32% (283) | 15.7% (556) | 28.6% (26.6%–30.7%) | |||||||||
South Australia | 6% (94) | 10.0% (360) | 5.7% (5.1%–6.3%) | 5% (43) | 9.6% (340) | 5.4% (4.8%–6.0%) | |||||||||
Western Australia | 12% (203) | 14.4% (521) | 12.8% (11.6%–14.1%) | 14% (124) | 14.8% (525) | 14.0% (12.8%–15.3%) | |||||||||
Northern Territory | 11% (179) | 17.8% (643) | 14.3% (13.1%–15.6%) | 9% (75) | 16.2% (575) | 11.7% (10.5%–13.0%) | |||||||||
Tasmania‡ | 3% (47) | na | na | 3% (26) | na | na | |||||||||
Australian Capital Territory‡ | 5% (80) | na | na | 4% (36) | na | na | |||||||||
Tasmania and ACT combined‡ | 8% (127) | 10.4% (376) | 4.3% (3.9%–4.8%) | 7% (62) | 13.5% (480) | 4.9% (4.4%–5.4%) | |||||||||
Area-level disadvantage§ | |||||||||||||||
1st quintile (most disadvantaged) | 39% (640) | 65.9% (2380) | 60.3% (55.2%–65.2%) | 32% (277) | 53.0% (1882) | 46.7% (41.5%–51.9%) | |||||||||
2nd and 3rd quintiles | 42% (683) | 24.7% (891) | 28.2% (23.8%–33.1%) | 47% (409) | 31.5% (1117) | 36.8% (31.8%–42.2%) | |||||||||
4th and 5th quintiles | 19% (320) | 9.4% (341) | 11.5% (8.9%–14.7%) | 22% (193) | 15.5% (552) | 16.5% (13.3%–20.3%) | |||||||||
Remoteness | |||||||||||||||
Non-remote | 77% (1258) | 63.4% (2399) | 71.8% (70.1%–73.5%) | 80% (700) | 69.1% (2789) | 78.0% (76.5%–79.3%) | |||||||||
Remote | 23% (385) | 36.6% (1385) | 28.2% (26.5%–29.9%) | 20% (179) | 31.0% (1250) | 22.0% (20.7%–23.5%) | |||||||||
Age (years) | |||||||||||||||
18–24 | 21% (346) | 19.5% (703) | 24.7% (22.6%–26.9%) | 25% (219) | 16.6% (591) | 21.8% (20.0%–23.7%) | |||||||||
25–34 | 27% (441) | 28.6% (1034) | 26.9% (25.4%–28.5%) | 22% (195) | 21.8% (775) | 21.2% (19.7%–22.7%) | |||||||||
35–44 | 24% (400) | 24.5% (884) | 23.4% (21.8%–25.0%) | 17% (150) | 20.5% (729) | 20.5% (19.0%–22.2%) | |||||||||
45–54 | 17% (274) | 15.9% (575) | 15.5% (14.1%–17.0%) | 17% (151) | 17.0% (605) | 16.7% (15.4%–18.2%) | |||||||||
≥ 55 | 11% (182) | 11.5% (416) | 9.5% (8.4%–10.7%) | 19% (164) | 24.0% (851) | 19.8% (18.6%–21.0%) | |||||||||
Sex | |||||||||||||||
Female | 52% (848) | 55.3% (1998) | 50.1% (48.0%–52.1%) | 56% (488) | 58.8% (2088) | 55.3% (53.3%–57.3%) | |||||||||
Male | 48% (795) | 44.7% (1614) | 49.9% (47.9%–52.0%) | 44% (391) | 41.2% (1463) | 44.7% (42.7%–46.7%) | |||||||||
Labour force status | |||||||||||||||
Employed | 35% (574) | 47.9% (1731) | 48.5% (45.8%–51.2%) | 48% (423) | 57.5% (2041) | 59.4% (56.3%–62.4%) | |||||||||
Unemployed | 34% (565) | 11.8% (426) | 13.1% (11.3%–15.2%) | 22% (191) | 5.5% (195) | 6.1% (4.9%–7.6%) | |||||||||
Not in labour force | 31% (502) | 40.3% (1455) | 38.3% (35.9%–40.8%) | 30% (265) | 37.0% (1315) | 34.5% (32.0%–37.1%) | |||||||||
Highest education attained | |||||||||||||||
Less than Year 12 | 52% (842) | 63.1% (2278) | 62.9% (59.9%–65.8%) | 40% (351) | 50.4% (1789) | 48.7% (45.7%–51.6%) | |||||||||
Finished Year 12 | 27% (434) | 7.7% (278) | 9.4% (7.9%–11.2%) | 29% (253) | 11.8% (420) | 13.9% (12.2%–15.7%) | |||||||||
Post-school qualification | 22% (351) | 29.2% (1056) | 27.7% (25.2%–30.3%) | 31% (269) | 37.8% (1342) | 37.5% (34.9%–40.2%) | |||||||||
Housing tenure | |||||||||||||||
Owns or purchasing home | 14% (230) | 18.9% (679) | 19.9% (17.3%–22.9%) | 23% (203) | 37.8% (1337) | 38.3% (35.4%–41.3%) | |||||||||
Renter or other | 86% (1400) | 81.1% (2907) | 80.1% (77.1%–82.7%) | 77% (672) | 62.2% (2196) | 61.7% (58.7%–64.6%) | |||||||||
Speaks an Indigenous language at home | |||||||||||||||
No | 78% (1262) | 85.3% (3082) | 86.8% (84.3%–88.9%) | 80% (694) | 86.9% (3085) | 88.7% (86.8%–90.3%) | |||||||||
Yes | 22% (365) | 14.7% (530) | 13.2% (11.1%–15.7%) | 20% (178) | 13.1% (466) | 11.3% (9.7%–13.2%) | |||||||||
Treated unfairly because Indigenous in past year | |||||||||||||||
No | 43% (690) | 68.6% (2476) | 69.1% (66.3%–71.8%) | 51% (443) | 75.5% (2680) | 75.2% (72.6%–77.6%) | |||||||||
Yes | 57% (908) | 31.5% (1136) | 30.9% (28.2%–33.7%) | 49% (420) | 24.5% (871) | 24.8% (22.4%–27.4%) | |||||||||
na = not available. * Percentages exclude those who did not answer or answered “don't know”. † Data for smokers include current smokers only, and data for non-smokers include all ex-smokers and never-smokers. ‡ The Australian Bureau of Statistics (ABS) only provides researchers with combined NATSISS results for Tasmania and the ACT. § The TATS project used postcodes and concordance tables for the ABS 2011 Socio-Economic Indexes for Areas (SEIFA) Index of Relative Socio-economic Disadvantage (IRSD).21 The NATSISS used the 2006 SEIFA IRSD directly from Census Collection Districts. | |||||||||||||||
3 Comparison of smoking and health status of the baseline community sample in the Talking About The Smokes (TATS) project with the 2008 National Aboriginal and Torres Strait Islander Social Survey (NATSISS)*
Smokers† | Non-smokers† | ||||||||||||||
TATS (n = 1643) | NATSISS (n = 3612) | TATS (n = 879) | NATSISS (n = 3551) | ||||||||||||
Characteristic | % (n) | Unweighted, % (n) | Weighted, % (95% CI) | % (n) | Unweighted, % (n) | Weighted, % (95% CI) | |||||||||
Smoking status | |||||||||||||||
Daily smoker | 85% (1392) | 95.2% (3439) | 95.7% (94.5%–96.6%) | — | — | — | |||||||||
Non-daily smoker | 15% (251) | 4.8% (173) | 4.3% (3.4%–5.5%) | — | — | — | |||||||||
Ex-smoker | — | — | — | 35% (311) | 43.8% (1554) | 42.6% (39.9%–45.4%) | |||||||||
Never-smoker | — | — | — | 65% (568) | 56.2% (1997) | 57.4% (54.6%–60.1%) | |||||||||
Cigarettes per day (daily smokers only) | |||||||||||||||
1–10 | 40% (547) | 43.9% (1502) | 43.9% (41.0%–46.7%) | — | — | — | |||||||||
11–20 | 39% (528) | 34.1% (1164) | 34.1% (31.5%–36.7%) | — | — | — | |||||||||
21–30 | 18% (242) | 17.5% (598) | 17.0% (15.1%–18.9%) | — | — | — | |||||||||
≥ 31 | 4% (54) | 4.5% (155) | 5.0% (3.7%–6.3%) | — | — | — | |||||||||
Quit attempt in past year | |||||||||||||||
No | 51% (813) | 56.1% (1990) | 55.3% (52.6%–58%) | — | — | — | |||||||||
Yes | 49% (796) | 43.9% (1560) | 44.7% (42%–47.4%) | — | — | — | |||||||||
Self-reported health status | |||||||||||||||
Poor or fair | 45% (735) | 27.3% (985) | 26.2% (23.7%–28.8%) | 24% (209) | 23.7% (842) | 22.6% (20.3%–25.0%) | |||||||||
Good | 40% (653) | 35.7% (1290) | 36.3% (33.6%–39.2%) | 43% (367) | 32.8% (1164) | 32.4% (29.8%–35.1%) | |||||||||
Excellent or very good | 15% (238) | 37.0% (1337) | 37.5% (35.1%–40.0%) | 33% (281) | 43.5% (1545) | 45.0% (42.0%–48.0%) | |||||||||
Seen by doctor/health professional in past year‡ | |||||||||||||||
Yes | 75% (1225) | 77.2% (2308) | 75.2% (72.5%–77.6%) | 85% (741) | 83.0% (2251) | 82.0% (79.6%–84.1%) | |||||||||
No | 25% (399) | 22.8% (683) | 24.8% (22.4%–27.5%) | 15% (134) | 17.0% (460) | 18.0% (15.9%–20.4%) | |||||||||
* Percentages exclude those who did not answer or answered “don't know”. † Data for smokers include current smokers only, and data for non-smokers include all ex-smokers and never-smokers. ‡ As this question was not asked in the NATSISS, comparison is with the 2004–05 National Aboriginal and Torres Strait Islander Health Survey (NATSIHS). The TATS project question asked whether the participant had seen a health worker, doctor, nurse or other health professional in the past year. The NATSIHS question asked only about the time since the participant had last consulted a doctor. | |||||||||||||||
Provenance: Not commissioned; externally peer reviewed.
- David P Thomas1
- Viki L Briggs2
- Sophia Couzos3
- Maureen E Davey4
- Jennifer M Hunt5
- Kathryn S Panaretto6
- Anke E van der Sterren2
- Matthew Stevens1
- Anna K Nicholson1
- Ron Borland7
- 1 Menzies School of Health Research, Darwin, NT.
- 2 University of Melbourne, Melbourne, VIC.
- 3 James Cook University, Townsville, QLD.
- 4 Aboriginal Health Service, Tasmanian Aboriginal Centre, Hobart, TAS.
- 5 Aboriginal Health & Medical Research Council, Sydney, NSW.
- 6 University of South Australia, Adelaide, SA.
- 7 Cancer Council Victoria, Melbourne, VIC.
The participating health services and members of the research team and Project Reference Group are acknowledged in the Appendix, and we would also like to acknowledge previous members for their contributions to the development of the research protocol.
No relevant disclosures.
- 1. Australian Bureau of Statistics. Australian Aboriginal and Torres Strait Islander Health Survey: updated results, 2012–13. Canberra: ABS, 2014. (ABS Cat. No. 4727.0.55.006.)
- 2. Begg S, Vos T, Barker B, et al. The burden of disease and injury in Aboriginal and Torres Strait Islander peoples 2003. Brisbane: School of Population Health, University of Queensland, 2007.
- 3. Vos T, Barker B, Begg S, et al. Burden of disease and injury in Aboriginal and Torres Strait Islander Peoples: the Indigenous health gap. Int J Epidemiol 2009; 38: 470-477.
- 4. Intergovernmental Committee on Drugs. National Tobacco Strategy 2012-2018. Canberra: Australian Government, 2012. http://www.nationaldrugstrategy.gov.au/internet/drugstrategy/publishing.nsf/Content/national_ts_2012_2018 (accessed Apr 2015).
- 5. World Health Organization. WHO Framework Convention on Tobacco Control. Geneva: WHO, 2003. http://whqlibdoc.who.int/publications/2003/9241591013.pdf (accessed Dec 2014).
- 6. Fong GT, Cummings KM, Borland R, et al. The conceptual framework of the International Tobacco Control (ITC) Policy Evaluation Project. Tob Control 2006; 15 Suppl 3: iii3-iii11.
- 7. International Agency for Research on Cancer. IARC handbooks of cancer prevention: tobacco control. Volume 12. Methods for evaluating tobacco control policies. Lyon: IARC, 2008.
- 8. Casswell S, Meier P, MacKintosh AM, et al. The International Alcohol Control (IAC) study – evaluating the impact of alcohol policies. Alcohol Clin Exp Res 2012; 36: 1462-1467.
- 9. Couzos S, Nicholson AK, Hunt JM, et al. Talking About The Smokes: a large-scale, community-based participatory research project. Med J Aust 2015; 202 (10 Suppl): S13-S19. <MJA full text>
- 10. International Tobacco Control Policy Evaluation Project. Four Country Project: Waves 2-8 technical report. Waterloo, Canada: University of Waterloo, 2011. http://www.itcproject.org/files/Report_Publications/Technical_Report/4c-w28-tech-report-sept2011.pdf (accessed Dec 2014).
- 11. Barr ML, Dillon A, Kassis M, Steel DG. Telephone surveys provide reliable information on risk behaviours and health status of Aboriginal and Torres Strait Islander people. Aust N Z J Public Health 2013; 37: 91-92.
- 12. National Health and Medical Research Council. Values and ethics: guidelines for ethical conduct in Aboriginal and Torres Strait Islander health research. Canberra: Commonwealth of Australia, 2003. https://www.nhmrc.gov.au/guidelines/publications/e52 (accessed Oct 2014).
- 13. Laycock A, Walker D, Harrison N, Brands J. Researching Indigenous health: a practical guide for researchers. Melbourne: The Lowitja Institute, 2011.
- 14. Australian Bureau of Statistics. Australian demographic statistics, Mar 2012. Canberra: ABS, 2007. (ABS Cat. No. 3101.0.)
- 15. Australian Bureau of Statistics. Population characteristics, Aboriginal and Torres Strait Islander Australians, 2006. Canberra: ABS, 2010. (ABS Cat. No. 4713.0.)
- 16. Australian Bureau of Statistics. National Aboriginal and Torres Strait Islander Social Survey, 2008. Canberra: ABS, 2009. (ABS Cat. No. 4714.0.)
- 17. Thomas D. National trends in Aboriginal and Torres Strait Islander smoking and quitting, 1994-2008. Aust N Z J Public Health 2012; 36: 24-29.
- 18. Australian Bureau of Statistics. National Aboriginal and Torres Strait Islander Health Survey, 2004-05. Canberra: ABS, 2006. (ABS Cat. No. 4715.0.)
- 19. StataCorp. Stata survey data reference manual: release 13. College Station, Tex: Stata Press, 2013. http://www.stata.com/manuals13/svy.pdf (accessed Sep 2014).
- 20. Thomas DP, Davey ME, Panaretto KS, et al. Smoking among a national sample of Aboriginal and Torres Strait Islander health staff. Med J Aust 2015; 202 (10 Suppl): S85-S89. <MJA full text>
- 21. Australian Bureau of Statistics. Census of Population and Housing: Socio-Economic Indexes for Areas (SEIFA), Australia, 2011. Canberra: ABS, 2013. (ABS Cat. No. 2033.0.55.001.) http://www.abs.gov.au/ausstats/abs@.nsf/Lookup/by%20Subject/2033.0.55.001~2011~Main%20Features~Main%20Page~1 (accessed Dec 2014).
- 22. Australian Bureau of Statistics. Estimates of Aboriginal and Torres Strait Islander Australians, June 2011. Canberra: ABS, 2013. (ABS Cat. No. 3238.0.55.001.)
- 23. Dorofeev S, Grant P. Statistics for real-life surveys: non-simple-random samples and weighted data. Cambridge: Cambridge University Press, 2006.
Abstract
Objective: To describe the research methods and baseline sample of the Talking About The Smokes (TATS) project.
Design: The TATS project is a collaboration between research institutions and Aboriginal community-controlled health services (ACCHSs) and their state and national representative bodies. It is one of the studies within the International Tobacco Control Policy Evaluation Project, enabling national and international comparisons. It includes a prospective longitudinal study of Aboriginal and Torres Strait Islander smokers and recent ex-smokers; a survey of non-smokers; repeated cross-sectional surveys of ACCHS staff; and descriptions of the tobacco policies and practices at the ACCHSs. Community members completed face-to-face surveys; staff completed surveys on paper or online. We compared potential biases and the distribution of variables common to the main community baseline sample and unweighted and weighted results of the 2008 National Aboriginal and Torres Strait Islander Social Survey (NATSISS). The baseline survey (Wave 1) was conducted between April 2012 and October 2013.
Setting and participants: 2522 Aboriginal and Torres Strait Islander people in 35 locations (the communities served by 34 ACCHSs and one community in the Torres Strait), and 645 staff in the ACCHSs.
Main outcome measures: Sociodemographic and general health indicators, smoking status, number of cigarettes smoked per day and quit attempts.
Results: The main community baseline sample closely matched the distribution of the Aboriginal and Torres Strait Islander population in the weighted NATSISS by age, sex, jurisdiction and remoteness. There were inconsistent differences in some sociodemographic factors between our sample and the NATSISS: our sample had higher proportions of unemployed people, but also higher proportions who had completed Year 12 and who lived in more advantaged areas. In both surveys, similar percentages of smokers reported having attempted to quit in the past year, and daily smokers reported similar numbers of cigarettes smoked per day.
Conclusion: The TATS project provides a detailed and nationally representative description of Aboriginal and Torres Strait Islander smoking behaviour, attitudes, knowledge and exposure to tobacco control activities and policies, and their association with quitting.