


In Queensland, 2009 and 2010 were epidemic years for pertussis. New patterns of disease emerged, with particularly high rates of pertussis notification for those aged 6 – < 12 years despite high primary course and booster vaccine coverage for more than a decade. A similar disease pattern was observed in California.1 Evidence from Qld,2 California3-6 and Oregon7 indicates that changing from whole-cell to acellular pertussis vaccine in the late 1990s8,9 contributed to recent pertussis epidemiology. In Qld and Northern California, the highest notification rates during 2010 occurred in the first birth cohorts to receive acellular pertussis vaccine. North American studies describe rapid waning of protection following a five-dose course of acellular pertussis vaccine.4,5,10 Data from Qld2 and Oregon7 showed a primary course of whole-cell vaccine, or at least the first dose of the primary course being whole-cell vaccine, provided significantly greater protection against pertussis than priming with acellular pertussis vaccine alone. These findings are supported by earlier work from Canada, which suggests that the median time until disease following the most recent vaccine dose may be shorter in children who receive acellular pertussis vaccine compared with children who receive whole-cell pertussis vaccine.11
Pertussis vaccination is available to children as part of the publicly funded National Immunisation Program.8 Due to adverse events associated with the whole-cell pertussis vaccine,12 acellular pertussis vaccine was introduced into the National Immunisation Program in 1997. The acellular vaccine (principally the three-component type) completely replaced the whole-cell vaccine by 1999 (Appendix 1).8
We sought to assess the effectiveness of acellular pertussis vaccine during 2009 and 2010 in Qld. Recognising the potential influence that changes in testing patterns may have on pertussis notification rates and vaccine effectiveness (VE) estimates,13 we also investigated pertussis notification rates between 2008 and 2010 and laboratory testing patterns during 2009 and 2010 for Qld children.
We obtained confirmed pertussis notification data from the Qld notifiable diseases database and calculated annual age-specific notification rates for children aged 1 – < 12 years between 2008 and 2010. According to the national guidelines, pertussis case confirmation requires one of the following: definitive laboratory evidence; suggestive laboratory evidence and clinical evidence; or clinical evidence and epidemiological evidence.14
Definitive laboratory evidence consists of Bordetella pertussis isolation by culture or detection via a nucleic acid amplification test, such as a polymerase chain reaction (PCR) assay. Suggestive laboratory evidence is most commonly met by identifying a single high serum IgA titre to pertussis antigens or evidence of seroconversion. Clinical evidence for confirmed cases requires a coughing illness lasting ≥ 2 weeks or one of the following: coughing paroxysms, inspiratory whoop or post-tussive vomiting. Epidemiological evidence consists of contact between two people at a time when one of them is likely to be infectious and the other becomes symptomatic 6–20 days later, with at least one case in the chain of epidemiologically linked cases having been being confirmed with suggestive or definitive laboratory evidence.
Two major Qld pathology providers — Pathology Queensland, the publicly funded laboratory service, and Sullivan Nicolaides Pathology, a private company — provided data on pertussis serological tests and PCR assays undertaken at their laboratories in 2009 and 2010 for Qld residents. These providers were responsible for about 40% of pertussis notifications in Qld during the study period. We did not include culture results to determine pertussis testing patterns because culture was performed infrequently and mostly on specimens also tested by PCR. We describe the numbers of serological and PCR tests, and the results of these tests, by age and year of test for children aged 1 – < 12 years.
We calculated estimates of acellular pertussis VE against pertussis notification and hospitalisation in 2009 and 2010. To restrict the analysis to children who exclusively received acellular pertussis vaccine, only those residing in Qld and born in 1999 or later were included. We excluded second notifications or hospitalisations that occurred in the same individual during the same calendar year. We retrieved data on hospitalisations with a pertussis code in any diagnostic field from all Qld public and private hospitals.15 Due to small admission numbers, VE against hospitalisation was only calculated for children aged 1 – < 4 years as a single age group.
Changes in the acellular pertussis vaccine type and schedule delivered to Qld children during the study period included removing the 18-month booster dose in 2003 and introducing an adolescent booster dose in 2004 (Appendix 1). Children were considered fully vaccinated if they had received the recommended number of pertussis-containing vaccines for their age according to the schedule at the time. This meant that children in the 2006–2008, 2002–2004 and 1999–2001 birth cohorts were considered fully vaccinated if they had received three doses (primary course only), four doses (primary course plus 4-year booster) and five doses (primary course plus 18-month and 4-year boosters), respectively.
VE was calculated using the screening method, which involves comparing the proportion vaccinated among people who had a case of disease (PCV) with the proportion of the study population that is vaccinated (PPV).16 We obtained the vaccination status of patients who had a case of pertussis from Queensland Health’s Vaccination Information and Vaccination Administration System. As this register does not include children who have not received any vaccines, we obtained aggregated population coverage data for Qld for each birth cohort from the national, population-based Australian Childhood Immunisation Register (ACIR). Vaccinations recorded < 2 weeks before illness onset were excluded from calculations. The “third-dose assumption” was used in all VE calculations — children are assumed to have received the first two doses of a three-dose course if their third dose is recorded. The validity of this assumption has been demonstrated for the ACIR.17 Partially vaccinated children were excluded from PCV and PPV calculations. VE was not calculated for children aged < 1 or 4 – < 5 years as their vaccination status changed during the period of analysis due to receipt of the primary course or 4-year booster.
VE estimates and 95% confidence intervals were obtained by fitting logistic regression models with the outcome variable as the vaccination status of the patient with pertussis and offset for the logit of PPV.16 We fitted constant-only models for each stratum of birth cohort and notification year. When estimating the association between birth cohort and VE, we included birth cohort as a main effect. Sensitivity analyses on diagnostic method (notified cases confirmed by PCR or culture versus all notified cases) and hospital coding (hospitalisations with a pertussis code listed as the principal diagnosis versus hospitalisations with a pertussis code in any diagnostic field) were performed. Stata version 12 (StataCorp) was used for the analysis.
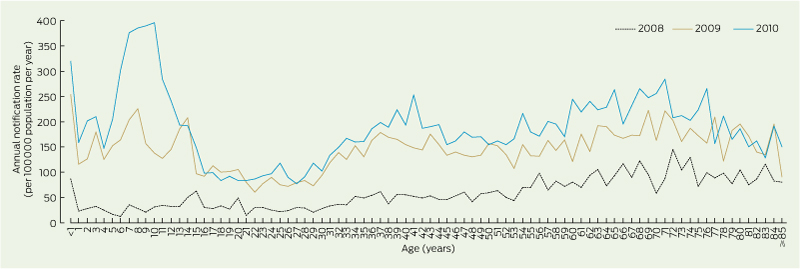
Pertussis notification rates increased substantially in 2009 and 2010 from pre-epidemic 2008 levels. The highest rates were in 2010, for children aged 7 – < 11 years (Box 1).
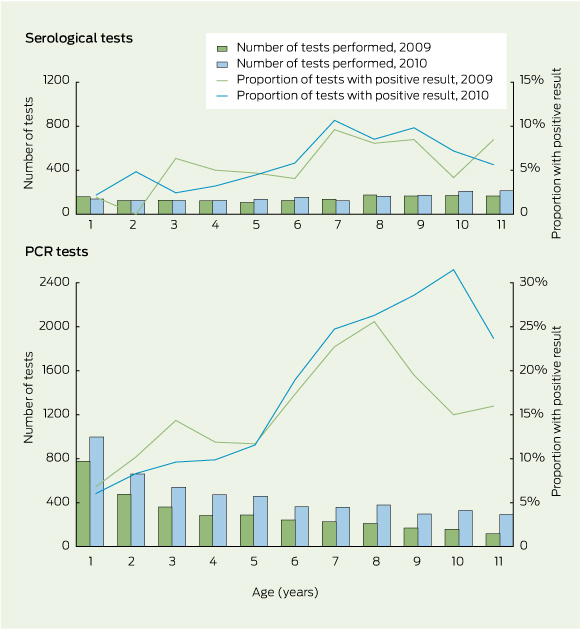
The numbers of pertussis tests performed and relative contribution of PCR tests for children aged 1 – < 12 years increased between 2009 and 2010 (Box 2). The proportions of PCR tests with a positive result were highest in the older children and increased in children aged 6 – < 12 years between 2009 and 2010 (Box 2). The proportions of serological tests with a positive result were lower, but followed a similar pattern to that for the PCR tests (Box 2).
In total, 1961 pertussis notifications and 29 pertussis hospitalisations were included in the VE calculations (Appendix 2).
In 2009, point estimates of three-dose primary course VE against pertussis notification were 87.0% and 89.4% for the 2007 and 2006 birth cohorts, respectively, similar to that for preventing hospitalisation (87.1%) (Box 3; Appendix 3). Point estimates of VE for children aged 5 – < 11 years — who should have received the primary-course, 4-year booster and largely also the 18-month booster — ranged from 71.2% in the 2000 birth cohort to 87.7% in the 2003 birth cohort.
In 2010, point estimates of three-dose primary course VE against pertussis notification remained high (83.5% and 85.4% for the 2008 and 2007 birth cohorts, respectively) (Box 3; Appendix 3). Point estimates of VE were lower for children aged 5 – < 12 years in 2010 compared with those for children aged 5 – < 11 years in 2009. Among these older cohorts, 2010 VE point estimates ranged between 55.3% and 70.3%, with the exception of the 2002 cohort, which had a VE estimate of 34.7%. VE against pertussis notification waned with increasing age in 2009 (P = 0.006) and 2010 (P < 0.001).
Restricting the analysis to notified cases that were cases confirmed by PCR or culture, all 2009 VE point estimates and a majority of 2010 VE estimates changed by six or fewer percentage points, and no overall consistent pattern emerged (Box 3). However, VE point estimates for several birth cohorts were substantially lower in 2010 for cases confirmed by PCR or culture. The trend of waning VE with age remained significant among cases confirmed by PCR or culture (P = 0.001 for 2009; P < 0.001 for 2010).
For children aged 1 – < 4 years, the VE estimates for the three-dose primary course against hospitalisation were 87.1% and 85.6% in 2009 and 2010, respectively (Box 3). Restricting the analysis to hospitalisations with a pertussis code in the principal diagnoses field yielded similar results.
The primary course of acellular pertussis vaccine was highly effective in protecting children aged 1 – < 4 years against pertussis notification and hospitalisation in Qld during the epidemic years of 2009 and 2010. Our VE estimates are similar to findings for predominantly whole-cell pertussis vaccine in the late 1990s in New South Wales, where VE was 85% for children aged 2 – < 5 years.18
However, our findings indicate that protection waned with increasing age following receipt of the 4-year booster and are consistent with the waning protection observed in the United States.4,5,10 The decline in point estimates for VE against notification in 2009, from 88% in children aged 5 – < 7 years to 71% and 80% among children aged 8 – < 10 and 9 – < 11 years, respectively, is similar to 2010 findings from California, where VE progressively declined from 95% for children 1 – < 2 years after their fifth pertussis vaccine dose to 71% for children ≥ 5 years after their fifth pertussis vaccine dose (recommended to be given at age 4–6 years).5 Overall, higher VE estimates were found for the whole-cell pertussis vaccine in NSW between 1996 and 1998 — 87% for children aged 5 – < 9 years and 78% for children aged 9 – < 14 years.18 This is consistent with evidence showing that the whole-cell vaccine used previously in Australia provided greater duration of protection against pertussis than the acellular vaccine.2 Despite the waning protection provided by acellular pertussis vaccine, we should ensure that high coverage with current vaccines is maintained until low-reactogenic vaccines providing sustained high-level protection against pertussis are developed.
As the screening method is very sensitive to small changes in coverage estimates, the accuracy of PPV estimates is important. Our study benefited from obtaining PPV values from the ACIR, which registers about 99% of Australian children by 12 months of age.19 Previous validation of ACIR data indicates that the most likely inaccuracy is that PPV will be underestimated,20 which, in isolation, may result in underestimating VE. A limitation affecting our study is that in the context of very high vaccination coverage, modest changes in PCV can lead to marked changes in VE estimates. Due to regional variation in immunisation coverage (estimated to be largely < 2%), our lack of geographical stratification may have biased statewide VE estimates in either direction. In addition, the small numbers of hospitalisations provide low precision for VE estimates against severe disease. The value of this method is in providing a broad overview of VE and changes in VE over time.21
In our study, VE point estimates were lower for 2010 compared with 2009, particularly among the older age groups. We are unable to explain the isolated low VE point estimate of 35% in 2010 among children born in 2002. While there is evidence of increasing circulation of vaccine-mismatched strains,22 we believe vaccine-driven selection pressure is unlikely to account for such rapid and uneven changes in VE estimates between 2009 and 2010, as this would require circulating pertussis strains to vary with childhood age group and change very rapidly over time.
Changes in diagnostic testing behaviour, owing to expanded availability and increased awareness of PCR testing,13 may have contributed to decreased VE estimates in 2010 compared with 2009. While we cannot be certain of the generalisability of the laboratory data that we used, they are probably broadly representative of pertussis testing in Qld because they accounted for about 40% of statewide pertussis notifications. Based on our data, use of the more sensitive, less invasive PCR assays for pertussis testing has increased rapidly in Qld. Before the widespread availability of PCR assays, clinicians may have been less likely to seek laboratory confirmation involving venepuncture, particularly for milder illness in children. Publicity about pertussis during the epidemic may have increased pertussis testing requests by clinicians; a recent study showed an almost 40% increase in testing between April 2009 to March 2010 and April 2010 to March 2011.23
Increases in awareness, testing and detection of milder disease, and the possibility that the vaccine may be less effective against milder disease, may have resulted in decreases in VE estimates.24 It may be hypothesised that through differential health care use, older children may be less likely to have milder disease diagnosed, leading to relatively high and stable VE estimates. However, point VE estimates among older children were substantially lower in 2010 compared with 2009. Increased testing is likely to have contributed substantially to high notification rates during the epidemic. However, the high and increasing proportion of pertussis tests with a positive result between 2009 and 2010 in older children suggests that the disease burden was truly greatest and increasing in 2010 among children aged 6 – < 12 years, consistent with notification patterns and waning protection following a four- or five-dose acellular vaccine course. A likely consequence of increased pertussis incidence among older children is increased transmission, which will have the greatest impact on infants.
In the era of predominant PCR use and heightened awareness, pertussis notification rates even during non-epidemic periods are likely to be substantially higher, and VE estimates for preventing notification may be consistently lower than recorded previously. This change in testing behaviour, leading to identification of milder disease, may require a recalibration of what are considered baseline notification rates and will need to be considered when interpreting future VE estimates.
2 Numbers of pertussis serological and polymerase chain reaction (PCR) tests by Queensland Health and Sullivan Nicolaides Pathology laboratories, and proportions with a positive result, for children aged 1 – < 12 years in 2009 and 2010, Queensland
3 Vaccine coverage and vaccine effectiveness (VE) against pertussis notification and hospitalisation using the “third-dose assumption” for children aged 1 – < 12 years in 2009 and 2010, Queensland, by birth cohort*
Notifications |
|
|
|
|
|
|
|
||||||||
Birth cohort |
Age, years |
Course used to assess VE |
PCV for all cases† |
PCV for PCR-positive and culture-positive cases† |
PPV‡ |
VE (95% CI) for all cases |
VE (95% CI) for PCR-positive and culture-positive cases |
||||||||
2009 notifications |
|
|
|
|
|
|
|||||||||
2007 |
1 – < 3 |
3 doses |
74.6% (50/67) |
71.4% (40/56) |
95.8% |
87.0% (77.5% to 92.5%) |
89.0% (80.3% to 93.8%) |
||||||||
2006 |
2 – < 4 |
3 doses |
71.8% (56/78) |
66.7% (42/63) |
96.0% |
89.4% (82.6% to 93.5%) |
91.7% (85.9% to 95.1%) |
||||||||
2003 |
5 – < 7 |
4 doses |
73.6% (64/87) |
73.9% (51/69) |
95.8% |
87.7% (80.1% to 92.3%) |
87.4% (78.5% to 92.7%) |
||||||||
2002§ |
6 – < 8 |
4 doses |
81.6% (71/87) |
80.6% (50/62) |
94.8% |
75.5% (57.8% to 85.7%) |
77.0% (56.7% to 87.8%) |
||||||||
2001 |
7 – < 9 |
5 doses |
77.4% (82/106) |
75.7% (56/74) |
94.5% |
80.3% (68.9% to 87.5%) |
82.0% (69.4% to 89.4%) |
||||||||
2000 |
8 – < 10 |
5 doses |
83.9% (78/93) |
86.0% (49/57) |
94.7% |
71.2% (49.9% to 83.4%) |
66.0% (28.3% to 83.9%) |
||||||||
1999 |
9 – < 11 |
5 doses |
77.8% (63/81) |
79.5% (35/44) |
94.7% |
80.3% (66.7% to 88.3%) |
78.1% (54.5% to 89.5%) |
||||||||
2010 notifications |
|
|
|
|
|
|
|||||||||
2008 |
1 – < 3 |
3 doses |
80.2% (93/116) |
84.2% (80/95) |
96.1% |
83.5% (73.9% to 89.5%) |
78.2% (62.1% to 87.4%) |
||||||||
2007 |
2 – < 4 |
3 doses |
78.0% (92/118) |
76.6% (72/94) |
96.0% |
85.4% (77.5% to 90.6%) |
86.5% (78.3% to 91.6%) |
||||||||
2004 |
5 – < 7 |
4 doses |
86.2% (131/152) |
88.1% (104/118) |
95.5% |
70.3% (53.0% to 81.3%) |
64.7% (38.3% to 79.8%) |
||||||||
2003 |
6 – < 8 |
4 doses |
86.1% (149/173) |
86.2% (119/138) |
95.0% |
67.3% (49.6% to 78.7%) |
67.0% (46.4% to 79.7%) |
||||||||
2002§ |
7 – < 9 |
4 doses |
91.7% (189/206) |
94.9% (148/156) |
94.5% |
34.7% (− 7.2% to 60.3%) |
− 8.6% (− 121.2% to 46.7%) |
||||||||
2001 |
8 – < 10 |
5 doses |
88.6% (164/185) |
90.8% (119/131) |
94.6% |
55.3% (29.6% to 71.6%) |
43.3% (− 2.7% to 68.7%) |
||||||||
2000 |
9 – < 11 |
5 doses |
88.7% (205/231) |
90.4% (142/157) |
94.7% |
56.2% (34.2% to 70.9%) |
47.5% (10.6% to 69.1%) |
||||||||
1999 |
10 – < 12 |
5 doses |
88.4% (160/181) |
86.8% (118/136) |
94.7% |
57.1% (32.4% to 72.8%) |
63.1% (39.4% to 77.5%) |
||||||||
Hospitalisations |
|
|
|
|
|
|
|
||||||||
Birth cohort |
Age, years |
Course used to assess VE |
PCV for all cases† |
PCV for principal diagnosis cases†¶ |
PPV‡ |
VE (95% CI) for all cases |
VE (95% CI) for principal diagnosis cases¶ |
||||||||
2009 hospitalisations |
|
|
|
|
|
|
|||||||||
2006–2007 |
1 – < 4 |
3 doses |
75.0% (15/20) |
66.7% (10/15) |
95.9% |
87.1% (65.6% to 95.3%) |
91.4% (74.9% to 97.1%) |
||||||||
2010 hospitalisations |
|
|
|
|
|
|
|||||||||
2007–2008 |
1 – < 4 |
3 doses |
77.8% (7/9) |
77.8% (7/9) |
96.1% |
85.6% (30.9% to 97.0%) |
85.6% (30.9% to 97.0%) |
||||||||
PCR = polymerase chain reaction. PCV = proportion vaccinated among people who had a case of pertussis. PPV = proportion of study population that is vaccinated. * VE not calculated for children < 1 year of age in 2009 and 2010, and for the birth cohorts of 2004–2005 in 2009 and 2005–2006 in 2010, as the vaccination status of these cohorts was changing during the period of analysis due to receipt of either their primary course or 4-year booster. † Data are percentage (number fully vaccinated/total). Fully vaccinated is defined as: receipt of third dose for 2006–2008 birth cohorts; receipt of third dose and 4-year booster for 2002 and 2003 birth cohorts; and receipt of third dose, 18-month booster and 4-year booster for 1999–2001 birth cohorts. Total is defined as: number of fully vaccinated children who had a case of pertussis plus number of unvaccinated children who had a case of pertussis. ‡ PPV values were obtained from the Australian Childhood Immunisation Register; they were calculated by dividing numbers of fully vaccinated children in each birth cohort by total number of fully vaccinated and unvaccinated children in each birth cohort. § About one-quarter of this cohort was eligible for the 18-month booster. ¶ Principal diagnosis cases are those in which a pertussis code was listed in the principal diagnosis field. |
|||||||||||||||
Received 15 August 2013, accepted 5 February 2014
- Sarah L Sheridan1,2
- Bradley J McCall3
- Craig A Davis4
- Jennifer M B Robson5
- Brynley P Hull6
- Christine E Selvey7
- Robert S Ware1,2
- Keith Grimwood1
- Stephen B Lambert1,4
- 1 Queensland Children’s Medical Research Institute, University of Queensland, Brisbane, QLD.
- 2 School of Population Health, University of Queensland, Brisbane, QLD.
- 3 Metro South Public Health Unit, Brisbane, QLD.
- 4 Communicable Diseases Unit, Queensland Health, Brisbane, QLD.
- 5 Microbiology Department, Sullivan Nicolaides Pathology, Brisbane, QLD.
- 6 National Centre for Immunisation Research and Surveillance, Sydney, NSW.
- 7 Health Protection NSW, NSW Health, Sydney, NSW.
We thank Angela Wakefield and Nancy Tran, of the Communicable Diseases Unit, Queensland Health, and Jason Christiansen, of Metro South Public Health Unit, for their assistance in data extraction; and Karen Peterson and Vicki Bryant, of the Queensland Health Immunisation Program, for describing the vaccination program, schedule and register. Sarah Sheridan is supported by a National Health and Medical Research Council (NHMRC) postgraduate scholarship and a Children’s Health Foundation (CHF) clinical PhD scholarship. Stephen Lambert is supported by an NHMRC early career fellowship and a CHF People Support Fellowship, which helped support the study. Keith Grimwood receives funding from the NHMRC.
Keith Grimwood has served on the GlaxoSmithKline advisory board for pneumococcal conjugate vaccines.
- 1. Winter K, Harriman K, Zipprich J, et al. California pertussis epidemic, 2010. J Pediatr 2012; 161: 1091-1096.
- 2. Sheridan SL, Ware RS, Grimwood K, Lambert SB. Number and order of whole cell pertussis vaccines in infancy and disease protection. JAMA 2012; 308: 454-456.
- 3. Witt MA, Katz PH, Witt DJ. Unexpectedly limited durability of immunity following acellular pertussis vaccination in preadolescents in a North American outbreak. Clin Infect Dis 2012; 54: 1730-1735.
- 4. Klein NP, Bartlett J, Rowhani-Rahbar A, et al. Waning protection after fifth dose of acellular pertussis vaccine in children. N Engl J Med 2012; 367: 1012-1019.
- 5. Misegades LK, Winter K, Harriman K, et al. Association of childhood pertussis with receipt of 5 doses of pertussis vaccine by time since last vaccine dose, California, 2010. JAMA 2012; 308: 2126-2132.
- 6. Witt MA, Arias L, Katz PH, et al. Reduced risk of pertussis among persons ever vaccinated with whole cell pertussis vaccine compared to recipients of acellular pertussis vaccines in a large US cohort. Clin Infect Dis 2013; 56: 1248-1254.
- 7. Liko J, Robison SG, Cieslak PR. Priming with whole-cell versus acellular pertussis vaccine. N Engl J Med 2013; 368: 581-582.
- 8. Australian Technical Advisory Group on Immunisation. The Australian immunisation handbook. 10th ed. Canberra: Australian Government Department of Health, 2013. http://www.health.gov.au/internet/immunise/publishing.nsf/Content/Handbook10-home (accessed Jul 2013).
- 9. Pertussis vaccination: use of acellular pertussis vaccines among infants and young children. Recommendations of the Advisory Committee on Immunization Practices (ACIP). MMWR Recomm Rep 1997; 46: 1-25.
- 10. Tartof SY, Lewis M, Kenyon C, et al. Waning immunity to pertussis following 5 doses of DTaP. Pediatrics 2013; 131: e1047-e1052.
- 11. Vickers D, Mainar-Jaime RC, Pahwa P. Pertussis in rural populations of Saskatchewan (1995 to 2003): incidence, seasonality, and differences among cases. Can J Public Health 2006; 97: 459-464.
- 12. Gold M, Kempe A, Osbourn M. A comparison of serious adverse reactions to whole cell and acellular pertussis vaccines in South Australia. Med J Aust 1999; 171: 331-332.
- 13. Cherry JD. Epidemic pertussis in 2012-the resurgence of a vaccine-preventable disease. N Engl J Med 2012; 367: 785-787.
- 14. Communicable Diseases Network Australia. Australian national notifiable diseases case definitions: pertussis case definition. Australian Government Department of Health, 2004. http://www.health.gov.au/internet/main/publishing. nsf/Content/cda-surveil-nndss-casedefs-cd_pertus.htm (accessed Feb 2013).
- 15. Data Collections Unit, Queensland Health. 2009–2010 Queensland hospital admitted patient data collection (QHAPDC): manual of instructions and procedures for the reporting of QHAPDC data. Brisbane: Queensland Health, 2009. http://www.health.qld.gov.au/hic/manuals/09-10QHAPDC/MANUAL0910.pdf (accessed Feb 2013).
- 16. Farrington CP. Estimation of vaccine effectiveness using the screening method. Int J Epidemiol 1993; 22: 742-746.
- 17. Hull BP, Lawrence GL, MacIntyre CR, McIntyre PB. Estimating immunisation coverage: is the ‘third dose assumption’ still valid? Commun Dis Intell Q Rep 2003; 27: 357-361.
- 18. Torvaldsen S, Simpson JM, McIntyre PB. Effectiveness of pertussis vaccination in New South Wales, Australia, 1996–1998. Eur J Epidemiol 2003; 18: 63-69.
- 19. Hull BP, Deeks SL, McIntyre PB. The Australian Childhood Immunisation Register — a model for universal immunisation registers? Vaccine 2009; 27: 5054-5060.
- 20. Hull BP, Lawrence GL, MacIntyre C, McIntyre PB. Immunisation coverage in Australia corrected for under-reporting to the Australian Childhood Immunisation Register. Aust N Z J Public Health 2003; 27: 533-538.
- 21. Orenstein WA, Bernier RH, Dondero TJ, et al. Field evaluation of vaccine efficacy. Bull World Health Organ 1985; 63: 1055-1068.
- 22. Octavia S, Sintchenko V, Gilbert GL, et al. Newly emerging clones of Bordetella pertussis carrying prn2 and ptxP3 alleles implicated in Australian pertussis epidemic in 2008-2010. J Infect Dis 2012; 205: 1220-1224.
- 23. Kaczmarek MC, Valenti L, Kelly HA, et al. Sevenfold increase in likelihood of pertussis test requests in a stable set of Australian general practice encounters, 2000–2011. Med J Aust 2013; 198: 624-628. <MJA full text>
- 24. Cherry JD. Why do pertussis vaccines fail? Pediatrics 2012; 129: 968-970.
Abstract
Objectives: To assess the effectiveness of three, four and five doses of acellular pertussis vaccine against pertussis notification for children aged 1 – < 4 years and 5 – < 12 years, and the effectiveness of three doses of acellular pertussis vaccine against pertussis hospitalisation for children aged 1 – < 4 years.
Design, setting and participants: A population-based retrospective study of children aged 1 – < 12 years residing in Queensland, Australia, during 2009 and 2010. Routinely collected notification, hospitalisation, testing and vaccination data were used to describe notification rates and testing patterns and to assess vaccine effectiveness (VE) by the screening method.
Main outcome measures: VE against pertussis notification for children aged 1 – < 4 years and 5 – < 12 years, by birth year, and VE against pertussis hospitalisation for children aged 1 – < 4 years.
Results: 1961 notifications and 29 hospitalisations were included in the VE calculations. VE point estimates against pertussis notification and hospitalisation in children aged 1 – < 4 years were similar in 2009 and 2010, and ranged between 83.5% and 89.4%. VE point estimates against notification among children aged 5 – < 12 years were between 71.2% and 87.7% in 2009, and between 34.7% and 70.3% in 2010. The numbers of pertussis tests performed for children, particularly polymerase chain reaction (PCR) tests, increased between 2009 and 2010.
Conclusions: Acellular pertussis vaccine provided good protection within the first years of priming, but this waned as age increased. Changes in pertussis testing behaviour, because of increases in PCR use and awareness, may have contributed to increased pertussis notification rates and lower estimates of VE against notification owing to identification of milder disease.