


Pertussis, commonly known as whooping cough, is caused by the small, gram-negative coccobacillus Bordetella pertussis. Classic whooping cough illness is characterised by intense paroxysmal coughing followed by an inspiratory “whoop”, especially in young children or those without prior immunity, followed by a protracted cough.1,2 It is now more widely understood that these characteristic symptoms are not always present during B. pertussis infection, and that individuals may only have symptoms similar to those of the common cold or a non-specific upper respiratory tract infection.2
In recent years, rates of pertussis notifications have increased dramatically across Australia and in many other parts of the world.3-6 The rise has been seen in all Australian states and territories, with the highest notification rates in children aged under 15 years.7 Although increased notifications may be due to a true increase in circulating B. pertussis, it is possible that the magnitude of the increase has been amplified by better recognition of disease and more frequent testing.8
Historically, the diagnostic gold standard for pertussis laboratory testing was bacterial culture from nasopharyngeal secretions during the early phases of infection (Weeks 1 and 2), and serological testing was used as an alternative diagnostic method during later phases of infection.2 However, even with ideal specimen collection, transport and handling, culture has low sensitivity and does not provide timely results. Although serological testing is more sensitive, sensitivity and specificity may be lowered depending on the timing of specimen collection and the patient’s infection and vaccination history.9 Polymerase chain reaction (PCR) testing has emerged as a key diagnostic method, and respiratory specimens are now commonly tested for pertussis using PCR in Australia and other countries.2,4,10 PCR testing provides more sensitive and rapid results than culture and serological testing. Also, PCR allows less invasive specimen collection — especially useful in younger age groups, in whom infection rates are high and serum collection may be challenging.1
The key datasets used to monitor pertussis incidence and epidemiology in Australia — pertussis notifications, and pertussis-coded hospitalisations and deaths — are populated by positive test results from laboratories and, as such, are not independent of changes in testing practices. Without negative test results or other denominator data to assess changes in testing behaviour, it is difficult to distinguish changes in recorded disease incidence that are due to the effect of increased testing from any true increase in disease.
To better understand the role testing behaviour has on current pertussis epidemiology in Australia, we investigated pertussis testing trends in a stable set of general practice encounters. We hypothesised that the likelihood of pertussis testing, in a stable set of encounters that were most likely to result in a pertussis test request, has increased over time and that this may have led to amplification of laboratory-confirmed pertussis identification in Australia.
We analysed data from the Bettering the Evaluation and Care of Health (BEACH) program and the National Notifiable Diseases Surveillance System (NNDSS).
The BEACH program is a continuous cross-sectional national study that began collecting details of Australian general practice encounters in April 1998. Study methods for the BEACH program have been described elsewhere11 and are summarised in Appendix 1.
Initially, all encounters for which a pertussis test (ICPC-2 [International Classification of Primary Care, Version 2] PLUS code R33007 [ICPC-2 PLUS label: Test;pertussis]12) was ordered in the period April 2009 – March 2011 were identified and examined. During this period, 30 BEACH problems resulted in a pertussis test request at some time, and nine problems accounted for 90.9% of all pertussis test requests in the dataset. Four other problems, for which a pertussis test request was made at more than 1% of general practice management occasions of that problem, were added (Appendix 2). The 13 selected problems accounted for 92.3% of pertussis tests ordered between April 2009 and March 2011. These were labelled “pertussis-related problems” (PRPs) and data for these problems at encounters recorded between April 2000 and March 2011 were extracted.
BEACH data were grouped into two pre-epidemic periods (before the start of the national pertussis outbreak in 2008) and three epidemic years. During the pre-epidemic periods (April 2000 – March 2004 and April 2004 – March 2008), testing proportions were constant. For each pre-epidemic period and epidemic year, the proportion of PRPs with a pertussis test ordered and the proportion of BEACH problems that were PRPs were calculated. The proportions of PRPs with a pertussis test ordered were grouped into clinically meaningful age groups: 0–4 years, 5–9 years, 10–19 years, 20–39 years, 40–59 years, and ≥ 60 years.
The NNDSS collates notifications of confirmed and probable pertussis cases received in each state and territory of Australia under appropriate public health legislation.13 Notified cases meet a pertussis case definition, which requires: laboratory definitive evidence; or laboratory suggestive evidence and clinical evidence; or clinical evidence and epidemiological evidence (Appendix 3).
To match the BEACH years, all Australian pertussis notifications between April 2000 and March 2011 were extracted from the NNDSS database, including data on age and laboratory testing method. Pertussis notifications were aggregated by month and year, by age group, and by laboratory test method (serological, PCR, culture or unknown). Notifications that had more than one testing modality reported were classified into a single test category using the following hierarchy: culture, PCR, serological, unknown. A total of 1318 notifications were coded only as “antigen detection”, “histopathology”, “microscopy”, “not done” or “other” (epidemiologically linked cases); these were excluded from the analysis as they accounted for only 0.9% of notifications over the study period. The rates of pertussis notifications per 100 000 population were then calculated for each pre-epidemic period and epidemic year.
Temporal changes in the proportions of PRPs with a pertussis test ordered and the rates of pertussis notifications were assessed with a non-parametric test for trend over the whole study period and by calculating odds ratios with robust 95% confidence intervals. Correlation coefficients were calculated to determine the relationship between BEACH and NNDSS datasets. The BEACH analyses incorporated an adjustment for the cluster sample design. Initial BEACH analyses were performed using SAS version 9.1.3 (SAS Institute). Subsequent BEACH and NNDSS analyses were performed using Microsoft Excel and Stata version 11 (StataCorp).
During the study period, the BEACH program had ethics approval from the University of Sydney Human Research Ethics Committee and the Australian Institute of Health and Welfare Ethics Committee. This particular study was approved by the University of Queensland Medical Research Ethics Committee.
The PRPs captured an average of 90.7% of all BEACH problems with a pertussis test ordered each year (range, 87.7%–92.7%) between April 2000 and March 2011 (Box 1). During the study period, PRPs as a proportion of all BEACH problems remained stable, with an annual average of 8.0% (range, 7.7%–8.7%).
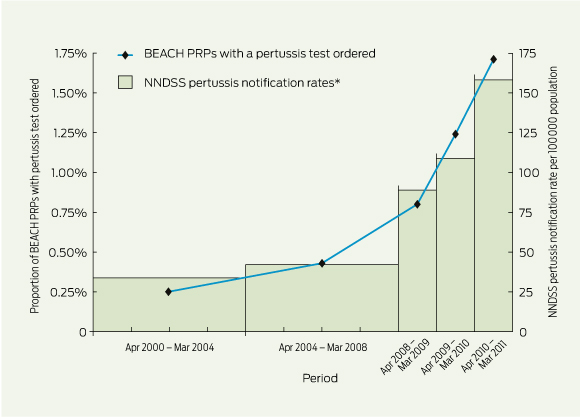
When the BEACH data were grouped into pre-epidemic periods and epidemic years, the proportion of PRPs with a pertussis test ordered increased about sevenfold — from 0.25% to 1.71% — when comparing April 2000 – March 2004 and April 2010 – March 2011(Box 2, Box 3). This increase was highly correlated with NNDSS pertussis notification rates (correlation coefficient [r], 0.99), which increased about fivefold during the same period (Box 3). A highly significant trend was detected for changes in BEACH pertussis test requests (P < 0.001) and NNDSS notification rates (P < 0.001) from April 2000 to March 2011.
In the age-specific analysis, there were significant increases in laboratory-confirmed pertussis notifications and in the likelihood of pertussis test requests across all age groups during the study period (Box 3). When comparing April 2000 – March 2004 and April 2010 – March 2011 pertussis testing rates, the largest increase was in 5–9-year-olds (odds ratio, 11.6; 95% CI, 4.2–36.7), followed by 0–4-year-olds, 40–59-year-olds and ≥ 60-year-olds. With the exception of 5–9-year-olds, the increase in pertussis testing exceeded notification changes in all age groups.
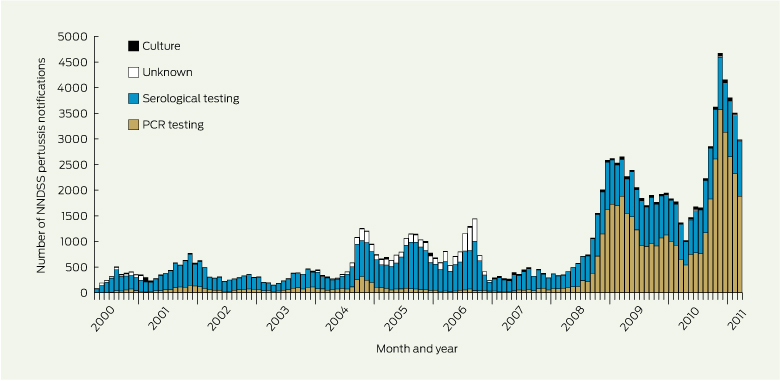
Numbers of NNDSS pertussis notifications fluctuated over the study period (Box 4). From 2008 onwards, there was a clear increase in the numbers of PCR-confirmed notifications. Before April 2008, most NNDSS notifications were confirmed by serological testing (66.0%–80.7% of all notifications annually). The proportion of notifications confirmed by PCR increased from 16.3% in April 2000 – March 2004 to 65.3% in April 2010 – March 2011 (Box 1). The proportion of notifications confirmed by culture did not change, and accounted for an average of 2.0% of all notifications over the study period.
Consistent with experience in other developed countries,4,14-16 we found that rates of pertussis notifications in Australia increased dramatically in recent years, from an average annual rate of 34 per 100 000 population between April 2000 and March 2004 to 158 per 100 000 population between April 2010 and March 2011. Our results cast some light on the potential role that the increasing likelihood of a pertussis test request may have on this change.
Using BEACH data, we found that individuals presenting to an Australian general practitioner between April 2010 and March 2011 were seven times more likely to have been tested for pertussis than 10 years earlier. This finding was within a set of general practice problems that remained stable as a proportion of all problems. This increased likelihood of pertussis testing, most evident in the epidemic years from April 2008 onwards, reached a maximum in the period April 2010 – March 2011, when pertussis tests were ordered in 1.71% of PRPs. A particular strength of our findings is that we used a data source that does not rely on laboratory testing, unlike most other datasets used to monitor pertussis in Australia and elsewhere.4,7,10,13
The increased likelihood of testing in general practice coincided with an increasing proportion of NNDSS pertussis notifications being confirmed by PCR, from 16.3% between April 2000 and March 2004 to 65.3% between April 2010 and March 2011. A review of pertussis cases in New South Wales during the period 2008–2009 also showed a shift away from serological testing (the predominant method before 2008) to PCR testing from 2008 onwards.10
Pertussis notification rates and the likelihood of testing varied considerably across age groups. There was a dramatic increase in notification rates in 0–4-year-olds and 5–9-year-olds from the 2004–2008 pre-epidemic period to the 2008–2009 epidemic year, compared with a moderate increase in testing, which indicates that there probably was a true increase in disease for these groups during this period. It is possible that a real increase in 0–4-year-olds and 5–9-year-olds early on prompted increased disease awareness among GPs, leading to widespread increases in testing across all ages. A positive feedback loop due to increased testing — leading to increased disease detection and awareness, leading to increased testing, and so on — may have been established. This interpretation is supported by the observation that although testing continued to increase from the epidemic year 2008–2009 to the epidemic year 2009–2010, there was little change in notifications, suggesting an increase in testing during that period rather than an increase in disease. In the other age groups, an increase in testing appeared to be responsible for magnified pertussis notifications. A study of pertussis resurgence in Toronto, Canada, also described this phenomenon and concluded that, although there had been true increase in local disease activity, the apparent size of the increase had been magnified by an increase in the use of pertussis testing and improvements in test sensitivity.4
In Australia, public funding for pathology laboratories to use PCR to test specimens for pertussis (and other pathogens) commenced under the Medicare Benefits Schedule (MBS) in November 2005.17 This specific reimbursement for PCR testing (MBS item 69494) — a Medicare fee of $28.65 compared with $22.00 for culture (MBS item 69303) and $15.65 for serological testing (MBS item 69384)17 — may have been an incentive for laboratories across Australia to implement PCR testing more routinely. In addition, during the 2009 H1N1 influenza pandemic, public funding was allocated for the purchase of laboratory equipment (notably PCR suites), but much of the funding was not received by laboratories until after the demand for pandemic influenza testing had subsided.18 New PCR capacity may have provided an increased opportunity for laboratories to conduct PCR testing for other pathogens, such as B. pertussis.
Several factors may have contributed to an increase in disease during the study period. Pertussis laboratory testing methods have been documented to vary between children and adults. While, historically, culture would have been preferred to serological tests for the very young,19 children now are more likely to be tested using PCR, and adults are predominantly tested using serological tests.10 The variation in testing and notification rates across age groups may be due to differences in susceptibility and immunity.20 Pertussis vaccination does not provide lifelong immunity against infection, with protection waning between booster doses.21 Waning immunity may partially explain differences in pertussis incidence between age groups, with older individuals having lower immunity due to longer periods since vaccination.20 Furthermore, there is evidence to suggest that whole-cell pertussis vaccine formulations used in Australia and overseas before the late 1990s were more protective against B. pertussis infection than currently used acellular pertussis vaccines,14,22-24 resulting in immunity levels waning faster in some age cohorts due to changes in vaccination schedules.25 In addition, a recent analysis of B. pertussis isolates collected in Australia between 2008 and 2010 indicates that there has been increasing circulation of vaccine-mismatched strains, hypothesised to be due to the selective pressure of vaccine-induced immunity.26
While these or other factors may have led to a true increase in disease during the study period, our data suggest that increased testing, most likely due to expanding use of PCR during the study period, has almost certainly amplified the magnitude of notified pertussis activity in Australia. This increase in testing might have led to identification of illness that would have otherwise gone undetected among age groups in which pertussis circulates widely or age groups in which pertussis had previously been largely left as a clinical diagnosis.
Our findings have global implications, particularly for countries with high or expanding PCR availability. They highlight the critical importance of analysing changes in infectious diseases using a range of surveillance systems. By monitoring changes in laboratory testing and using surveillance datasets that do not rely on laboratory test results, it is possible to determine whether increases in notifications for diseases such as pertussis are due to a true increase in disease, an increase in testing, or a combination of both.
1 PRPs as a proportion of all BEACH problems with a pertussis test ordered and as a proportion of all BEACH problems, and NNDSS PCR tests as a proportion of all NNDSS pertussis notifications, April 2000 to March 2011
Period (April – March) |
PRPs as a proportion of all BEACH problems with a pertussis test ordered (total no. of pertussis tests) |
PRPs as a proportion of all BEACH problems (total no. of PRPs) |
NNDSS PCR tests as a proportion of all NNDSS pertussis notifications (total no. of pertussis notifications) |
||||||||||||
2000–2004 |
89.4% (141) |
8.7% (51 396) |
16.3% (16 983) |
||||||||||||
2004–2008 |
92.1% (216) |
7.9% (45 872) |
11.3% (31 559) |
||||||||||||
2008–2009 |
87.7% (114) |
7.9% (12 551) |
55.4% (17 945) |
||||||||||||
2009–2010 |
92.7% (164) |
7.8% (12 228) |
55.8% (22 754) |
||||||||||||
2010–2011 |
91.7% (216) |
7.7% (11 557) |
65.3% (33 641) |
||||||||||||
PRP = pertussis-related problem. BEACH = Bettering the Evaluation and Care of Health. NNDSS = National Notifiable Diseases Surveillance System. PCR = polymerase chain reaction. |
|||||||||||||||
2 Proportions of BEACH PRPs with a pertussis test ordered, and NNDSS pertussis notification rates, April 2000 to March 2011
 | |||||||||||||||
|
BEACH = Bettering the Evaluation and Care of Health. PRP = pertussis-related problem. NNDSS = National Notifiable Diseases Surveillance System. * Data for 2000–2004 and 2004–2008 are averaged annual rates, and data for 2008–2009, 2009–2010 and 2010–2011 are annual rates. | |||||||||||||||
3 Proportions of BEACH PRPs with a pertussis test ordered, and NNDSS pertussis notification rates per 100 000 population, by age group, April 2000 to March 2011
|
|
Period (April – March) |
Odds ratio (95% CI)‡ |
Correlation coefficient (r)§ |
|||||||||||
|
|
Pre-epidemic period* |
Epidemic year† |
||||||||||||
Age group |
Dataset |
2000–2004 |
2004–2008 |
2008–2009 |
2009–2010 |
2010–2011 |
|||||||||
0–4 years |
BEACH |
0.16% |
0.12% |
0.48% |
0.89% |
1.31% |
8.0 (3.9–17.2) |
0.89 |
|||||||
NNDSS |
44.97 |
35.78 |
244.23 |
225.60 |
299.17 |
4.7 (4.3–5.2) |
|||||||||
5–9 years |
BEACH |
0.16% |
0.22% |
0.78% |
2.61% |
1.87% |
11.6 (4.2–36.7) |
0.75 |
|||||||
NNDSS |
29.68 |
17.55 |
202.17 |
260.06 |
507.62 |
14.2 (12.8–15.7) |
|||||||||
10–19 years |
BEACH |
0.36% |
0.36% |
1.27% |
1.95% |
2.05% |
5.7 (2.8–11.4) |
0.88 |
|||||||
NNDSS |
82.29 |
38.24 |
126.87 |
134.15 |
226.45 |
2.2 (2.1–2.3) |
|||||||||
20–39 years |
BEACH |
0.33% |
0.54% |
0.92% |
1.10% |
1.76% |
5.4 (3.5–8.5) |
0.98 |
|||||||
NNDSS |
22.58 |
34.51 |
64.41 |
84.42 |
105.60 |
2.8 (2.6–3.0) |
|||||||||
40–59 years |
BEACH |
0.25% |
0.65% |
1.05% |
1.50% |
2.09% |
8.5 (5.2–14.0) |
0.99 |
|||||||
NNDSS |
29.17 |
54.60 |
82.12 |
113.33 |
153.61 |
3.2 (3.0–3.4) |
|||||||||
≥ 60 years |
BEACH |
0.19% |
0.41% |
0.50% |
0.54% |
1.43% |
7.6 (4.3–13.7) |
0.90 |
|||||||
NNDSS |
16.12 |
50.15 |
76.57 |
103.49 |
142.84 |
5.6 (5.1–6.2) |
|||||||||
All ages |
BEACH |
0.25% |
0.43% |
0.80% |
1.24% |
1.71% |
7.0 (5.5–8.8) |
0.99 |
|||||||
NNDSS |
33.73 |
42.31 |
88.86 |
108.56 |
158.42 |
3.2 (3.2–3.3) |
|||||||||
BEACH = Bettering the Evaluation and Care of Health. PRP = pertussis-related problem. NNDSS = National Notifiable Diseases Surveillance System. * NNDSS data are average notifications per 100 000 population per year. † NNDSS data are notifications per 100 000 population per year. ‡ Comparison of 2000–2004 and 2010–2011 data. § Correlation between BEACH and NNDSS data. |
|||||||||||||||
4 NNDSS pertussis notifications by laboratory test method, April 2000 to March 2011
 | |||||||||||||||
|
NNDSS = National Notifiable Diseases Surveillance System. PCR = polymerase chain reaction. | |||||||||||||||
Received 10 January 2013, accepted 15 May 2013
- Marlena C Kaczmarek1,2,3
- Lisa Valenti4
- Heath A Kelly3
- Robert S Ware1,2
- Helena C Britt4
- Stephen B Lambert1
- 1 Queensland Children’s Medical Research Institute, Brisbane, QLD.
- 2 School of Population Health, University of Queensland, Brisbane, QLD.
- 3 Victorian Infectious Diseases Reference Laboratory, Melbourne, VIC.
- 4 Family Medicine Research Centre, School of Public Health, University of Sydney, Sydney, NSW.
We thank the Australian Government Department of Health and Ageing and the Family Medicine Research Centre, School of Public Health, University of Sydney, for providing data used in this study. Marlena Kaczmarek is the recipient of a Sidney Myer Health Scholarship. During the data period included in this study, the BEACH program was funded by: the Australian Government Department of Health and Ageing (1998–2004, 2007–2011); the National Prescribing Service (2005–2009); AstraZeneca (Australia) (1998–2011); Merck, Sharp and Dohme (Australia) (2002–2011); Pfizer Australia (2003–2011); Sanofi-Aventis Australia (2006–2011); Novartis Pharmaceuticals Australia (2009–2011); GlaxoSmithKline Australia (2010–2011); CSL Biotherapies (2010–2011); Bayer Australia (2010–2011); Janssen-Cilag (2000–2010); Abbott Australasia (2006–2010); Wyeth Australia (2008–2010); Roche Products (1998–2006); and Aventis Pharma (1998–2002).
Stephen Lambert has received honoraria for serving on the GlaxoSmithKline advisory boards for pneumococcal conjugate vaccine, serving as an investigator on clinical studies sponsored by GlaxoSmithKline and Sanofi-Pasteur (both manufacturers of pertussis-containing vaccines), and serving on GlaxoSmithKline and Sanofi-Pasteur advisory boards for pneumococcal and influenza vaccines, respectively.
- 1. Edwards K, Decker M. Pertussis vaccines. In: Plotkin S, Orenstein WA, Offit PA, editors. Vaccines. 5th ed. Philadelphia: Elsevier, 2008: 467-517.
- 2. Heininger U. Pertussis: what the pediatric infectious disease specialist should know. Pediatr Infect Dis J 2012; 31: 78-79.
- 3. Rohani P, Drake JM. The decline and resurgence of pertussis in the US. Epidemics 2011; 3: 183-188.
- 4. Fisman DN, Tang P, Hauck T, et al. Pertussis resurgence in Toronto, Canada: a population-based study including test-incidence feedback modeling. BMC Public Health 2011; 11: 694.
- 5. Crespo I, Cardeñosa N, Godoy P, et al. Epidemiology of pertussis in a country with high vaccination coverage. Vaccine 2011; 29: 4244-4248.
- 6. Reid S, Wilson E. New Zealand pertussis epidemiology and the Global Pertussis Initiative immunisation strategies. N Z Med J 2011; 124: 63-64.
- 7. NNDSS Annual Report Writing Group. Australia’s notifiable disease status, 2010: annual report of the National Notifiable Diseases Surveillance System. Commun Dis Intell Q Rep 2012; 36: 1-69.
- 8. Jenkinson D. Increase in pertussis may be due to increased recognition and diagnosis. BMJ 2012; 345: e5463.
- 9. Tozzi AE, Celentano LP, Ciofi degli Atti ML, Salmaso S. Diagnosis and management of pertussis. CMAJ 2005; 172: 509-515.
- 10. Spokes PJ, Quinn HE, McAnulty JM. Review of the 2008-2009 pertussis epidemic in NSW: notifications and hospitalisations. N S W Public Health Bull 2010; 21: 167-173.
- 11. Britt H, Miller G, Charles J, et al. General practice activity in Australia 2009–10. Canberra: Australian Institute of Health and Welfare, 2011. (AIHW Cat. No. GEP 27; General Practice Series No. 27.) http://www.aihw.gov.au/publication-detail/?id=6442472433 (accessed May 2013).
- 12. Wonca International Classification Committee. ICPC-2 — English: International Classification of Primary Care — 2nd Edition. Singapore: Wonca, 1998. http://www.kith.no/upload/2705/ICPC-2-English.pdf (accessed Dec 2008).
- 13. Australian Government Department of Health and Ageing. Australian national notifiable diseases case definitions. Pertussis case definition. http://www.health.gov.au/internet/main/publishing.nsf/Content/cda-surveil-nndss-casedefs-cd_pertus.htm (accessed May 2012).
- 14. Centers for Disease Control and Prevention. Pertussis epidemic — Washington, 2012. MMWR Morb Mortal Wkly Rep 2012; 61: 517-522.
- 15. Cherry JD. Epidemic pertussis in 2012 — the resurgence of a vaccine-preventable disease. N Engl J Med 2012; 367: 785-787.
- 16. Guiso N, Wirsing von König CH, Forsyth K, et al. The Global Pertussis Initiative: report from a round table meeting to discuss the epidemiology and detection of pertussis, Paris, France, 11-12 January 2010. Vaccine 2011; 29: 1115-1121.
- 17. Australian Government Department of Health and Ageing. MBS Online Medicare Benefits Schedule. http://www.health.gov.au/internet/mbsonline/publishing.nsf (accessed May 2013).
- 18. Australian Government Department of Health and Ageing. Review of Australia’s health sector response to pandemic (H1N1) 2009: lessons identified. Canberra: Commonwealth of Australia, 2011. http://www.flupandemic.gov.au/internet/panflu/publishing.nsf/Content/review-2011/$File/lessons%20identified-oct11.pdf (accessed May 2013).
- 19. Bonacruz-Kazzi G, McIntyre P, Hanlon M, Menzies R. Diagnostic testing and discharge coding for whooping cough in a children’s hospital. J Paediatr Child Health 2003; 39: 586-590.
- 20. Zepp F, Heininger U, Mertsola J, et al. Rationale for pertussis booster vaccination throughout life in Europe. Lancet Infect Dis 2011; 11: 557-570.
- 21. Tartof SY, Lewis M, Kenyon C, et al. Waning immunity to pertussis following 5 doses of DTaP. Pediatrics 2013; 131: e1047-e1052.
- 22. Sheridan SL, Ware RS, Grimwood K, Lambert SB. Number and order of whole cell pertussis vaccines in infancy and disease protection. JAMA 2012; 308: 454-456.
- 23. Witt MA, Katz PH, Witt DJ. Unexpectedly limited durability of immunity following acellular pertussis vaccination in preadolescents in a North American outbreak. Clin Infect Dis 2012; 54: 1730-1735.
- 24. Vickers D, Ross AG, Mainar-Jaime RC, et al. Whole-cell and acellular pertussis vaccination programs and rates of pertussis among infants and young children. CMAJ 2006; 175: 1213-1217.
- 25. Quinn HE, Mahajan D, Hueston L, et al. The seroepidemiology of pertussis in NSW: fluctuating immunity profiles related to changes in vaccination schedules. N S W Public Health Bull 2011; 22: 224-229.
- 26. Octavia S, Sintchenko V, Gilbert GL, et al. Newly emerging clones of Bordetella pertussis carrying prn2 and ptxP3 alleles implicated in Australian pertussis epidemic in 2008-2010. J Infect Dis 2012; 205: 1220-1224.
Abstract
Objective: To better understand the role that diagnostic test-ordering behaviour of general practitioners has on current pertussis epidemiology in Australia.
Design and setting: Analysis of Australian general practice encounter data (from the Bettering the Evaluation and Care of Health [BEACH] program) on 13 “pertussis-related problem” (PRP) codes that were most likely to result in a pertussis laboratory test request and Australian pertussis notifications data (from the National Notifiable Diseases Surveillance System [NNDSS]) for the period April 2000 to March 2011.
Main outcome measures: The change in the proportion of PRP general practice encounters with a pertussis test request between 2000 and 2011, and the change in national pertussis notifications over the same period.
Results: The proportion of PRP encounters resulting in a pertussis test request increased from 0.25% between April 2000 and March 2004 to 1.71% between April 2010 and March 2011 (odds ratio, 7.0; 95% CI, 5.5–8.8). The BEACH data on pertussis testing and NNDSS data on pertussis notifications were highly correlated (r = 0.99), and the notification data mirrored the likelihood of a pertussis test request in general practice. The proportion of NNDSS pertussis notifications with a polymerase chain reaction (PCR)-confirmed diagnosis increased from 16.3% between April 2000 and March 2004 to 65.3% between April 2010 and March 2011.
Conclusion: An increase in pertussis testing following recognition of early epidemic cases may have led to identification of previously undetected infections, resulting in a further increase in notified disease and awareness among GPs. The changing likelihood of being tested may also be due to expanding availability and use of PCR testing in Australia.