


Dietary improvement for Indigenous Australians is a priority strategy for reducing the health gap between Indigenous and non-Indigenous Australians.1 Poor-quality diet among the Indigenous population is a significant risk factor for three of the major causes of premature death — cardiovascular disease, cancer and type 2 diabetes.2 The 26% of Indigenous Australians living in remote areas experience 40% of the health gap of Indigenous Australians overall.3 Much of this burden of disease is due to extremely poor nutrition throughout life.4
Comprehensive dietary data for Indigenous Australians are not available from national nutrition surveys or any other source. Previous reports on purchased food in remote Aboriginal communities are either dated,5 limited to the primary store5,6 and/or short-term or cross-sectional in design.7,8 These studies have consistently reported low intake of fruit and vegetables, high intake of refined cereals and sugars, excessive sodium intake, and limited availability of several key micronutrients.
We examined purchased food in three remote communities in relation to:
Monthly electronic food (and non-alcoholic beverage) transaction data were provided by the community-owned store and independent stores in the three communities for July 2010 to June 2011. Food order data were collected from food suppliers for all food services in each of the three communities. All food and beverage items with their accompanying universal product code or store-derived product code, quantity sold, and dollar value (retail price) were imported to a purpose-designed Microsoft Access database9 and linked to the Food Standards Australia New Zealand Australian Food and Nutrient survey specific (AUSNUT 1999 and AUSNUT 200710) and reference (NUTTAB 06) databases (NUTTAB 06 has now been replaced by NUTTAB 2010). Folate dietary equivalent levels per 100 g were modified for bread and flour to equal NUTTAB 2010 levels since mandatory fortification was introduced. Unit weights were derived for all food and drink items and multiplied by the quantity sold to give a total item weight. Food items were categorised into food groups derived from the Australian Food and Nutrient Database AUSNUT 07 food grouping system10 and beverages were further categorised to provide a greater level of detail (Appendix 1). Several nutrient compositions for items not available in these databases were derived from the product’s nutrition information panel, which is mandatory on all packaged foods in Australia, or from standard recipes. Nutrient availability was derived for 21 nutrients. Energy and nutrient content per 100 g edible portion was multiplied by the edible weight (primarily sourced from Australian Food and Nutrient data10) of each of the food and beverage items (adjusted for specific gravity to convert mL to g weight) to derive total energy and nutrient content for each food group.
Data were grouped by community, food source, month and food group and transferred to Stata 10 (StataCorp) for analysis. Data for all food sources were combined (community food supply) and the average monthly and per capita daily weight and dollar value of each food group were calculated. Mean monthly and daily food weights were assumed to approximate mean monthly and daily dietary intakes for the data period.
The populations of each of the three remote communities and the three communities combined were estimated based on the total amount of energy provided through the community-level diet, and, assuming energy balance, were divided by the estimated weighted per capita energy requirement for each of the communities and the three communities combined. The estimated total population was verified against Australian Bureau of Statistics (ABS) estimates.11 The weighted per capita energy requirement was determined for each community using the estimated energy requirement for each age group and sex, as stated in the Nutrient Reference Values for Australia and New Zealand12 (with a physical activity factor of 1.6 [National Health and Medical Research Council — light activity13]) in conjunction with the population age and sex distribution as determined by the 2006 ABS population census for each of these three communities.
Nutrient density was calculated for each nutrient by dividing the total nutrient weight by the energy value of the community food supply. Population-weighted nutrient density requirements were derived using estimated average requirements (EARs).12 The EAR for nutrients is stated as a daily average and varies by age and sex. EARs are estimated to meet the requirements of half the healthy individuals of a particular age group and sex and are used to assess the prevalence of inadequate intakes at a population level.12 A nutrient density level below the weighted EAR per 1000 kJ was considered insufficient in meeting the population’s requirements.
Adequate intake (AI) values were used for nutrients for which no EAR was available (potassium, dietary fibre and vitamin E α-tocopherol equivalents). The midpoint of the AI range for sodium was used. Macronutrient profiles (the proportions of dietary energy from protein, total fat, saturated fat, carbohydrate and total sugar) were compared with acceptable macronutrient distribution ranges.14 Major food sources were defined as foods contributing 10% or more of a specific nutrient.
The estimated total population was 2644. Community populations ranged in estimated size from 163 to 2286 residents of mostly Aboriginal ethnicity and were comparable with regard to age and sex distributions.15 The distance from each community to the nearest food wholesaler ranged from 130 km to 520 km. Variation between the communities in remoteness, size, and number of food outlets is shown in Box 1.
Average per capita monthly spending on food and non-alcoholic beverages in communities A, B and C, respectively, was $394 (SD, $31), $418 (SD, $82) and $379 (SD, $80). About one-quarter of all money spent on food and beverages was on beverages (combined communities, 24.8%; SD, 1.4%), with soft drinks contributing 11.6%–16.1% to sales across the three communities (combined communities, 15.6%; SD 1.2%) (Appendix 2). This compares to less than 10% in total spent on fruit and vegetables in each of the three communities (7.3%, 9.1% and 8.9%; combined communities, 2.2% [SD, 0.2%] on fruit and 5.4% [SD, 0.4%] on vegetables) (Appendix 2).
Based on population estimates, there appeared to be differences in the daily per capita volume of many food groups between community A compared with communities B and C and less notable differences between communities B and C (Appendix 3).
On average, per capita daily intake of beverages (including purchased water and liquid tea) was 1464 g (SD, 130.5 g) with sugar-sweetened soft drinks comprising 298–497 g across communities (Appendix 3). Liquid tea constituted most of the remaining beverage volume. Daily per capita fruit and vegetable intake in community A (122 g) was just over half that of communities B (222 g) and C (247 g) (Appendix 3).
For community A, the proportion of dietary energy as carbohydrate was at the higher end of the recommended range; for communities B and C it was within the recommended range. Sugars contributed 25.7%–34.3% of the total proportion of dietary energy across the three communities (Box 2), 71% of which was table sugar and sugar-sweetened beverages. The proportion of dietary energy from fat was within the acceptable range for each community, and lower in community A compared with communities B and C. The proportion of dietary energy as saturated fat was within the recommended range for community A and higher than recommended for communities B and C. The proportion of dietary energy as protein was lower than the recommended minimum in all three communities (Box 2).
With reference to weighted EARs (or AIs) per 1000 kJ and nutrients measured, in all three communities the diet was insufficient in calcium, magnesium, potassium and fibre (Box 3). Iron, vitamin C and folate equivalents were all around double the weighted EAR per 1000 kJ and niacin equivalents were nearly four times the EAR (Box 3). Sodium was the nutrient provided in the greatest excess, at nearly six times the midpoint of the average intake range (Box 3). Most nutrient density values appeared lower in community A compared with communities B and C (Appendix 4).
In all three communities, white bread fortified with fibre and a range of micronutrients was a major source of protein, fibre, iron, sodium, calcium, dietary folate, potassium, magnesium and B-group vitamins (Appendix 5). Sugar and sugar-sweetened beverages provided 65%–72% of total sugars (Appendix 5). Bread, salt and baking powder were major sources of sodium in all three communities. Major food sources of all nutrients were similar across the three communities (Appendix 5).
Our comprehensive assessment of the community diet averaged over a 12-month period showed a high intake of refined cereals and added sugars, low levels of fruit, vegetables and protein, limiting key micronutrients, and excessive sodium intake. Our findings confirm recent and past reports of dietary quality in remote Aboriginal communities.5,8 We report food expenditure and dietary patterns that are similar to those reported previously using store sales data alone,5,6,8 as are the limiting nutrients (protein, potassium, magnesium, calcium and fibre).8
The level of sugar-sweetened soft drinks reported for communities B and C is in line with what we have previously reported for 10 NT communities from store data alone.6 The apparently substantially higher per capita volume reported for community A warrants further investigation, which could include examining variation in regional consumption, food delivery systems and food outlets. Similarly high per capita consumption of sugar-sweetened beverages has been reported among Aboriginal and Torres Strait Islander children in regional New South Wales (boys, 457 g/day; girls, 431 g/day) and for children at the national level (364.7 g/day).18,19 The high volume of tea purchased is also of concern, as tea is generally consumed as a sugar-sweetened beverage.
The low daily fruit and vegetable intake reported for the three study communities (which on average equated to 0.3 to 0.7 serves of fruit and 1.1 to 2.1 serves of vegetables) is in range with the reported average of 0.4 serves of fruit and 0.9 serves of vegetables per person per day sold through 10 NT community stores in 2009,6 but lower than intakes self-reported among other Aboriginal populations in remote Queensland and regional NSW.18,20,21 Our estimates do suggest improved intakes compared with the low levels of fruit and vegetable intake reported nearly three decades earlier for six remote NT communities.5 Caution needs to be applied in making comparisons with past studies owing to use of different methodologies. It has been estimated that increasing fruit and vegetable consumption to up to 600 g per day could reduce the global burden of ischaemic heart disease and stroke by 31% and 19%, respectively.22 The benefits for the Indigenous population are likely to be much greater, considering their currently low intake of fruit and vegetables and high burden of disease.
A further disturbing aspect of the diet is that fibre-modified and fortified white bread is providing a large proportion of key nutrients, including protein, folate, iron, calcium and magnesium, and unacceptably high levels of sodium. Similarly, among Aboriginal and Torres Strait Islander children in regional NSW, bread was also reported to be a major dietary source of energy, salt and fibre.18 It is alarming that white bread is providing a large percentage of dietary protein when it is a poor protein source. Considering the high-quality protein foods traditionally consumed by Aboriginal Australians,23 this apparent shift to a low-protein and high-carbohydrate diet needs investigation. Traditional foods, such as fish and other seafood, eggs and meat provide high-quality protein, but are unlikely to be significant at the population level if not accessed frequently and by a substantial proportion of the population.
The extremely high rates of preventable chronic disease experienced among Aboriginal people in remote Australia and the high intake of sugar-sweetened beverages, unacceptably low levels of fruit and vegetables, and limiting essential nutrients, provide a compelling rationale that more needs to be done to improve diet and nutrition. Poverty is a key driver of food choice24-26 and although most Indigenous people living in remote communities are in the low income bracket, a standard basket of food costs, on average, 45% more in remote NT communities than in the NT capital.27 People in the study communities spend more on food ($379 to $418 per person per month) compared with the expenditure estimated for other Australians ($314 per person per month with 2.6 persons per household).28 Our study provides the only available estimate of remote community food and drink expenditure that we know of. Household expenditure data are not available for very remote Australia, representing a gap in information on food affordability, a major determinant of health.
As with individual-level dietary assessment, there are limitations in estimating community-level dietary intake. An inherent issue in community-level per capita measures in research is the difficulty of determining the population for the study period, so caution is required in using the values presented here; however, the total population (2644) was verified against ABS predicted estimates for the 2011 Australian remote Indigenous population (2638) and was within 4% of the later released ABS census data collected in 2010 for the three study communities (2535). Further, monthly per capita dietary intake estimations were averaged over a 12-month period and are likely to take into account the fluctuations in population that occur in remote communities seasonally and over time. A strength of our study is that expenditure patterns based on proportional spending, macronutrient profile and nutrient density provide an assessment of dietary quality that are entirely independent of population size estimates. Furthermore, as dietary data are derived from food sales records rather than self-reported data, they provide an objective assessment of diet quality. Limitations in using food sales data as a measure of dietary intake have been reported previously.8 Estimated per capita energy intakes for communities A and B differed by less than 10% from per capita requirements derived from 2010 ABS census population figures, indicating completeness in food sale data. Estimated energy intakes for community C were lower than required but 81% of per capita requirements.
Reports on dietary quality are also limited by the accuracy of food composition databases. For example, the range of nutrients presented for each food in the Australian food composition database varies depending on the analytical data available. Nutrient levels reported in this study are based on currently available nutrient composition data.29
Despite these limitations, this study provides an objective, contemporary and comprehensive assessment of the community-level diet in three remote Indigenous communities without the inherent limitations of individual-level dietary intake assessment. It provides evidence on key areas of concern for dietary improvement in remote Aboriginal communities.
Very poor dietary quality has continued to be a characteristic of community nutrition profiles in remote Indigenous communities in Australia for at least three decades. Significant proportions of a number of key micronutrients are provided as fortification in a diet derived predominantly from otherwise poor-quality, highly processed foods. Ongoing monitoring (through use of food sales data) of community-level diet is needed to better inform community and wider level policy and strategy development and implementation. Low income is undoubtedly a key driver of diet quality. Further evidence regarding the impact of the cost of food on food purchasing in this context is urgently needed and the long-term cost benefit of dietary improvement needs to be considered.
2 Estimated energy availability and macronutrient profile, overall and by community
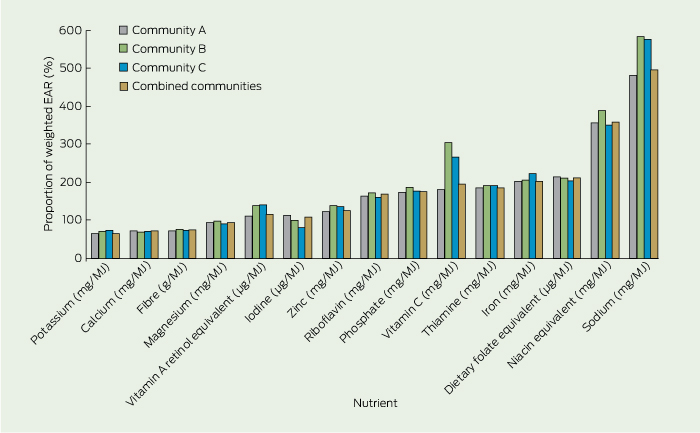
* Adequate intake values were used for nutrients for which no EAR was available (potassium, dietary fibre, vitamin E α-tocopherol equivalents, sodium).
Received 17 September 2012, accepted 4 March 2013
- Julie K Brimblecombe1,2
- Megan M Ferguson1,1,2
- Selma C Liberato1,2
- Kerin O’Dea3,4
- 1 Wellbeing and Preventable Chronic Disease, Menzies School of Health Research, Darwin, NT.
- 2 Institute of Advanced Studies, Charles Darwin University, Darwin, NT.
- 3 School of Population Health, Division of Health Sciences, University of South Australia, Adelaide, SA.
- 4 Menzies School of Health Research, Darwin, NT.
We acknowledge the contribution of Adam Barnes, Research Officer, Menzies School of Health Research, and Susannah Summons (Public Health Nutritionist/Dietitian) for assisting with data processing, and Robyn Liddle, Menzies School of Health Research, for expert advice on database design and application. We thank the participating communities, stores, and organisations for supporting the study.
The Cost of Dietary Improvement project was funded through the National Aboriginal and Torres Strait Islander Health Equity Council. Julie Brimblecombe was funded by a National Health and Medical Research Early Career Fellowship (545253).
No relevant disclosures.
- 1. Council of Australian Governments. National strategy for food security in remote Indigenous communities. 2009. http://www.coag.gov.au/sites/default/files/nat_strat_food_security.pdf (accessed Feb 2013).
- 2. Australian Bureau of Statistics. The health and welfare of Australia’s Aboriginal and Torres Strait Islander peoples, 2005. Canberra: Commonwealth of Australia, 2005. (ABS Cat. No. 4704.0.) http://www.abs.gov.au/AUSSTATS/abs@.nsf/DetailsPage/4704.02005?OpenDocument (accessed Mar 2013).
- 3. Vos T, Barker B, Begg S, et al. Burden of disease and injury in Aboriginal and Torres Strait Islander Peoples: the Indigenous health gap. Int J Epidemiol 2009; 38: 470-477.
- 4. National Health and Medical Research Council. Nutrition in Aboriginal and Torres Strait Islander peoples: an information paper. Canberra: Commonwealth of Australia, 2000. http://www.nhmrc.gov.au/_files_nhmrc/publications/attachments/n26.pdf (accessed Feb 2013).
- 5. Lee AJ, O’Dea K, Mathews JD. Apparent dietary intake in remote Aboriginal communities. Aust J Public Health 1994; 18: 190-197.
- 6. Brimblecombe JK, McDonnell J, Barnes A, et al. Impact of income management on store sales in the Northern Territory. Med J Aust 2010; 192: 549-554. <MJA full text>
- 7. Brimblecombe J, Mackerras D, Clifford P, O’Dea K. Does the store-turnover method still provide a useful guide to food intakes in Aboriginal communities? Aust N Z J Public Health 2006; 30: 444-447.
- 8. Brimblecombe J, Liddle R, O’Dea K. Use of point-of-sale data to assess food and nutrient quality in remote stores. Public Health Nutr 2012; 25 Sep. [Epub ahead of print.]
- 9. Brimblecombe J. Keeping track of healthy foods: towards improving the nutritional quality of foods sold in community stores in remote Australia. Darwin: Menzies School of Health Research, 2008.
- 10. Food Standards Australia New Zealand. Food composition program. AUSNUT 2007. Australian food, supplement and nutrient database 2007 for estimation of population nutrient intakes. Explanatory notes. http://www.foodstandards. gov.au/_srcfiles/AUSNUT%202007%20-%20Explanatory%20 Notes.pdf. (accessed Mar 2013).
- 11. Australian Bureau of Statistics. 2011 Census QuickStats. 2012. http://www.censusdata.abs.gov. au/census_services/getproduct/census/2011/quickstat/0 (accessed Feb 2013).
- 12. Australian Government Department of Health and Ageing, National Health and Medical Research Council; New Zealand Ministry of Health: Manatu Hauora. Nutrient reference values for Australia and New Zealand including recommended dietary intakes. Canberra: Commonwealth of Australia, 2006. http://www.nhmrc.gov.au/_files_nhmrc/publications/attachments/n35.pdf (accessed Feb 2013).
- 13. National Health and Medical Research Council and New Zealand Ministry of Health. Nutrient reference values for Australia and New Zealand. Dietary energy. http://www.nrv.gov.au/energy.htm (accessed Mar 2013).
- 14. National Health and Medical Research Council and New Zealand Ministry of Health. Nutrient reference values for Australia and New Zealand. Summary. Recommendations to reduce chronic disease risk. http://www.nrv.gov.au/disease/summary.htm (accessed Mar 2013).
- 15. Australian Bureau of Statistics. 2006 Census of population and housing. Census tables. Canberra: Commonwealth of Australia, 2007. (ABS Cat. No. 2068.0.)
- 16. Australian Bureau of Statistics. Births, Australia, 2006. Canberra: ABS, 2007. (ABS Cat. No. 3301.0.)
- 17. World Health Organization. Diet, nutrition and the prevention of chronic diseases. Geneva: WHO, 2003. http://whqlibdoc.who.int/trs/who_trs_916.pdf (accessed Feb 2013).
- 18. Gwynn JD, Flood VM, D’Este CA, et al. Poor food and nutrient intake among Indigenous and non-Indigenous rural Australian children. BMC Pediatr 2012; 12: 12.
- 19. Commonwealth Scientific Industrial Research Organisation Preventative Health National Research Flagship, University of South Australia. 2007 Australian National Children’s Nutrition and Physical Activity Survey. Main findings. Canberra: Commonwealth of Australia, 2008. http://www.health.gov.au/internet/main/publishing.nsf/content/66596E8FC68FD1A3CA2574D50027D B86/$File/childrens-nut-phys-survey.pdf (accessed Feb 2013).
- 20. McDermott R, Campbell S, Li M, McCulloch B. The health and nutrition of young indigenous women in north Queensland - intergenerational implications of poor food quality, obesity, diabetes, tobacco smoking and alcohol use. Public Health Nutr 2009; 12: 2143-2149.
- 21. Gwynn JD, Flood VM, D’Este CA, et al. The reliability and validity of a short FFQ among Australian Aboriginal and Torres Strait Islander and non-Indigenous rural children. Public Health Nutr 2011; 14: 388-401.
- 22. Lock K, Pomerleau J, Causer L, et al. The global burden of disease attributable to low consumption of fruit and vegetables: implications for the global strategy on diet. Bull World Health Organ 2005; 83: 100-108.
- 23. O’Dea K. Traditional diet and food preferences of Australian Aboriginal hunter-gatherers. Philos Trans R Soc Lond B Biol Sci 1991; 334: 233-240.
- 24. Drewnowski A, Darmon N. The economics of obesity: dietary energy density and energy cost. Am J Clin Nutr 2005; 82 (1 Suppl): 265S-273S.
- 25. Brimblecombe JK, O’Dea K. The role of energy cost in food choices for an Aboriginal population in northern Australia. Med J Aust 2009; 190: 549-551. <MJA full text>
- 26. Smith DE. Aboriginal expenditure patterns: an analysis of empirical data and its policy implications. Discussion paper no. 9/1991. Canberra: Centre for Aboriginal Economic Policy Research, 1991. http://caepr.anu.edu.au/sites/default/files/Publications/DP/1991_DP09.pdf (accessed Feb 2013).
- 27. Northern Territory Government. Northern Territory Market Basket Survey 2011. Darwin: Department of Health, 2011. http://digitallibrary.health.nt.gov.au/prodjspui/bitstream/10137/504/1/NT%20Market%20Basket%20%20report%202011.pdf (accessed Feb 2013).
- 28. Australian Bureau of Statistics. Household Expenditure Survey, Australia: detailed expenditure items, 2009-10. Table 3A. Gross income quintile, household expenditure on goods and services. 2011. http://www.abs.gov.au/AUSSTATS/abs@.nsf/DetailsPage/6530.02009-10?OpenDocument (accessed Feb 2013).
- 29. Food Standards Australia New Zealand. Explanatory notes for use with NUTTAB 2010. Canberra: FSANZ, 2011. http://www.foodstandards. gov.au/_srcfiles/Complete%20Explanatory %20Notes%20with%20Attachments.pdf (accessed Feb 2013).
Abstract
Objective: To describe the nutritional quality of community-level diets in remote northern Australian communities.
Design, setting and participants: A multisite 12-month assessment (July 2010 to June 2011) of community-level diet in three remote Aboriginal communities in the Northern Territory, linking data from food outlets and food services to the Australian Food and Nutrient Database.
Main outcome measures: Contribution of food groups to total food expenditure; macronutrient contribution to energy and nutrient density relative to requirements; and food sources of key nutrients.
Results: One-quarter (24.8%; SD, 1.4%) of total food expenditure was on non-alcoholic beverages; 15.6% (SD, 1.2%) was on sugar-sweetened drinks. 2.2% (SD, 0.2%) was spent on fruit and 5.4% (SD, 0.4%) on vegetables. Sugars contributed 25.7%–34.3% of dietary energy, 71% of which was table sugar and sugar-sweetened beverages. Dietary protein contributed 12.5%–14.1% of energy, lower than the recommended 15%–25% optimum. Furthermore, white bread was a major source of energy and most nutrients in all three communities.
Conclusion: Very poor dietary quality continues to be a characteristic of remote Aboriginal community nutrition profiles since the earliest studies almost three decades ago. Significant proportions of key nutrients are provided from poor-quality nutrient-fortified processed foods. Further evidence regarding the impact of the cost of food on food purchasing in this context is urgently needed and should include cost–benefit analysis of improved dietary intake on health outcomes.