


Demand for emergency health care is rising consistently across the developed world, with the number of presentations to emergency departments (EDs) increasing by 3% to 6% per year.1-4 ED performance is compromised by the resultant overcrowding,5 increased waiting times and ED length of stay (LOS),6 and ambulance diversion. Patient safety is threatened, as the risk of adverse events has been shown to be increased by overcrowding.7
Government agencies publish annual reports of ED performance that include presentation numbers,1,3,4 and problems associated with rising demand are well documented in the peer-reviewed literature and the media.8 However, there are few longitudinal analyses of routinely collected data. Therefore, we aimed to measure the volume and age-specific rates of ED presentations and ED LOS, and to investigate characteristics of ED utilisation across metropolitan Melbourne over the decade to 30 June 2009.
De-identified data from the Victorian Emergency Minimum Dataset (VEMD)9 were provided by the Victorian Department of Health. The VEMD contains demographic, administrative and clinical data recording patient-level presentations to Victorian public hospitals with 24-hour EDs. Data are collected by individual hospitals using standard definitions and protocols, to ensure interfacility comparability. Our analysis included data from metropolitan Melbourne EDs and excluded specialist maternity and eye and ear hospitals. We used Australian Bureau of Statistics annual population data10 to calculate presentation rates by age and sex.
Data were obtained for financial years 1999–00 to 2008–09. Demographic and clinical factors for all presentations were categorised according to age group, sex, referral source, type of transport to the ED, Australasian Triage Scale (ATS) category, clinical diagnosis, ED LOS and discharge destination (Box 1).
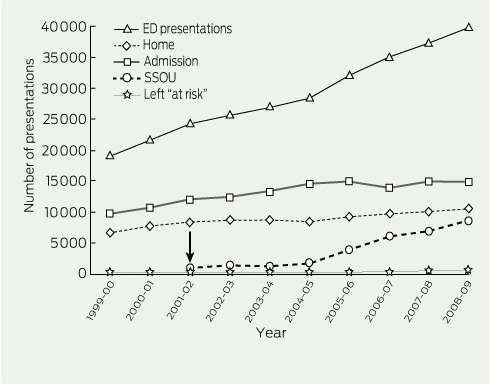
From 1999–00 to 2008–09, there were more than 7 million presentations to EDs in the Melbourne metropolitan area. The number of presentations rose from 550 662 in 1999–00 to 853 940 in 2008–09, a crude increase of 55% (Box 2). Population growth was 19% for this time period. The crude rate of ED presentation across all ages and sexes rose from 163 per 1000 person-years in 1999–00 to 212 per 1000 person-years in 2008–09.
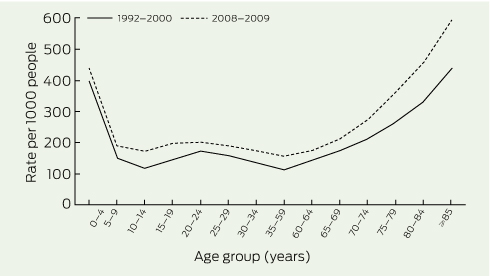
Age-specific numbers and rates of presentations also increased. Median age rose from 31 years in 1999–00 to 34 years in 2008–09. Increases in presentation rates for each age group were of similar magnitude; the highest absolute rates were for the youngest and oldest age groups, both in 1999–00 and 2008–09 (Box 3). Of the population ≥ 85 years in 2008–09, 60% presented for emergency care; a presentation rate of 594 per 1000 people, compared with 438 per 1000 in 1999–00. In 2008–09, this age group comprised 4.7% of all ED presentations, and represented 1.7% of the population.
After adjustment for population changes, log-linear regression showed a 32.2% (95% CI, 29.2%–35.2%) increase in presentation rates per 1000 person-years over the decade. This represents an average annual increase of 3.6% (95% CI, 3.4%–3.8%). Women were 14.2% less likely to present than men (95% CI, 13.1%–15.4%). The risk of presentation rose with increasing age. Patients aged ≥ 85 years were 3.9 times (95% CI, 3.8–4.0) as likely as those aged 35–59 years to attend a metropolitan ED in 2008–09 (Box 4).
The trends that have occurred in presentations to metropolitan Melbourne public hospital EDs over the decade are summarised in Box 2.
The number of self-referred presentations increased across all age groups by 68% (Box 2), with a 2.3-fold increase for patients aged ≥ 85 years.
Most presentations (73%) in 2008–09 were classified as “walk-ins”. Although 23% arrived by emergency ambulance, this represented an increase in absolute numbers of 60% (Box 2). The likelihood of arriving by ambulance rose with increasing age, with a twofold increase for patients aged ≥ 85 years.
Throughout the study period, over half the presentations were classified as ATS category 4 or 5 (Box 2), with 47% aged 20–59 years in 2008–09. However, the greatest absolute increase was among emergency and urgent patients (ATS category 2 or 3), who comprised 43% of all presentations in 2008–09. Forty-five per cent of all patients aged ≥ 85 years were classified into these more acute categories.
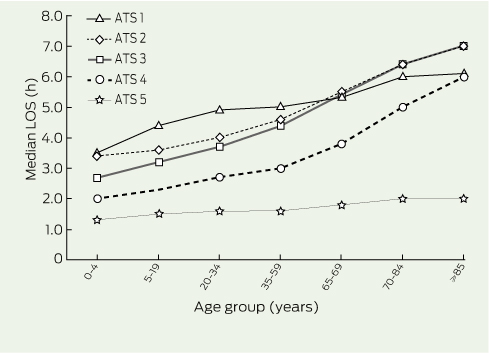
In 2008–09, most patients (61%) were discharged from the ED within 4 hours of arrival. Median LOS increased over the study period for more acutely unwell patients (ATS category 1, 2 or 3) and decreased for patients who were classified as less urgent (ATS category 4 and 5) (Box 5). Median LOS rose with increasing age within each ATS category (Box 6). Of patients aged ≥ 85 years, 75% had an LOS of ≥ 4 hours in 2008–09. Fixed effects modelling (Box 7) indicated that an LOS of ≥ 4 hours was associated with increasing age, being female, emergency ambulance arrival, being classified as ATS category 2 or 3, and admission.
Total hours of ED LOS increased for admitted patients by 79% (Box 2). In comparison, ED bed-days occupied for discharged patients rose by 43%.
Sixty-two per cent of patients were discharged directly home in 2008–09. The volume of patients admitted, including to a short-stay observation unit, rose by 79% over the decade (Box 2), the rate increasing from 36 per 1000 person-years in 1999–00 to 55 per 1000 person-years in 2008–09. The likelihood of admission was greater with increasing age. In 2008–09, 61% of all patients aged ≥ 85 years were admitted — 22% were transferred to a short-stay observation unit and 39% to other wards (Box 8). In comparison, 21% of patients aged 20–59 years were admitted and 67% discharged, excluding those who left “at risk” (without being seen or before clinical approval) in 2008–09.
The proportion of patients leaving the ED at risk increased by 84% overall, representing 7% of all presentations in 2008–09 (Box 2). The largest proportion of patients who left at risk belonged to the 20–34 years age group, which showed a threefold increase over the study period.
The trends observed represent an average annual growth rate of 3.6% above that explained by population change. The 55% increase in the volume of ED patients surpasses the United Kingdom’s 34% rise.1 However, the presentation rate shown for Melbourne, at 212 per 1000 people in 2008–09, is lower than the UK rate of 305 per 1000 people.
Our finding that the per capita increase was highest among people ≥ 85 years concurs with other studies.11-13 Our results here are also consistent with our recent study that demonstrated increasing and accelerating demand by older people for emergency ambulances.14 Older patients had longer LOS and were more likely to be admitted than middle-aged patients. Given projected trends in population ageing, the trends shown in our study are likely to have a dramatic impact on all aspects of emergency and hospital care. An ED visit for an older person is a sentinel health event that can lead to substantial functional decline and other adverse outcomes.15
The increase in patients who left at risk was notable. Most of these were aged 20–34 years, more likely to be ATS category 4 or 5 with an LOS of < 4 hours (data not shown), which implies lower urgency. The 6.6% in our study is higher than the 3.4% leaving at risk in the UK.16 Patients most often leave due to protracted waiting times.17 UK figures may be lower because of previously mandated 4-hour targets.
ED attendance by lower acuity patients could be related to changes in primary care service delivery. An association has been reported between ED utilisation and reduced general practitioner accessibility and increasing GP copayments.18 Furthermore, EDs may appeal to people of working age, with the convenience of 24-hour, hospital-based, specialised multidisciplinary health care with no copayments.19
Over the study period, ED LOS increased for more urgent and admitted patients, suggesting much of the ED burden is associated with admitted patients. This could be related to overcrowding and increased waiting times from rising demand and access block.20 The contribution of overcrowding to adverse outcomes is well documented.7,20 Longer LOS is also associated with greater risk of short-term mortality and adverse events in patients requiring admission.21 Increases in ED LOS have implications for the implementation of the 4-hour National Emergency Access Target.22 This Australian health reform initiative, designed to address ED waiting times, currently proposes 90% of patients be admitted, referred elsewhere or discharged within 4 hours.22,23 The increase in LOS suggests this target may not be achievable in the current system of care and context of persisting growth in demand, particularly by older patients. Introduction of this target must be accompanied by strategies to ensure patient safety is not compromised.23
Governments and service providers have progressively responded to demand for emergency health care with varied initiatives. The Victorian Hospital Demand Management Strategy, launched in 2001, targeted funding for EDs and new hospital-based models of care, including fast-track triage, care-coordination teams, short-stay observation units and medical planning units.24 Ambulance services have also introduced strategies intended to divert need for transportation. With population ageing, demand for both ambulance and hospital services will continue to rise.
The strength of this population-based study is that it analysed 10 years of data including > 7 million ED presentations. This study was based on routinely collected metropolitan data; hence the findings may not be generalisable to non-urban regions. Data quality and consistency are reliant on clinicians and clerical staff who work in an environment fraught with multiple distractions.25 We have attempted to identify factors underpinning the increase in demand; however, routinely collected data may not identify all the elements.
1 Factors and VEMD categories used in the analysis
2 Trends in absolute numbers of presentations to public hospital EDs* from 1999–2000 to 2008–2009, Melbourne, Victoria
3 Presentation rates per 1000 people, by age group, to public hospital EDs in Melbourne, 1999–00 to 2008–09*
4 Adjusted log-linear model looking at effects of age on public hospital ED presentations in Melbourne, 1999–00 to 2008–09*
5 Trends in the proportion of all patients with an ED LOS < 4 h, by triage category, Melbourne public hospitals,* 1999–2000 to 2008–2009†
7 Multivariate model* of factors associated with an ED LOS ≥ 4 hours, Melbourne public hospitals† 1999–2000 to 2008–2009
Received 26 July 2011, accepted 20 November 2011
- Judy A Lowthian1
- Andrea J Curtis2
- Damien J Jolley3
- Johannes U Stoelwinder4
- John J McNeil5
- Peter A Cameron6
- Department of Epidemiology and Preventive Medicine, Monash University, Melbourne, VIC.
We thank Vijaya Sundararajan and Lalitha Sundaresan from the Department of Health, Victoria for extracting the data; and Mark Gill from the Department of Health, Victoria for reviewing the manuscript.
No relevant disclosures.
- 1. Department of Health (UK). Accident and emergency attendances (data for 1987–88 to 2009–10). http://www.dh.gov.uk/en/Publicationsandstatistics/Statistics/Performancedataandstatistics/Accident andEmergency/DH_077485 (accessed Dec 2011).
- 2. Drummond AJ. No room at the inn: overcrowding in Ontario’s emergency departments. CJEM 2002; 4: 91-97.
- 3. Pitts SR, Niska RW, Xu J, Burt CW. National Hospital Ambulatory Medical Care Survey: 2006 emergency department summary. National health statistics reports no. 7. Hyattsville, Md: National Center for Health Statistics, 2008.
- 4. Australian Institute of Health and Welfare. Australian hospital statistics 2009–10: emergency department care and elective surgery waiting times. Canberra: AIHW, 2010. (AIHW Cat. No. HSE 93; Health Services Series No. 38.)
- 5. Forero R, Hillman KM, McCarthy S, et al. Access block and ED overcrowding. Emerg Med Australas 2010; 22: 119-135.
- 6. Derlet RW. Overcrowding in emergency departments: increased demand and decreased capacity. Ann Emerg Med 2002; 39: 430-432.
- 7. Bernstein SL, Aronsky D, Duseja R, et al. The effect of emergency department crowding on clinically oriented outcomes. Acad Emerg Med 2009; 16: 1-10.
- 8. Medew J. Thousands left to wait in parked ambulances: hospital delays hit seriously ill. The Age 2009; 22 May.
- 9. Victorian Government Health Information. Victorian hospital data reports. Reference files. Victorian Emergency Minimum Dataset — VEMD. http://www.health.vic.gov.au/archive/archive 2011/hosdata/datafields.htm (accessed Dec 2011.)
- 10. Australian Bureau of Statistics. Population estimates by age and sex, regions of Australia. Victoria by geographical classification 2000–2009. Canberra: ABS. (ABS Cat. No. 3235.0.)
- 11. George G, Jell C, Todd BS. Effect of population ageing on emergency department speed and efficiency: a historical perspective from a district general hospital in the UK. Emerg Med J 2006; 23: 379-383.
- 12. Xu KT, Nelson BK, Berk S. The changing profile of patients who used emergency department services in the United States: 1996 to 2005. Ann Emerg Med 2009; 54: 805-810.
- 13. Hider P, Helliwell PE, Ardagh M, Kirk R. The epidemiology of emergency department attendances in Christchurch. N Z Med J 2001; 114: 157-159.
- 14. Lowthian JA, Jolley D, Curtis AJ, et al. The challenges of population ageing: accelerating demand for emergency ambulance services by older patients, 1995 to 2015. Med J Aust 2011; 194: 574-578. <MJA full text>
- 15. McCusker J, Verdon J, Tousignant P, et al. Rapid emergency department intervention for older people reduces risk of functional decline: results of a multicenter randomized trial. J Am Geriatr Soc 2001; 49: 1272-1281.
- 16. NHS Information Centre. Latest statistics on time spent in A&E published by NHS Information Centre. London: Health and Social Care Information Centre, 2011. http://www.ic.nhs.uk/news-and-events/news/latest-statistics-on-time-spent-in-aande-published-by-nhs-information-centre (accessed Jul 2011).
- 17. Brand C, Kennedy M, MacBean C, et al. Patients who “leave without being seen” (LWBS) from an emergency department. Melbourne: Department of Human Services Victoria, 2005.
- 18. McGaw AJ, Jayasuriya P, Bulsara C, Thompson SC. Accessing primary health care: a community survey of issues regarding general practice and emergency department services in an outer metropolitan area. Aust J Primary Health 2006; 12: 78-84.
- 19. Abernethie L, Nagree Y. Increased emergency department attendance: a qualitative investigation of health seeking behaviours. Just Policy 2004; 33: 6-16.
- 20. Richardson DB, Mountain D. Myths versus facts in emergency department overcrowding and hospital access block. Med J Aust 2009; 190: 369-374. <MJA full text>
- 21. Richardson DB. Increase in patient mortality at 10 days associated with emergency department overcrowding. Med J Aust 2006; 184: 213-216. <MJA full text>
- 22. Council of Australian Governments. National Health Reform Agreement — National Partnership Agreement on Improving Public Hospital Services. 2011. http://www.coag.gov.au/ (accessed Jan 2012).
- 23. Baggoley C, Owler B, Grigg M, et al. Expert panel review of elective surgery and emergency access targets under the National Partnership Agreement on Improving Public Hospital Services. Report to the Council of Australian Governments 30 June 2011. Canberra: Commonwealth of Australia, 2011.
- 24. Victorian Government Department of Human Services. Better faster emergency care: improving emergency care in Victoria’s public hospitals. Melbourne: DHS, 2007.
- 25. Caley M. Accident and emergency activity in the West Midlands. West Midlands key health data 2007–08. Birmingham: University of Birmingham, 2009.
Abstract
Objectives: To measure the increase in volume and age-specific rates of presentations to public hospital emergency departments (EDs), as well as any changes in ED length of stay (LOS); and to describe trends in ED utilisation.
Design, patients and setting: Population-based retrospective analysis of Department of Health public hospital ED data for metropolitan Melbourne for 1999–00 to 2008–09.
Main outcome measures: Presentation numbers; presentation rates per 1000 person-years; ED LOS.
Results: ED presentations increased from 550 662 in 1999–00 to 853 940 in 2008–09. This corresponded to a 32% rise in rate of presentation (95% CI, 29%–35%), an average annual increase of 3.6% (95% CI, 3.4%–3.8%) after adjustment for population changes. Almost 40% of all patients remained in the ED for ≥ 4 hours in 2008–09, with LOS increasing over time for patients who were more acutely unwell. The likelihood of presentation rose with increasing age, with people aged ≥ 85 years being 3.9 times as likely to present as those aged 35–59 years (95% CI, 3.8–4.0). The volume of older people presenting more than doubled over the decade. They were more likely to arrive by emergency ambulance and were more acutely unwell than 35–59 year olds, with 75% having an LOS ≥ 4 hours and 61% requiring admission in 2008–09.
Conclusion: The rise in presentation numbers and presentation rates per 1000 person-years over 10 years was beyond that expected from demographic changes. Current models of emergency and primary care are failing to meet community needs at times of acute illness. Given these trends, the proposed 4-hour targets in 2012 may be unachievable unless there is significant redesign of the whole system.