


Quality and safety concerns have prompted calls for institutions to monitor condition-specific patient outcomes with methods that permit early, real-time identification of unfavourable trends.1 Statistical process-control methods can quickly identify excess numbers of infrequent events, such as death, by comparing observed outcomes with those expected on the basis of risk-prediction models.
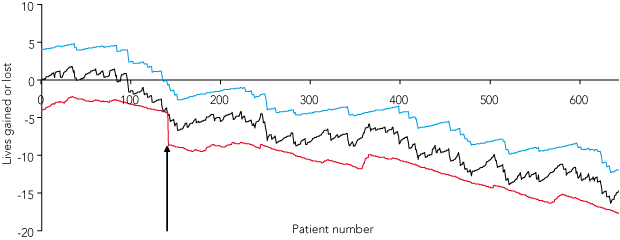
Simple graphical displays include the risk-adjusted cumulative sum2,3 and the variable life-adjusted display (VLAD).4,5 Had these tools been in routine use at the time, the Bristol cardiac surgery deaths and the Shipman murders would have been identified as statistical outliers long before proof was forthcoming from conventional comparative statistics.6 Beginning in July 2006, Queensland Health has adopted regular internal reporting of VLAD analyses of mortality, long stays, readmission rates and complications for 17 different diagnoses and procedures involving 87 public and private hospitals in the state.7
Statistical process-control analyses and their inherent condition-specific risk-prediction models can be of two types: (1) based on routinely collected administrative data, such as principal diagnoses and comorbid conditions listed in coded hospital discharge data (administrative method, used by Queensland Health); or (2) based on abstracted clinical datasets of prognostically important patient and process-of-care variables recorded at or after presentation of a patient to hospital (clinical method). Previous comparisons of administrative and clinical databases have found that administrative data were frequently incomplete or miscoded, and analyses were unable to fully adjust for confounders related to administrative data.8 However, more recent studies of elective surgical admissions suggest that administrative data compare favourably with clinical databases.9,10 Whether this remains true for acute medical diagnoses is uncertain. Also unclear is the effect on predictive accuracy of the inappropriate inclusion of misdiagnosed cases or patients whose risk of death bears little or no relation to quality of care.
The model based on administrative data was derived from multivariate logistic regression analysis of data from 7491 patients admitted to 31 Queensland hospitals (four tertiary, 27 other) between 1 July 2003 and 30 June 2006 with a coded discharge diagnosis of AMI. The model comprised 11 independent risk predictors (Box 1) and demonstrated good discrimination (C statistic11 = 0.80) (Justin Collins, Program Director, Quality Management Statistical Unit, Queensland Health, personal communication, 2007). A very similar model, derived from data from Ontario between 1994 and 1997 (C for 30-day mortality = 0.78), had been validated in 117 070 patients (C = 0.77).12
The model using clinical data was a logistic regression model based on eight clinical variables (Box 2) derived from a large international registry of 11 389 patients with clinician-verified diagnoses of acute coronary events, including AMI. Studies showed very good discrimination within two cohorts totalling 16 114 patients (C = 0.83 and C = 0.79–0.84 in derivation and validation cohorts, respectively).14 As most patients in the registry survived to 24 hours after admission and had not presented with out-of-hospital cardiac arrest, we arbitrarily assigned the model’s highest possible risk of death (52%) to patients presenting with such arrests and those who died within 30 minutes of ED presentation or lacked data on one or more variables.
The clinical diagnosis of AMI was confirmed in all cases by using internationally accepted criteria of an elevated troponin level and the presence of ischaemic chest pain or unequivocal electrocardiographic changes.15
The graphical tool used in this study was an adaptation of the VLAD, which incorporated control limits derived from the risk-adjusted cumulative sum.16,17 Briefly, the VLAD shows a plot, for a series of consecutive patients over time, of the cumulative risk-adjusted difference between observed and expected deaths, expressed as the statiscal estimate of excess lives gained or lost. Upper and lower control limits (based mathematically on the sequential probability ratio test2 applied to 10 000 iterations of specified datasets of 10 000 patients) were added which, when breached by the curve, corresponded, respectively, to a real 30% decrease or increase in mortality with 95% confidence. Each time the control limit was breached, the limits were reset, with the breach point taken as the new baseline. More in-depth explanations of the mathematics involved can be found elsewhere.4,5,17
Associations between patient variables and mortality were identified by using χ2 methods and were expressed as odds ratios (ORs) with 95% confidence intervals. Independent predictors were determined by multivariate logistic regression models. Two VLAD curves plotted from the administrative and clinical models were compared, and the models were assessed for their discriminatory power (C statistic11) and goodness of fit (Hosmer–Lemeshow χ2 test, a measure of calibration),18 as applied to the study sample. The curve was also replotted by using an altered administrative risk-prediction model whose reference population included only patients admitted to tertiary hospitals.
Of the 467 patients included in the original administrative dataset (Box 3), most were male, and the mean age was 65 years. Of these patients, 416 (89%) were acute admissions to the ED from the community, and 447 (96%) had a confirmed diagnosis of AMI. Of 67 patients who died in hospital, nine represented either misdiagnosis (two with alternative diagnoses of septic shock and pulmonary thromboembolism) or unsubstantiated diagnoses (seven with AMI listed as an unconfirmed cause of death on the death certificate), 14 had out-of-hospital, out-of-ambulance cardiac arrests in which circulation was lost for at least 15 minutes, and 23 were deemed as receiving care with palliative or conservative intent. Of 400 survivors, 11 cases were misdiagnosed cases of unstable angina.
Variables associated with a significantly increased risk of death on univariate analysis were out-of-hospital arrest, misclassification, palliative or conservative care intent and care received from non-cardiology teams, while being male was associated with less risk (Box 3). After multivariate regression analysis, misclassification (OR = 4.52; 95% CI, 1.49–13.68; P = 0.008), transfers from other hospitals (OR = 3.20; 95% CI, 1.30–0.92; P = 0.01) and care from a non-cardiology team (OR = 3.56; 95% CI, 1.50–8.44; P = 0.004) remained significant as independent associations.
The original VLAD for the study hospital based on the administrative risk-prediction model (Box 4) showed a steadily increasing excess mortality over the 33-month study period, culminating in an estimated 11 excess deaths, with 30% excess mortality signalled with 95% confidence at Patient 134. A replotted administrative curve using tertiary hospital patients only as the reference population (not shown) showed a nearly identical pattern, with signalling of excess mortality delayed marginally to Patient 139.
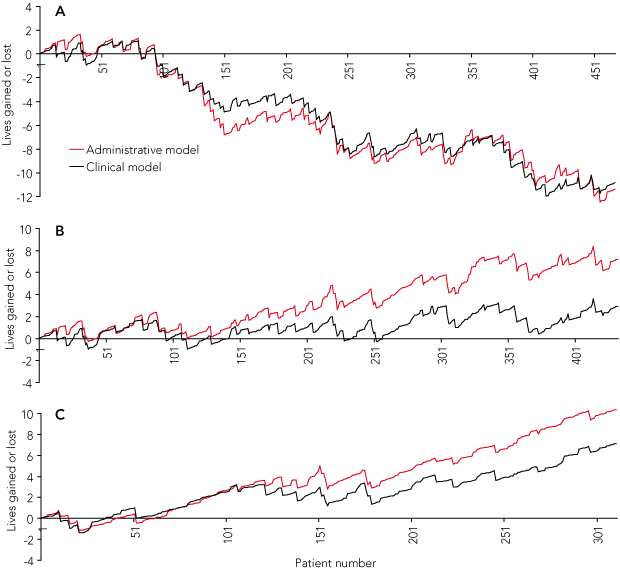
Applying the clinical prediction model to the original VLAD also produced a nearly identical curve (Box 5 [A]), with significant correlation between models in risk estimates for individual patients (r = 0.46, P < 0.001) and similar ranges for risk estimates: administrative 1.6% to 63.9%, clinical 0.2% to 52.0%.
Replotting of data from both models, after exclusion of misclassified cases, out-of-hospital, out-of-ambulance cardiac arrests and deaths in ED within 30 minutes of presentation (n = 37), yielded two upwardly directed curves (Box 5 [B]) which, depending on the model, represented a net gain of three or seven lives at the end of the study period, with no breaching of control limits (not shown). This upward pattern persisted as previously defined patient groups were sequentially excluded (data not shown), with the final plot after deselection of 156 patients showing a net gain of seven or 10 lives (Box 5 [C]).
The results of this study indicate that appropriate patient selection is more important than the choice of dataset or risk-prediction model when employing statistical process-control methods to detect excess (and potentially avoidable) in-hospital deaths in patients admitted with AMI. In particular, patients with a misdiagnosis or those in whom diagnosis of AMI cannot be substantiated, those presenting with prolonged out-of-hospital cardiac arrest, and those dying very soon after admission need to be removed from the cohort of evaluable cases, as their outcomes bear no relation to the quality of in-hospital care. The inclusion of patients deemed to be receiving care with palliative or conservative intent or requiring high-level nursing care should also be viewed cautiously,19 although we are by no means implying that a therapeutically nihilistic approach be adopted in all such cases.
The first limitation of our study relates to incomplete ascertainment of all cases of AMI in the original administrative dataset, because of misdiagnosis by clinicians or error by coders. During the study period, the hospital pathology laboratory reported 2970 instances of elevated troponin I, a sensitive biomarker for AMI, but only 447 correctly coded cases of AMI. While a detailed audit has not been done, we suspect that at least half of these “positive” troponin assays represent non-AMI elevations (≤ 0.1 ng/mL),20 and another third comprise serial assays performed on the same patient. This reduces the number of cases with probable AMI to 990, corresponding to a sampling fraction in our study of 45%, which we contend constitutes a representative sample.
Second, unlike some investigators,21 we excluded patients transferred in from other hospitals, because performance within a single tertiary hospital was being assessed, not the performance of a regional health care system in which timely interhospital transfer of patients requiring tertiary care is a quality indicator. Moreover, initial management of transferred patients at the referring hospital, which may increase mortality risk, is not within the control of the study hospital.
VLAD analyses have the ability to detect runs of favourable or adverse outcomes and provide timely, regular updates as “real-time” reporting. Such analyses are feasible on a large scale and at low cost when they use readily available administrative data routinely collected from all hospitals.22 However, the accuracy of such data has been questioned because of variations in the results of same-condition mortality analyses that use different administrative datasets23 and between those using administrative versus clinical data.24,25
In response, Queensland Health has adopted a multitiered flagging mechanism which begins with clinicians first examining the validity of the administrative data and risk-adjustment models used for specific indicators.7 The accuracy of risk adjustment of administrative data may also be improved by adding a small number of readily available laboratory results26,27 or clinical variables28 to administrative datasets.
This study suggests that a-priori determination of appropriate patient selection criteria may be an even more important consideration than risk adjustment in preventing VLAD analyses unfairly labelling individual institutions as being poor performers. Coding practices in regard to admission status, diagnosis or complication, and verifiable cause of death need to be reviewed and standardised with input from clinicians. Audit-based coding error rates of 17% for principal discharge diagnoses and missing-diagnosis rates of 27% across Queensland hospitals (KPMG Consulting. Casemix coding audit and process review, 2002) need to be corrected if VLAD analyses are to adequately account for differences in risk between hospitals29 and be acceptable to clinicians.30 Mandated use of clinician-verified primary data contained within regularly audited structured discharge summaries may be one possible solution.
3 Patient characteristics and statistically significant mortality associations (all P < 0.001) of 467 patients with coded discharge diagnosis of acute myocardial infarction
Received 1 August 2007, accepted 19 November 2007
- Ian A Scott1
- Peter L Thomson2
- Seshasayee Narasimhan1
- 1 Department of Internal Medicine and Clinical Epidemiology, Princess Alexandra Hospital, Brisbane, QLD.
- 2 Health Information Management Services, Princess Alexandra Hospital, Brisbane, QLD.
The authors thank Mohsina Khatun and Professor Anthony Morton for statistical advice.
None identified.
- 1. McKay NL, Deily ME. Comparing high- and low-performing hospitals using risk-adjusted excess mortality and cost inefficiency. Health Care Manage Rev 2005; 30: 347-360.
- 2. Grigg OA, Farewell VT, Spiegelhalter DJ. Use of risk-adjusted CUSUM and RSPRT charts for monitoring in medical contexts. Stat Methods Med Res 2003; 12: 147-170.
- 3. Cook DA, Steiner SH, Cook RJ, et al. Monitoring the evolutionary process of quality: risk-adjusted charting to track outcomes in intensive care. Crit Care Med 2003; 31: 1676-1682.
- 4. Lovegrove J, Valencia O, Treasure T, et al. Monitoring the results of cardiac surgery by variable life-adjusted display. Lancet 1997; 350: 1128-1130.
- 5. Lawrance R, Dorsch M, Sapsford R, et al. Use of cumulative mortality data in patients with acute myocardial infarction for early detection of variation in clinical practice. BMJ 2001; 323: 324-327.
- 6. Speigelhalter D, Grigg O, Kinsman R, Treasure T. Risk-adjusted sequential probability ratio tests: applications to Bristol, Shipman and adult cardiac surgery. Int J Qual Health Care 2003; 15: 7-13.
- 7. Duckett SJ, Coory M, Sketcher-Baker K. Identifying variations in quality of care in Queensland hospitals. Med J Aust 2007; 187: 571-575. <MJA full text>
- 8. Iezzoni L. Assessing quality using administrative data. Ann Intern Med 1997; 127: 666-674.
- 9. Aylin P, Bottle A, Majeed A. Use of administrative data or clinical databases as predictors of risk of death in hospital: comparison of models. BMJ 2007; 334: 1014-1015.
- 10. Geraci JM, Johnson ML, Gordon HS, et al. Mortality after cardiac bypass surgery: prediction from administrative versus clinical data. Med Care 2005; 43: 149-58.
- 11. Hanley JA, McNeil BJ. The meaning and use of the area under a receiver operating characteristic (ROC) curve. Radiology 1982; 143: 29-36.
- 12. Tu JV, Austin PC, Walld R, et al. Development and validation of the Ontario acute myocardial infarction mortality prediction rules. J Am Coll Cardiol 2001; 37: 992–997.
- 13. Killip T III, Kimball JT. Treatment of myocardial infarction in a coronary care unit: a two year experience with 250 patients. Am J Cardiol 1967; 20: 457-464.
- 14. Granger CB, Goldberg RJ, Dabbous O, et al. Predictors of hospital mortality in the Global Registry of Acute Coronary Events. Arch Intern Med 2003; 163: 2345-2353.
- 15. Joint European Society of Cardiology/American College of Cardiology Committee. Myocardial infarction redefined — a consensus document of the Joint European Society of Cardiology/American College of Cardiology Committee for the Redefinition of Myocardial Infarction. J Am Coll Cardiol 2000; 36: 959-969.
- 16. Sherlaw-Johnson C, Morton A, Robinson MB, Hall A. Real-time monitoring of coronary care mortality: a comparison and combination of two monitoring tools. Int J Cardiol 2005; 100: 301-307.
- 17. Sherlaw-Johnson C. A method for detecting runs of good and bad clinical outcomes on variable life-adjusted display (VLAD) charts. Health Care Manag Sci 2005; 8: 61-65.
- 18. Lemeshow S, Hosmer DW. A review of goodness-of-fit statistics for use in the development of logistic regression models. Am J Epidemiol 1982; 115: 92-106.
- 19. Holloway RG, Quill TE. Mortality as a measure of quality: implications for palliative and end-of-life care. JAMA 2007; 298: 802-804.
- 20. Alcalai R, Planer D, Culhaoglu A, et al. Acute coronary syndrome vs non-specific troponin elevation. Clinical predictors and survival analysis. Arch Intern Med 2007; 167: 276-281.
- 21. Kosseim M, Mayo NE, Scott S, et al. Ranking hospitals according to acute myocardial infarction mortality. Should transfers be included? Med Care 2006; 44: 664-670.
- 22. Mohammed MA, Stevens A. The value of administrative databases. BMJ 2007; 334: 1014-1015.
- 23. Mack MJ, Herbert M, Prince S, et al. Does reporting of coronary artery bypass grafting from administrative databases accurately reflect actual clinical outcomes? J Thorac Cardiovasc Surg 2005; 129: 1309-1317.
- 24. Jollis JG, Ancukiewicz M, DeLong ER, et al. Discordance of databases designed for claims payment versus clinical information systems: implications for outcomes research. Ann Intern Med 1993; 119: 844-850.
- 25. Pine M, Norusis M, Jones B, et al. Predictions of hospital mortality rates: a comparison of data sources. Ann Intern Med 1997; 126: 347-354.
- 26. Pine M, Jordan HS, Elixhauser A, et al. Enhancement of claims data to improve risk adjustment of hospital mortality. JAMA 2007; 297: 71-76.
- 27. Prytherch DR, Sirl JS, Schmidt P, et al. The use of routine laboratory data to predict in-hospital death in medical admissions. Resuscitation 2005; 66: 203-207.
- 28. Johnston T, Coory M, Scott IA, Duckett S. Should we add clinical variables to administrative data? The case of risk-adjusted case fatality rates following admission for acute myocardial infarction. Med Care 2007; 45: 1180-1185.
- 29. Iezzoni LI, Ash AS, Schwartz M, et al. Predicting who dies depends on how severity is measured: implications for evaluating patient outcomes. Ann Intern Med 1995; 123: 763-770.
- 30. Bradley EH, Holmboe ES, Mattera JA, et al. Data feedback efforts in quality improvement: lessons learned from US hospitals. Qual Saf Health Care 2004; 13: 26-31.
Abstract
Objectives: To compare results of statistical process-control analyses of in-hospital deaths of patients with acute myocardial infarction by using either administrative or clinical data sources and prediction models, and to assess variation in results according to selected patient characteristics.
Design: Retrospective, cross-sectional study comparing variable life-adjusted display (VLAD) curves derived by using administrative or clinical prediction models applied to a single patient sample.
Participants and setting: Data from 467 consecutive patients admitted to a tertiary hospital in Queensland, between 1 July 2003 and 31 March 2006, with a coded discharge diagnosis of acute myocardial infarction.
Main outcome measure: Statistical estimates of cumulative lives gained or lost in excess of those predicted at the end of the study period.
Results: The two prediction models, when applied to all patients, generated almost identical VLAD curves, showing a steadily increasing excess mortality over the study period, culminating in an estimated 11 excess deaths. Risk estimates for individual patients from each model were significantly correlated (r = 0.46, P < 0.001). After exclusion of misclassified cases, out-of-hospital cardiac arrests and deaths within 30 minutes of presentation, replotting the curves reversed the mortality trend and yielded, depending on the model, a net gain of three or seven lives. After further exclusion of transfers in from other hospitals and patients whose care had a palliative or conservative intent, the net gain increased to seven or 10 lives.
Conclusion: Appropriate patient selection is more important than choice of dataset or risk-prediction model when statistical process-control methods are used to flag unfavourable mortality trends suggestive of suboptimal hospital care.