


The known Road traffic injuries are a major cause of death and disability.
The new The disability burden associated with road traffic-related incidents declined during 2007–2015 for motor vehicle occupants, motorcyclists and pedestrians, primarily because the incidence of deaths decreased; there was no change in the rate of serious trauma. The incidence of serious trauma and the number of disability-adjusted life-years increased for pedal cyclists.
The implications Increased emphasis on reducing the substantial burden of road traffic-related serious injury is needed, with particular focus on protecting pedal cyclists.
In 2013, road traffic injuries caused 1.4 million deaths around the world, and were the main contributors to injury-related disability-adjusted life-years (DALYs).1 In Australia, road traffic injuries are the second leading cause of injury-related hospitalisations and deaths,2 and the incidence of hospitalisation for major trauma caused by road traffic events is increasing.3 As the likelihood of surviving serious injury rises,4 reducing the burden of non-fatal injury should be a priority.5
Quantifying the burden of injury informs the development of primary prevention strategies for reducing fatal and non-fatal injury rates. Prevention strategies should target specific road user groups. Data on temporal trends in the incidence of road traffic fatalities, serious injuries, and the burden of injury that is stratified by road user type are therefore needed. This is particularly important because injury rates may be increasing among vulnerable road user types (motorcyclists, pedal cyclists, pedestrians).6,7
We investigated the burden of major trauma and fatalities caused by road traffic injuries in Victoria during 2007–2015. Specifically, we assessed temporal trends in the incidence of road traffic-related major trauma, mortality, DALYs, and costs of health loss for different road user types.
Methods
Study design
We retrospectively reviewed road traffic deaths and cases of major trauma in Victoria, analysing data from the Victorian State Trauma Registry (VSTR) and the National Coronial Information System (NCIS) for 2007–2015.
Victorian State Trauma Registry
The population-based VSTR collects data about all patients hospitalised for major trauma in Victoria.8 A case is included in the VSTR if any of the following criteria are satisfied: death due to injury; an Injury Severity Score (ISS; based on the Abbreviated Injury Scale [AIS] 2005 version, 2008 update) greater than 12; admission to an intensive care unit (ICU) for more than 24 hours; or an injury requiring urgent surgery.4 The registry collects pre-hospital and acute care data; longer term functional outcome and health status information for all patients surviving until hospital discharge is collected in telephone interviews 6, 12 and 24 months after the injury.5,8
National Coronial Information System
The NCIS is an internet-based data storage and retrieval system for Australian coronial cases (http://www.ncis.org.au), including data for every death reported to the coroner since 2000. Cross-checking between the VSTR and NCIS ensures complete capture of pre-hospital and in-hospital deaths, and prevents double-counting.
Participants
All cases of major trauma and death caused by road traffic incidents during 1 January 2007 – 31 December 2015 were extracted from the VSTR and NCIS. For the purposes of this study, we restricted cases of major trauma to those with an ISS over 12, which includes patients with a predicted mortality of about 10%.9 Road traffic-related cases were included if the incident occurred on a public road, street, or highway (including footpaths and road medians, but excluding dedicated walking and cycling paths that were not a part of a road). All pre-hospital and in-hospital deaths were included. Patients injured in events outside Victoria and subsequently transported to Victorian hospitals were not included.
Road user groups were defined as motor vehicle occupants, motorcyclists, pedal cyclists, pedestrians, and other users (eg, heavy vehicle drivers). Trained data collectors assigned cases to road user types as part of standard VSTR protocol. Injuries were grouped according to AIS codes as head and other injuries, isolated head injury, chest and abdominal injuries only, orthopaedic injuries only (extremity or spine injuries, excluding spinal cord), spinal cord injury, and multiple trauma/other.
Statistical analysis
Data for road user groups were compared in χ2 or Mann–Whitney U tests as appropriate, in Stata 13.1 (StataCorp). P < 0.05 was deemed statistically significant.
Incidence of road traffic-related major trauma and mortality
Population-based incidence rates and 95% confidence intervals (CIs) were calculated for each year, based on the total population at June 30 of the corresponding year. Individual Poisson regression models determined whether the incidence rates (for all road users, and for each road user type) increased or decreased over the 9-year period. Data were checked for potential overdispersion (variance greater than the mean) to ensure that the assumptions of a Poisson distribution were met. Incidence rate ratios (IRRs) with 95% CIs were calculated.
Disability weights
Disability weights were calculated using the 3-level EuroQol five dimensions questionnaire (EQ-5D-3L), a generic measure of health status including five items: anxiety/depression; mobility; pain/discomfort; self-care; and usual activities.10 Disability weights were calculated from the EQ-5D-3L responses of adult VSTR road traffic patients with an ISS over 12 who were eligible for follow-up 6, 12 and 24 months after their injury between January 2009 and December 2014. The EQ-5D-3L was added to the registry follow-up protocol in 2009.
Weights were calculated for each injury group. A preference score for each respondent based on EQ-5D-3L responses was calculated, and normalised against age- and sex-matched values.11 Proxy responses from the immediate next of kin or designated carer were substituted when the injured patient was unable to be interviewed.12 To generate short term disability weights, a weighted average was calculated for the 24-month period following injury.13 Residual disability at 24 months was confirmed if the self-reported level of disability reported at 24 months was greater than before the injury, and this was considered permanent for the purposes of further calculations.
Disability-adjusted life-years
The DALY is a widely employed metric for quantifying disease burden,1 combining years of life lost (YLLs) and years lived with disability (YLDs). YLLs were calculated by multiplying the number of deaths by the standard life expectancy in years at age of death, as defined by the 2013–2015 Australian standard life table.14 YLDs were calculated by multiplying the number of incident cases by the average duration of the disease (years expected to be lived in the disabled state) and the disability weight.15 Total DALYs were calculated by adding the YLDs and YLLs for each year. Consistent with the 2015 Global Burden of Disease and earlier studies, age discounting was not applied;3 consistent with World Health Organization recommendations for burden of disease studies, economic discounting (3%) was applied.16
Costs
Consistent with other studies of traffic-related injuries,3 economic costs were calculated from the value of a statistical life-year (VSLY). The VSLY is an estimate of the social willingness to pay for averting a premature death, and is considered appropriate for estimating the value of reduced risk of physical harm. The VSLY was defined by the Australian government in 2014 as $182 000 per DALY.17
Ethics approval
The VSTR has ethics approval from the Department of Health and Human Services Human Research Ethics Committee (HREC) for 138 Victorian hospitals receiving patients admitted for trauma (reference, DHHREC 11/14), and from the Monash University HREC (reference, CF13/3040 – 2001000165). Access to NCIS data is included in the VSTR protocol and is approved by the NCIS custodian and the Department of Justice HREC (reference, M0047). The study reported in this article was approved by the Monash University HREC (reference, CF16/1822 – 2016000933).
Results
During 2007–2015, 10 092 road traffic-related fatalities and major trauma cases in Victoria were recorded, including 2026 pre-hospital deaths and 8066 hospitalisations for major trauma (562 in-hospital deaths). Of the major trauma cases, 4439 involved motor vehicle occupants (55.0%), 1520 motorcyclists (18.8%), 893 pedal cyclists (11.1%), 1155 pedestrians (14.3%) and 59 involved other road users (0.7%). The mean age was lower and the proportion classified as multiple trauma/other was higher for motor vehicle occupants and motorcyclists than for pedal cyclists and pedestrians (Box 1).
Of the 2588 pre-hospital and in-hospital fatalities, 1733 were motor vehicle occupants (67.0%), 343 motorcyclists (13.3%), 74 pedal cyclists (2.9%), 406 pedestrians (15.7%) and 32 other road users (1.2%).
Incidence of road traffic major trauma and mortality
The incidence of hospitalisation for all road traffic-related major trauma did not change over the study period (IRR [per year], 1.01; 95% CI, 1.00–1.01; P = 0.25). Nor was there a change in the incidence of hospitalisation of motor vehicle occupants (IRR, 1.00; 95% CI, 0.99–1.01; P = 0.70), motorcyclists (IRR, 0.99; 95% CI, 0.97–1.01; P = 0.45) or pedestrians (IRR, 1.00; 95% CI, 0.97–1.02; P = 0.73). However, the incidence of hospitalisation of pedal cyclists for road traffic-related major trauma increased by 8% per year (IRR, 1.08; 95% CI, 1.05–1.10; P < 0.001) (Box 2, Box 3; online Appendix, table 1).
The incidence of all road traffic deaths declined by 4% per year (IRR, 0.96; 95% CI, 0.94–0.97; P < 0.001; online Appendix, figure 1). The incidence of deaths of motor vehicle occupants (IRR, 0.96; 95% CI, 0.94–0.97; P < 0.001) and motorcyclists (IRR, 0.94; 95% CI: 0.90–0.97; P = 0.001) declined. There was no statistically significant change in the incidence of deaths of pedal cyclists (IRR, 0.98; 95% CI, 0.90–1.07; P = 0.63) or pedestrian fatalities (IRR, 0.96; 95% CI, 0.93–1.00; P = 0.05) (Box 3; online Appendix, figure 2).
Disability-adjusted life-years and total costs
Of the 5100 VSTR road traffic cases eligible for follow-up during 2009–2014, EQ-5D-3L responses were available for 3597 people at any of the time points, yielding the disability weights in Box 4.
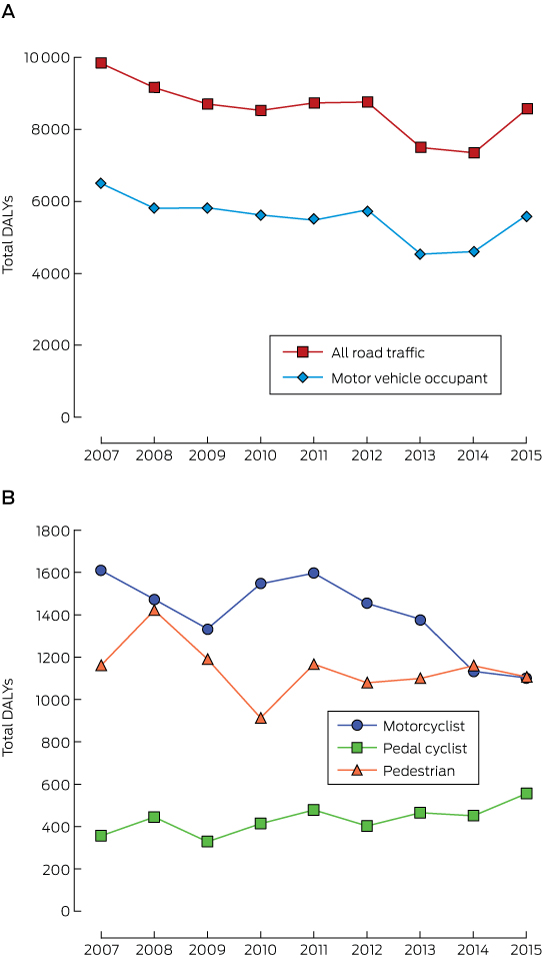
YLLs declined for all road user groups over the study period, the difference ranging from 12% for pedestrians to 49% for motorcyclists (online Appendix, tables 3–6). YLDs increased for all road user groups, the difference ranging from 4% for motor vehicle occupants to 150% for pedal cyclists.
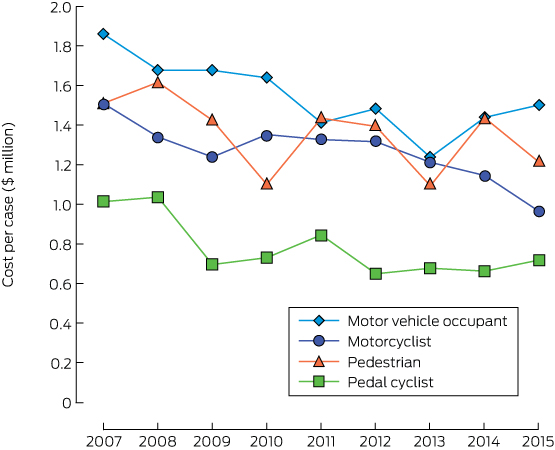
For all road traffic users, DALYs declined by 13% between 2007 and 2015 (online Appendix, table 2). They also declined for motor vehicle occupants (13%), motorcyclists (32%) and pedestrians (5%); in contrast, DALYs for pedal cyclists increased by 56% (Box 5). DALYs per case declined over the study period in all road user groups (online Appendix, tables 3–6). The total costs of health loss for major trauma and deaths over the study period were $9.1 billion for motor vehicle occupants, $2.3 billion for motorcyclists, $0.7 billion for pedal cyclists, and $1.9 billion for pedestrians (online Appendix, table 4). Costs of health loss per person were lower in 2015 than in 2007 for all road user groups (Box 6).
Discussion
We investigated the burden of road traffic injury over a 9-year period. While the incidence of hospitalisation of motor vehicle occupants, motorcyclists and pedestrians for major trauma was stable, that of pedal cyclists increased. Similarly, while DALYs declined for motor vehicle occupants, motorcyclists and pedestrians, they increased for pedal cyclists. The estimated costs of health loss associated with road traffic injuries exceeded $14 billion during 2007–2015, although the cost per patient declined for all road user groups.
Few studies have investigated temporal trends in the incidence of hospitalisation for major trauma, the incidence of deaths, and the burden of injury caused by road-related incidents for individual road user types. We found that declines in the numbers deaths of motor vehicle occupants and motorcyclists led to temporal reductions in YLLs and, consequently, in DALYs for these road user groups. As there were few pedal cyclist fatalities, the contribution of YLLs to DALYs was low compared with other road user groups. However, the incidence of hospitalisation for major trauma increased, with a substantial rise in YLDs; consequently, DALYs for pedal cyclists increased by 56% from 2007 to 2015. Other studies have similarly found increasing injury rates for cyclists.18,19 These findings may be partly explained by increased cycling participation rates, a factor for which we could not adjust our analysis. However, increasing rates of injury to pedal cyclists suggest that further investment in their safety, such as providing dedicated and separated cycle paths, is needed to reduce their burden of injury, particularly as cycling bodies and public health activists continue to advocate increased cycling participation.20
Australia is internationally recognised for its success in improving road safety; interventions such as legislation for compulsory seat belt use and restricting drink-driving, targeted public safety campaigns, and lower speed limits have reduced road traffic mortality.21 However, our finding of no change in the incidence of hospitalisation for major trauma indicates that the impact of such interventions is not translating into reduced rates of serious injury. Given the substantial burden of serious road traffic injury and the associated economic costs, efforts to improve road safety should clearly shift in emphasis to averting serious injuries. Road safety organisations in Australia and overseas have recognised this need by including serious injury reduction targets in recent road safety strategies.22,23 For example, Sweden’s “Vision Zero” aims to eliminate road trauma-related deaths and serious injuries;22 as part of its “Towards Zero” strategy, the Victorian state government has set a target of reducing serious injuries between 2016 and 2020 by 15%.23 While the number of road traffic fatalities has declined, we found that the burden of serious injury persists, with YLDs increasing for all road user groups. As we are now halfway through the World Health Organization “Decade of Action for Road Safety”,24 it is evident that further efforts in primary and secondary prevention are needed, particularly for protecting pedal cyclists.
The strengths of our study included its population-level capture of road traffic-related major trauma cases and the calculation of disability weights from VSTR data for patients injured in traffic accidents for a period similar to that of the overall study. However, despite high follow-up rates, bias caused by loss to follow-up is possible, although different methods for adjusting for this factor have little or no impact on the calculation of disability weights.25 Additionally, we applied estimates of the cost of the loss of health rather than deriving comprehensive measures of direct and indirect costs. The denominator in our study for calculating incidence was the population of Victoria during the corresponding year, as we had no measures of exposure to risk of traffic-related trauma, such as time at risk or distance travelled. Valid exposure data are needed to fully explain incidence rates and changes over time, and to further inform public policy. Further, the absence of a recognised definition of serious injury restricts comparisons between states and territories. Finally, the VSTR does not contain detailed accident information, so we could not calculate DALYs for specific incident types (eg, frontal, side, or rear impacts).
Conclusion
During 2007–2015, the total cost of health loss related to road traffic injuries in Victoria exceeded $14 billion. The disability burden for motor vehicle occupants, motorcyclists and pedestrians declined, primarily because of lower fatality numbers. However, there was no change in the incidence of hospitalisation for major trauma among these road user groups. Further, the incidence of hospitalisation of pedal cyclists for major trauma and the associated DALYs each increased. Given these findings, it is likely that current road safety targets, such as those set by the World Health Organization and the Victorian state government, will be difficult to meet. Greater focus on reducing the rate of serious injury and further investment in road safety, particularly for pedal cyclists, is needed.
Box 1 – Demographic and injury information for patients hospitalised for road traffic-related major trauma (Injury Severity Score [ISS] > 12), by road user type*
|
|
All road users |
Motor vehicle occupants |
Motorcyclists |
Pedal cyclists |
Pedestrians |
P† |
|||||||||
|
|
|||||||||||||||
|
Number of cases |
8066 |
4439 |
1520 |
893 |
1155 |
|
|||||||||
|
Age (years), median (IQR) |
40 (24–58) |
38 (23–60) |
37 (26–50) |
46 (35–56) |
46 (25–70) |
< 0.001 |
|||||||||
|
Sex |
|
|
|
|
|
< 0.001 |
|||||||||
|
Male |
5634 (69.9%) |
2725 (61.4%) |
1417 (93.2%) |
777 (87.0%) |
671 (58.1%) |
|
|||||||||
|
Female |
2432 (30.2%) |
1714 (38.6%) |
103 (6.8%) |
116 (13.0%) |
484 (41.9%) |
|
|||||||||
|
ISS, median (IQR) |
19 (14–27) |
19 (14–27) |
18 (14–26) |
17 (14–22) |
22 (17–29) |
< 0.001 |
|||||||||
|
Injury group |
|
|
|
|
|
< 0.001 |
|||||||||
|
Isolated head injury |
392 (4.9%) |
179 (4.0%) |
20 (1.3%) |
57 (6.4%) |
124 (10.7%) |
|
|||||||||
|
Head and other injuries |
2523 (31.3%) |
1242 (28.0%) |
368 (24.2%) |
307 (34.4%) |
588 (50.9%) |
|
|||||||||
|
Chest/abdominal injuries only |
237 (2.9%) |
131 (3.0%) |
55 (3.6%) |
41 (4.6%) |
7 (0.6%) |
|
|||||||||
|
Orthopaedic injuries only |
447 (5.5%) |
203 (4.6%) |
122 (8.0%) |
54 (6.1%) |
67 (5.8%) |
|
|||||||||
|
Spinal cord injury |
203 (2.5%) |
117 (2.6%) |
45 (3.0%) |
32 (3.6%) |
7 (0.6%) |
|
|||||||||
|
Multiple trauma/other |
4264 (52.9%) |
2567 (57.8%) |
910 (59.9%) |
402 (45.0%) |
362 (31.3%) |
|
|||||||||
|
In-hospital deaths |
562 (7.0%) |
304 (6.9%) |
50 (3.3%) |
30 (3.4%) |
173 (15.0%) |
< 0.001 |
|||||||||
|
|
|||||||||||||||
|
IQR = interquartile range. * Data for “other traffic users” (n = 59) are not presented. † Comparisons of road user groups: χ2 test (sex, injury group, in-hospital deaths) or Mann–Whitney U test (age, ISS). |
|||||||||||||||
Box 2 – Incidence per 100 000 population (with 95% confidence intervals) of hospitalisation for road traffic-related major trauma, Victoria, 2007–2015. A. For all road user types and for motor vehicle occupants; B. For motorcyclists, pedal cyclists and pedestrians (note the different scales)
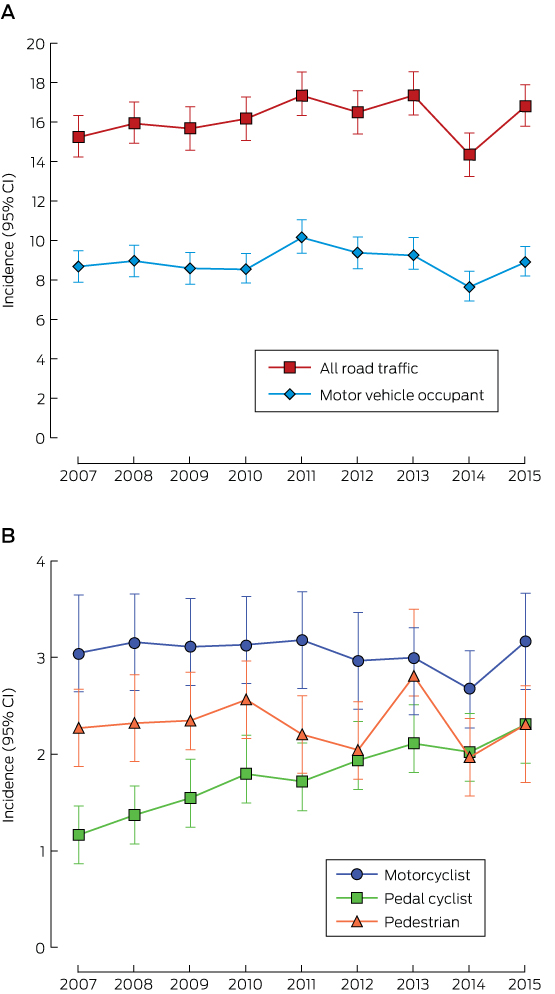
Box 3 – Changes in the incidence of road traffic-related hospitalisations for major trauma and deaths, Victoria, 2007–2015
|
|
Hospitalisations for major trauma |
Deaths |
|||||||||||||
|
Incidence rate ratio, per year (95% CI) |
P |
Incidence rate ratio, per year (95% CI) |
P |
||||||||||||
|
|
|||||||||||||||
|
All road users |
1.01 (1.00–1.01) |
0.25 |
0.96 (0.94–0.97) |
< 0.001 |
|||||||||||
|
Motor vehicle occupants |
1.00 (0.99–1.01) |
0.70 |
0.96 (0.94–0.97) |
< 0.001 |
|||||||||||
|
Motorcyclists |
0.99 (0.97–1.01) |
0.45 |
0.94 (0.90–0.97) |
0.001 |
|||||||||||
|
Pedestrians |
1.00 (0.97–1.02) |
0.73 |
0.96 (0.93–1.00) |
0.05 |
|||||||||||
|
Pedal cyclists |
1.08 (1.05–1.10) |
< 0.001 |
0.98 (0.90–1.07) |
0.63 |
|||||||||||
|
|
|||||||||||||||
|
CI = confidence interval. |
|||||||||||||||
Box 4 – Disability weights and proportions of patients with disability 24 months after their injury, by injury group*
|
Injury group |
Number of patients |
Disability weights (standard error) |
Final short term weight |
Final long term weight |
Proportion of patients with disability at 24 months (95% CI) |
||||||||||
|
6 months |
12 months |
24 months |
|||||||||||||
|
|
|||||||||||||||
|
Isolated head injury |
134 |
0.155 (0.025) |
0.136 (0.024) |
0.138 (0.026) |
0.142 |
0.138 |
53% (44.4–61.5%) |
||||||||
|
Head and other injuries |
982 |
0.222 (0.009) |
0.190 (0.009) |
0.195 (0.010) |
0.200 |
0.195 |
66% (62.9–68.9%) |
||||||||
|
Chest/abdominal injuries only |
110 |
0.070 (0.022) |
0.057 (0.025) |
0.044 (0.025) |
0.054 |
0.044 |
37% (28.1–46.5%) |
||||||||
|
Orthopaedic injuries only |
202 |
0.248 (0.017) |
0.201 (0.018) |
0.198 (0.024) |
0.211 |
0.198 |
69% (62.9–75.7%) |
||||||||
|
Spinal cord injury |
90 |
0.562 (0.035) |
0.502 (0.037) |
0.464 (0.042) |
0.498 |
0.464 |
89% (82.3–95.5%) |
||||||||
|
Multiple trauma/other |
2079 |
0.201 (0.180) |
0.180 (0.006) |
0.174 (0.007) |
0.182 |
0.174 |
60% (57.6–61.8%) |
||||||||
|
|
|||||||||||||||
|
CI = confidence interval. * Total number of patients injured in road traffic crashes, 2009–2014, for whom EQ-5D-3L responses were available: 3597. |
|||||||||||||||
Received 5 January 2017, accepted 30 March 2017
- Ben Beck1
- Peter A Cameron1,2
- Mark C Fitzgerald2,3
- Rodney T Judson4
- Warwick Teague5
- Ronan A Lyons6
- Belinda J Gabbe1,6
- 1 Monash University, Melbourne, VIC
- 2 Emergency and Trauma Centre, The Alfred Hospital, Melbourne, VIC
- 3 National Trauma Research Institute, Melbourne, VIC
- 4 Private Medical Centre, Royal Melbourne Hospital, Melbourne, VIC
- 5 Royal Children's Hospital, Melbourne
- 6 Farr Institute, Swansea University, Swansea, Wales, United Kingdom
The Victorian State Trauma Registry (VSTR) is funded by the Department of Health and Human Services, the State Government of Victoria, and the Transport Accident Commission. Ben Beck received salary support from the National Health and Medical Research Council (NHRMC) Australian Resuscitation Outcomes Consortium (Aus-ROC) Centre of Research Excellence (1029983). Peter Cameron was supported by an NHMRC Practitioner Fellowship (545926) and Belinda Gabbe by an NHMRC Career Development Fellowship (GNT1048731). Warwick Teague’s role as director of trauma services at the Royal Children’s Hospital, Melbourne, is supported by a grant from the Royal Children’s Hospital Foundation. We thank the Victorian State Trauma Outcome Registry and Monitoring (VSTORM) group for providing VSTR data. We also thank Sue McLellan for her assistance with the data, Pam Simpson for her statistical support, and David Attwood from the Transport Accident Commission for his suggestions and advice.
No relevant disclosures.
- 1. Haagsma JA, Graetz N, Bolliger I, et al. The global burden of injury: incidence, mortality, disability-adjusted life years and time trends from the Global Burden of Disease study 2013. Inj Prev 2016; 22: 3-18.
- 2. Henley G, Harrison JE. Trends in injury deaths, Australia: 1999–00 to 2009–10 (AIHW Cat. No. INJCAT 150; Injury Research and Statistics Series No. 74). Canberra: Australian Institute of Health and Welfare, 2015.
- 3. Gabbe BJ, Lyons RA, Fitzgerald MC, et al. Reduced population burden of road transport-related major trauma after introduction of an inclusive trauma system. Ann Surg 2015; 261: 565-572.
- 4. Cameron PA, Gabbe BJ, Cooper DJ, et al. A statewide system of trauma care in Victoria: effect on patient survival. Med J Aust 2008; 189: 546-550. <MJA full text>
- 5. Gabbe BJ, Sutherland AM, Hart MJ, et al. Population-based capture of long-term functional and quality of life outcomes after major trauma: the experiences of the Victorian State Trauma Registry. J Trauma Acute Care Surg 2010; 69: 532-536.
- 6. Henley G, Harrison JE. Trends in serious injury due to land transport accidents, Australia: 2000–01 to 2008–09 (AIHW Cat. No. INJCAT 142). Canberra: Australian Institute of Health and Welfare, 2012.
- 7. Lyons RA, Ward H, Brunt H, et al. Using multiple datasets to understand trends in serious road traffic casualties. Accid Anal Prev 2008; 40: 1406-1410.
- 8. Cameron PA, Finch CF, Gabbe BJ, et al. Developing Australia’s first statewide trauma registry: what are the lessons? ANZ J Surg 2004; 74: 424-428.
- 9. Palmer CS, Gabbe BJ, Cameron PA. Defining major trauma using the 2008 Abbreviated Injury Scale. Injury 2016; 47: 109-115.
- 10. Brooks R. EuroQol: the current state of play. Health Policy 1996; 37: 53-72.
- 11. Dolan P. Modeling valuations for EuroQol health states. Med Care 1997; 35: 1095-1108.
- 12. Gabbe BJ, Lyons RA, Sutherland AM, et al. Level of agreement between patient and proxy responses to the EQ-5D health questionnaire 12 months after injury. J Trauma Acute Care Surg 2012; 72: 1102-1105.
- 13. Gabbe BJ, Lyons RA, Simpson PM, et al. Disability weights based on patient-reported data from a multinational injury cohort. Bull World Health Organ 2016; 94: 806-816.
- 14. Australian Bureau of Statistics. 3302.0.55.001. Life tables, states, territories and Australia, 2013–2015. Oct 2016. http://www.abs.gov.au/ausstats/abs@.nsf/mf/3302.0.55.001 (accessed Dec 2016).
- 15. Murray CJ, Acharya AK. Understanding DALYs. J Health Econ 1997; 16: 703-730.
- 16. Prüss-Ustün A, Mathers C, Corvalán C, Woodward A. Introduction and methods: assessing the environmental burden of disease at national and local levels (Environmental Burden of Disease Series No. 1). Geneva: World Health Organization, 2003. http://www.who.int/quantifying_ehimpacts/publications/9241546204/en/ (accessed Dec 2016).
- 17. Australian Government, Department of the Prime Minister and Cabinet, Office of Best Practice. Best practice regulation guidance note: Value of statistical life. Dec 2014. https://www.dpmc.gov.au/sites/default/files/publications/Value_of_Statistical_Life_guidance_note.pdf (accessed Dec 2016).
- 18. Sanford T, McCulloch CE, Callcut RA, et al. Bicycle trauma injuries and hospital admissions in the United States, 1998–2013. JAMA 2015; 314: 947-949.
- 19. Sikic M, Mikocka-Walus AA, Gabbe BJ, et al. Bicycling injuries and mortality in Victoria, 2001–2006. Med J Aust 2009; 190: 353-356.
- 20. Australian Bicycle Council. Gearing up for active and sustainable communities. The Australian national cycling strategy 2011–2016 (Austroads Publication No. AP-C85/10). Sydney: Austroads, 2010. http://www.bicyclecouncil.com.au/files/publication/National-Cycling-Strategy-2011-2016.pdf (accessed Dec 2016).
- 21. Walls HL, Curtis AJ, Stevenson CE, et al. Reductions in transport mortality in Australia: evidence of a public health success. Accid Anal Prev 2012; 49: 520-524.
- 22. Belin M-Å, Tillgren P, Vedung E. Vision Zero — a road safety policy innovation. Int J Inj Contr Saf Promot 2012; 19: 171-179.
- 23. Victorian State Government. Towards Zero 2016–2020: Victoria’s road safety strategy and action plan 2016. Melbourne: Victoria State Government, 2016. https://www.towardszero.vic.gov.au/__data/assets/pdf_file/0010/183556/STU_0206_RS_STRATEGY_2016_web.pdf (accessed July 2016).
- 24. World Health Organization. Global status report on road safety 2013: supporting a decade of action. Geneva: World Health Organization, 2013. http://www.who.int/violence_injury_prevention/road_safety_status/2013/en/ (accessed Dec 2016).
- 25. Lyons RA, Kendrick D, Towner EM, et al. Measuring the population burden of injuries — implications for global and national estimates: a multi-centre prospective UK longitudinal study. PLoS Med 2011; 8: e1001140.
Abstract
Objective: To investigate temporal trends in the incidence, mortality, disability-adjusted life-years (DALYs), and costs of health loss caused by serious road traffic injury.
Design, setting and participants: A retrospective review of data from the population-based Victorian State Trauma Registry and the National Coronial Information System on road traffic-related deaths (pre- and in-hospital) and major trauma (Injury Severity Score > 12) during 2007–2015.
Main outcomes and measures: Temporal trends in the incidence of road traffic-related major trauma, mortality, DALYs, and costs of health loss, by road user type.
Results: There were 8066 hospitalised road traffic major trauma cases and 2588 road traffic fatalities in Victoria over the 9-year study period. There was no change in the incidence of hospitalised major trauma for motor vehicle occupants (incidence rate ratio [IRR] per year, 1.00; 95% CI, 0.99–1.01; P = 0.70), motorcyclists (IRR, 0.99; 95% CI, 0.97–1.01; P = 0.45) or pedestrians (IRR, 1.00; 95% CI, 0.97–1.02; P = 0.73), but the incidence for pedal cyclists increased 8% per year (IRR, 1.08; 95% CI; 1.05–1.10; P < 0.001). While DALYs declined for motor vehicle occupants (by 13% between 2007 and 2015), motorcyclists (32%), and pedestrians (5%), there was a 56% increase in DALYs for pedal cyclists. The estimated costs of health loss associated with road traffic injuries exceeded $14 billion during 2007–2015, although the cost per patient declined for all road user groups.
Conclusions: As serious injury rates have not declined, current road safety targets will be difficult to meet. Greater attention to preventing serious injury is needed, as is further investment in road safety, particularly for pedal cyclists.