


Abstract
Objective: To define the changes in sodium levels of Australian fast foods between 2009 and 2012 overall, in major food subcategories and by company.
Design: A comparison of mean sodium content was made across 4 years using t tests and mixed models.
Setting: Nutrient content data for fast-food menu items collected from company websites of six large Australian fast-food chains.
Main outcome measures: Mean sodium values in mg/100 g and mg/serve.
Results: There were between 302 and 381 products identified each year. Overall, the mean sodium content of fast-food products decreased between 2009 and 2012 by 43 mg/100 g (95% CI, − 66 to − 20 mg/100 g), from 514 mg/100 g in 2009 to 471 mg/100 g in 2012. Mean sodium content per serving was not significantly different at 654 mg in 2009 and 605 mg in 2012 (− 49 mg; 95% CI, − 108 to + 10 mg), reflecting wide variation in the serving sizes of items offered each year. There was a small decline in sodium content over the 4 years across most food categories and food companies.
Conclusions: The observed reduction in the sodium content of fast foods during the 4-year study period is encouraging. However, the reductions are small, and fast-food companies should be encouraged to make further and larger reductions since many products still contain high levels of sodium.
The burden of ill health attributable to obesity, type 2 diabetes and other diet-related health risks is increasing in both developed and developing countries.1 Fast foods, which are convenient, quick and cheap, are generally nutrient-poor and eaten in large portions that can contribute significantly to energy, fat, sugar and sodium intake.2 Links between fast-food consumption and a range of chronic diseases have been made,3 with excess dietary sodium causing high blood pressure4 and a range of vascular diseases.5,6 Although there is no current definitive estimate of population dietary salt intake in Australia, it is widely accepted that average consumption is well above the government’s suggested dietary target of 4 g/day.7 About three-quarters of salt in the diet comes from processed and restaurant foods,4 with fast foods known to be a significant contributor in Western populations.8
In Australia, expenditure on fast foods has risen substantially over recent years9 and there is evidence that children who are exposed to unhealthy dietary patterns carry these behaviours into adulthood.3 The Australian Government’s 2009 National Preventative Health Strategy - the roadmap for action10 identified the need to improve the healthiness of fast foods in Australia, and the Food and Health Dialogue has commenced a food reformulation program.11 Neither, however, has set targets for fast foods, although some companies and non-government organisations have been working to lower salt levels in these products.12,13 These efforts have been informed by data that systematically describe the salt levels in Australian fast foods1 and how they compare with those in other countries.14 The primary objective of this study was to determine whether there have been any changes in the sodium content of leading Australian fast-food products in the 4 years from 2009 to 2012.
Nutrient content data were obtained from surveys of the information available on company websites for fast-food menu items available from six leading fast-food companies in Australia. Identical surveys were done in March each year in 2009, 2010, 2011 and 2012.
Definitions of food types are those used in previous reports,1,15 and were derived from categorisations commonly used by the fast-food industry. In this study, items were grouped into seven broad categories: breakfast products, burgers, chicken products, pizzas, salads, sandwiches and side menu items. Other categories, such as beverages and desserts, were excluded since they generally have low levels of sodium.
Nutrient data for 2009, 2010, 2011 and 2012 were available for fast-food menu items served by six leading fast-food companies in Australia: Domino’s, Hungry Jack’s, Kentucky Fried Chicken (KFC), McDonald’s, Subway and Pizza Hut. We focused on these fast-food companies since they are six of the largest fast-food companies globally.16
We first assessed the distributions of the sodium variables and confirmed no major deviations from normality for measures per 100 g or per serve by reviewing the graphed data for all years, for all products, for separate categories of products and for products sold by each company. We used independent samples t tests to estimate differences in sodium content across the whole range of products, and by each category and company, between 2009 and 2012. In addition, we fitted mixed models to estimate average annual changes in sodium per 100 g and sodium per serve over the same period. These models used the data from all 4 years in a two-level model with a random coefficient and intercept for the year variable. Two-tailed 95% CIs were estimated for both the t tests and the mixed models. We made no correction for multiple testing, since we drew our main conclusions from the two overall analyses shown in Box 1 and treated the other analyses as exploratory only. Stata version 12.1 (StataCorp) was used for all calculations.
Overall, sodium data were available for 1410 products: 302 in 2009, 348 in 2010, 381 in 2011, and 379 in 2012 (Box 1). Pizzas comprised the greatest number of products, accounting for between one-half and one-third of items each year, while salads made up the least (Box 2 and Appendix 1). Likewise, Domino’s accounted for two to three times more products each year than other companies (Box 3 and Appendix 2). Mean sodium levels varied between food categories and between companies each year, and there was variation in sodium levels between products, which was particularly wide for side menu items because of the different types of products included in this category (Box 2).
The overall mean sodium content across all items offered by major chains fell by 43 mg/100 g (95% CI, − 66 to − 20 mg/100 g) between 2009 and 2012, from 514 mg/100 g to 471 mg/100 g (Box 1). The corresponding mixed model provided a directly comparable estimate of the annual fall in sodium of 14 mg/100 g/year (95% CI, − 16 to − 11 mg/100 g). The sodium content per serve across all products was 654 mg in 2009 and 605 mg in 2012 (difference, − 49 mg/serve; 95% CI, − 108 to + 10 mg/serve), with the average annual fall estimated to be 21 mg/year (95% CI, − 25 to − 16 mg/year) (Box 1). Most product categories had lower mean sodium levels per 100 g and per serve in 2012 compared with 2009, and the mixed models suggested corresponding falls in sodium over the 4 years in all categories except breakfast products and sides (Box 2 and Appendix 1). Side menu items were the only category for which there was a rise in sodium content over the 4-year study period. This appears to reflect the introduction in 2012 by Pizza Hut of side menu items that had a high sodium content and large serving sizes. Pizza Hut was the only company with an indication of a possible increase in the sodium content of their products. For all other companies, it appeared sodium levels decreased over the 4 years (Box 3 and Appendix 2). A peak in the sodium content of sandwiches and Domino’s products in 2011 resulted from 26 sandwich items that were present in 2011 but absent in other years. For sodium per serve of chicken products, there is an apparent discrepancy between a decrease observed in the annualised data derived from the mixed model and a rise when just 2009 and 2012 data are compared. This was found to be a consequence of a small number of chicken products introduced in 2011 that had high levels of sodium per serving.
There has been a small reduction in the overall mean sodium content of fast foods between 2009 and 2012. Our finding of a statistically significant reduction of 2%–3% in sodium levels each year in Australian fast-food products is encouraging, although sodium levels in many fast-food products are still high. In many cases, there is wide variability in the sodium content of very similar products, suggesting that there is no technical reason preventing further sodium reduction in many. The wide variation in sodium content per serving highlights the need for standardisation of portion sizes. Further, trends towards increased fast-food portion sizes globally17 could easily undo the benefits achieved by reducing levels of sodium per 100 g of product. While the direction of the change in sodium levels in Australian fast foods is promising, there is an urgent need for a sector-wide strategy that will deliver further falls in the short term.
Australian efforts to reduce dietary sodium parallel work to lower the sodium levels of restaurant foods in the United Kingdom, Canada and United States.18,19 While data to objectively describe changes in salt levels of fast foods are not available for these countries, there are reports showing that salt levels in UK fast-food products are generally lower than those of other countries,14 reflecting the intensive work done by the UK Food Standards Agency over the past decade.20 Following the success of the UK program, and with strong government backing, both the US and Canada have based their sodium reduction strategies on the UK model.21,22 The US National Salt Reduction Initiative identified that different patterns of consumption between packaged foods and restaurant foods required different sodium reduction targets and have tailored their program accordingly.21 Likewise, the Sodium Reduction Strategy for Canada specifically targeted fast foods,22 and while disbanded in early 2011, most territorial and provincial governments of Canada are calling on their federal government to persist with efforts to reduce the sodium intake of the Canadian population. Australia does not currently have the same kind of coherent approach, and the adoption of a strategy similar to the UK would seem a sensible way of enhancing Australia’s current salt reduction efforts, particularly in relation to the fast-food sector. The establishment of the government’s Food and Health Dialogue is a welcome start, although fast food has yet to be targeted.
The success of the UK program has been attributed to the strength of government engagement in the process. It is becoming increasingly clear that changes to the food supply will only be achieved by regulation, or the threat of regulation by a government committed to addressing diet-related disease burden. As for other industrial diseases, the commercial imperative of the food industry to deliver shareholder value appears likely to override health concerns until regulatory checks are put in place.23 While individual companies may deliver moderate improvements to their products, there is little evidence that significant sector-wide improvements can be achieved in a non-regulated setting.
The primary strength of this study is that data on the sodium content of fast foods were collected in a standardised way, over a number of years, and therefore provide an objective measure of sodium levels in Australian fast foods on an ongoing basis. While only six chains were included, these six companies are sector leaders in Australia and globally.16 Nutrition information provided on company websites was used, and although there is no guarantee that the information was accurate, most large chains report that they base their nutrient data on analysis done by external parties. Unpublished data comparing reported sodium values to analytical values for a sample of 115 popular fast-food items has shown good correlation of results in Australia. A further limitation of our analysis is that estimates were crude means. Sales-weighted estimates that captured market share for each product would have been a better way of estimating the likely public health impact of observed changes in salt content. However, the broad comparability of the changes across subcategories of products suggests sales weighting would not have changed the primary conclusions.
Although KFC and Pizza Hut are both owned by Yum! Brands, sodium in KFC products decreased over the study period, yet increased for Pizza Hut. A similar observation has been made for salt levels in breads, where a leading manufacturer in Australasia decreased sodium in products in one country but increased them in the other.24 This is symptomatic of the lack of a coordinated effort to improve the healthiness of foods in many large corporations and the absence of government leadership. The success of the UK program shows that this problem can be rectified but it will require stronger federal government engagement and a comprehensive and transparent target-setting process. The regular reporting of objective metrics, as exemplified by the Food Safety Authority of Ireland, could also advance sodium reduction activities in Australia.25 Salt reduction remains one of the most cost-effective options for improving public health in Australia and many other countries. The key question continues to be how to persuade industry and government to take the actions required to reap the benefits of reducing the salt intake of the population.
1 Sodium content of fast foods in Australia from 2009 to 2012*
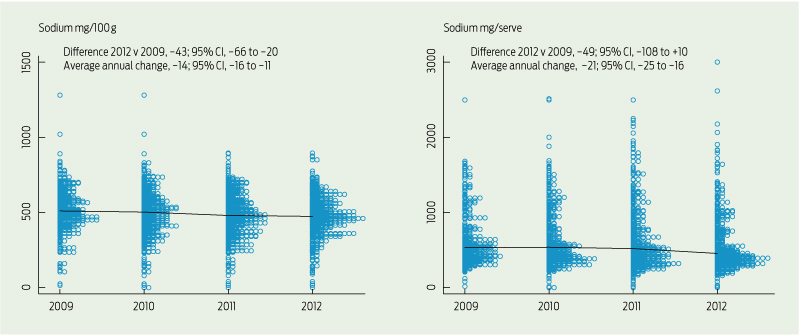
* Each circle represents one product, and the line connects the median values in each year. The differences (95% CI) are reported for 2012 v 2009, and as an annualised average change over the 4-year study period.
2 Sodium content of fast foods in Australia from 2009 to 2012 for major food subcategories*
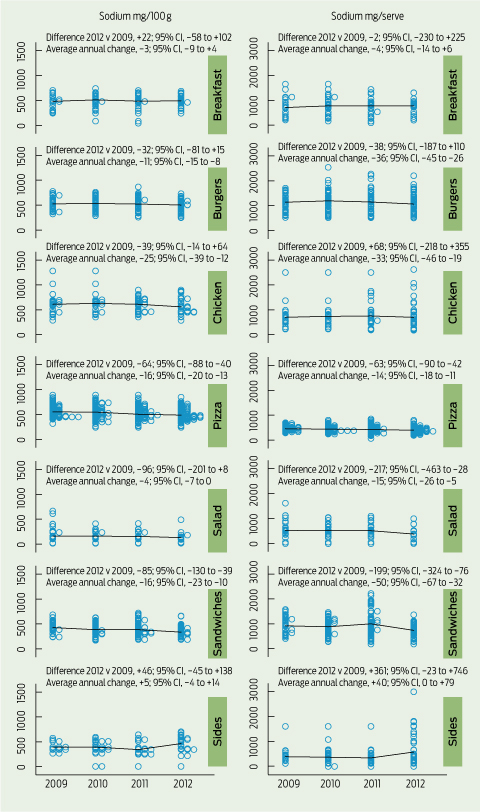
* Each circle represents one product, and the line connects the median values in each year. The differences (95% CI) are reported for 2012 v 2009, and as an annualised average change over the 4-year study period.
3 Sodium content of fast foods in Australia from 2009 to 2012 for each company included*
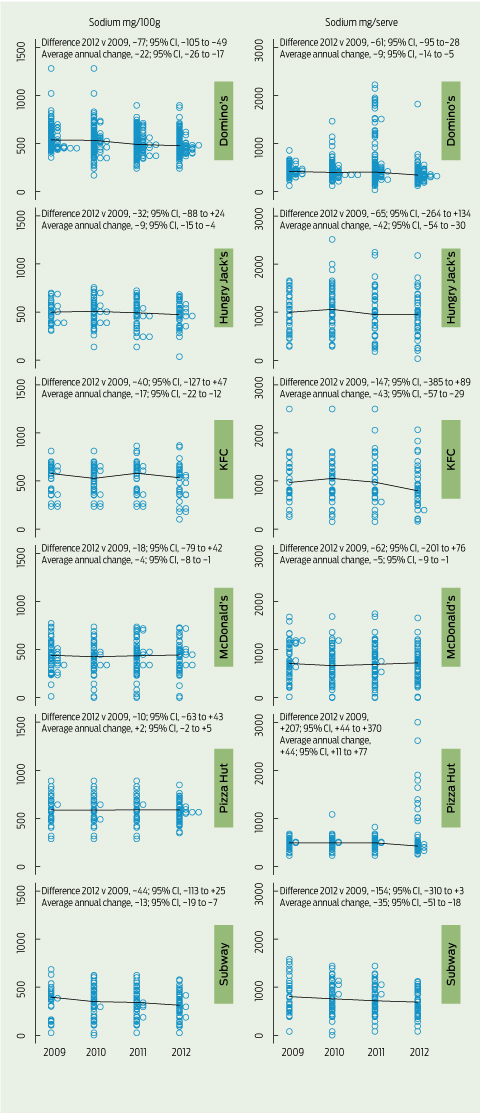
* Each circle represents one product, and the line connects the median values in each year. The differences (95% CI) are reported for 2012 v 2009, and as an annualised average change over the 4-year study period.
Received 13 January 2013, accepted 22 October 2013
- Julianne Garcia1
- Elizabeth K Dunford2
- Johan Sundstrom3
- Bruce C Neal4
- The George Institute for Global Health, Sydney, NSW.
Bruce Neal is the chairman of the Australian Division of World Action on Salt and Health.
- 1. Dunford E, Webster J, Barzi F, Neal B. Nutrient content of products served by leading Australian fast food chains. Appetite 2010; 55: 484-489.
- 2. Rangan AM, Schindeler S, Hector DJ, et al. Consumption of ‘extra’ foods by Australian adults: types, quantities and contribution to energy and nutrient intakes. Eur J Clin Nutr 2009; 63: 865-871.
- 3. Lucan SC, Karpyn A, Sherman S. Storing empty calories and chronic disease risk: snack-food products, nutritive content, and manufacturers in Philadelphia corner stores. J Urban Health 2010; 87: 394-409.
- 4. Gibson S, Ashwell M. Dietary patterns among British adults: compatibility with dietary guidelines for salt/sodium, fat, saturated fat and sugars. Public Health Nutr 2011; 14: 1323-1336.
- 5. Ezzati M, Lopez AD, Rodgers A, et al. Selected major risk factors and global and regional burden of disease. Lancet 2002; 360: 1347-1360.
- 6. Havas S, Dickinson BD, Wilson M. The urgent need to reduce sodium consumption. JAMA 2007; 298: 1439-1441.
- 7. National Health and Medical Research Council. Nutrient reference values for Australia and New Zealand including recommended dietary intakes. Canberra: Department of Health and Ageing, 2006. http://www.nhmrc.gov.au/guidelines/publications/n35-n36-n37 (accessed Feb 2014).
- 8. Paeratakul S, Ferdinand DP, Champagne CM, et al. Fast-food consumption among US adults and children: dietary and nutrient intake profile. J Am Diet Assoc 2003; 103: 1332-1338.
- 9. Australian Bureau of Statistics. Household Expenditure Survey, Australia: summary of results, 2009-10. Canberra: Australian Bureau of Statistics, 2011. (ABS Cat. No. 6530.0.) http://www.abs.gov.au/ausstats/abs@.nsf/mf/6530.0 (accessed Feb 2014).
- 10. National Preventative Health Taskforce. Australia: the healthiest country by 2020. National Preventative Health Strategy - the roadmap for action. Canberra: NPHT, 2009. http://www.preventativehealth.org.au/internet/preventativehealth/publishing.nsf/Content/nphs-roadmap-toc (accessed Feb 2014).
- 11. Department of Health and Ageing. Food and health dialogue communique. Canberra: Commonwealth of Australia, 2012.
- 12. Australian Division of World Action on Salt and Health. The food industry. Sydney: AWASH, 2009. http://www.awash.org.au/drop-the-salt-campaign/the-food-industry (accessed Apr 2012).
- 13. National Heart Foundation. Cutting salt could save 6,000 lives a year [media release]. 17 May 2012. http://www.heartfoundation.org.au/SiteCollectionDocuments/170512%20Cutting% 20salt%20could%20save%206,000%20lives%20a%20year.pdf (accessed Apr 2012).
- 14. Dunford E, Webster J, Woodward M, et al. The variability of reported salt levels in fast foods across six countries: opportunities for salt reduction. CMAJ 2012; 184: 1023-1028.
- 15. Johnson CM, Angell SY, Lederer A, et al. Sodium content of lunchtime fast food purchases at major US chains. Arch Intern Med 2010; 170: 732-734.
- 16. IBISWorld. Global hotels and restaurants: G4621-GL global fast food restaurants. Santa Monica, CA: IBISWorld, 2011.
- 17. Young LR, Nestle M. Portion sizes and obesity: responses of fast-food companies. J Public Health Policy 2007; 28: 238-248.
- 18. Food Standards Agency. Salt reduction targets. London: FSA, 2009. http://tna.europarchive.org/20111116080332/http://www.food.gov.uk/scotland/scotnut/salt/saltreduction (accessed Jun 2012).
- 19. Farley T. National Salt Reduction Initiative: frequently asked questions. New York, NY: New York City Department of Health and Mental Hygiene, 2014. http://www.nyc.gov/html/doh/downloads/pdf/cardio/cardio-salt-nsri-faq.pdf (accessed Jan 2014).
- 20. Wyness LA, Butriss JL, Stanner SA. Reducing the population’s sodium intake: the UK Food Standards Agency’s salt reduction programme. Public Health Nutr 2012; 15: 254-261.
- 21. Institute of Medicine Committee on Strategies to Reduce Sodium Intake; Henney JE, Taylor CL, Boon CS, editors. Appendix G. National Salt Reduction Initiative coordinated by the New York City Health Department. In: Strategies to reduce sodium intake in the United States. Washington, DC: The National Academics Press, 2010. http://www.ncbi.nlm.nih.gov/books/NBK50950/ (accessed Feb 2014).
- 22. Sodium Working Group. Sodium Reduction Strategy for Canada. Recommendations of the Sodium Working Group. Ottawa, Ontario: Minister of Health, 2010. http://www.hc-sc.gc.ca/fn-an/alt_formats/pdf/nutrition/sodium/strateg/reduct-strat-eng.pdf (accessed Feb 2014).
- 23. Brownell KD. Thinking forward: the quicksand of appeasing the food industry. PLOS Med 2012; 9: e1001254.
- 24. Dunford EK, Eyles H, Mhurchu CN, et al. Changes in the sodium content of bread in Australia and New Zealand between 2007 and 2010: implications for policy. Med J Aust 2011; 195: 346-349. <MJA full text>
- 25. Food Safety Authority of Ireland. Salt Reduction Programme (SRP) - 2011 to 2012. Dublin: Food Safety Authority of Ireland, 2010. https://www. fsai.ie/uploadedFiles/Science_and_Health/Salt_and_Health/FSAI_SRP_Update_2011-2012.pdf (accessed Feb 2014).
Competing Interests: