


With more than 14 000 newly diagnosed cases and about 4000 deaths each year, bowel cancer, or colorectal cancer, is the second most commonly reported cancer and the second most common cause of cancer-related death in Australia.1 Estimates show that one in 12 Australians are likely to develop bowel cancer before the age of 85 years,2 making Australia highly ranked in bowel cancer incidence by international comparisons.3
Screening for bowel cancer is an attractive and viable option based on the World Health Organization's criteria for a cancer screening program.4 Screening using the faecal occult blood test (FOBT) is well established as an effective way to reduce incidence and mortality of bowel cancer in the general population.5-8 In 1999, the Australian National Health and Medical Research Council (NHMRC) recommended biennial screening with the FOBT for those aged over 50 years.9 The National Bowel Cancer Screening Program (NBCSP), using the immunochemical FOBT (iFOBT), commenced in 2006 but was limited in scope, only offering screening to specific age cohorts (ages 55 and 65 years from 2006 and age 50 years from 2008).10
In the 2012–13 Budget, the Australian Government announced an ongoing commitment to the NBCSP and additional funding to expand the eligibility criteria.11 The funding was used to add 60-year-olds in 2013 and will enable 70-year-olds to be included from 2015. The announcement also indicated the government's intention to further expand the NBCSP to meet NHMRC guidelines, stating that biennial screening would be progressively phased in and achieved by 2034.11 In August 2013, the then shadow health minister, quoting the preliminary findings of this research, announced that under a Coalition government, biennial screening for 50–74-year-olds would be achieved by 2020. The Coalition won the federal election in September 2013 and was expected to act on this commitment. In the 2014–15 Budget, the federal government made an announcement committing to the full implementation of biennial screening for the NBCSP by 2020.
We used microsimulation modelling to estimate the impact and outcome of various expansion scenarios in order to establish the best possible implementation of the NBCSP.
Methods
MISCAN-Colon model
The MISCAN (microsimulation screening analysis)-Colon model and the data sources that inform the quantification of the model are described in Appendix 1. In brief, the model simulates a large population of individuals from birth to death, first without and then with screening for bowel cancer. The simulation of life history modelled several factors, including adenoma prevalence, size and multiplicity; progression of adenoma to cancer; stage at diagnosis; and life expectancy after diagnosis.
The model simulated the Australian population age distribution as at June 201112 and life expectancy observed in 2009.13 The model was calibrated to match age-specific incidence of bowel cancer as observed in Australia before the introduction of the NBCSP in 2006.10 Stage distribution, localisation of cancers in the bowel and 5-year relative survival after clinical diagnosis of a cancer were based on Australian literature.14,15
The validity of the MISCAN-Colon model has been successfully tested on the results of several large screening and surveillance studies.5-7,16-18 The model has also been shown to explain observed incidence and mortality trends in the United States, accounting for risk factor trends, screening practice and chemotherapy.19
Modelling parameters
Scenarios
Screening in the Australian population was simulated over 50 years starting in 2006 (the year the NBCSP commenced), using five scenarios (Box 1). The “Current” scenario modelled the existing screening program, including the addition of 70-year-olds in 2015. The base scenario (“Slow”) was based on a proposed implementation plan set out in the 2012–13 Budget.11 In this scenario, one age cohort was added every 2 years, starting with 70-year-olds in 2015. Subsequent age cohorts, from oldest to youngest, were added every other year. Full implementation was achieved by 2035.
The other scenarios were accelerations of Slow, adding one age cohort (“Annual” scenario) or two age cohorts (“Multiple” scenario) every year. In the fifth scenario (“5-year”), implementation was completed within 5 years, commencing in 2015. Full implementation of all scenarios was defined as being achieved when all those aged 50 to 74 years were invited to screen on a biennial basis. Additional details about the criteria used can be found in Appendix 2.
Follow-up and surveillance
For all scenarios, it was assumed that after a positive iFOBT result, a diagnostic colonoscopy was offered. If no adenomas were found during the colonoscopy, the individual was invited to rescreen with an iFOBT after 5 years.20 Adenomas identified at colonoscopy were removed and the individual entered surveillance according to the NHMRC-approved guidelines.21 It was assumed that surveillance stopped at 75 years of age.
Test characteristics
The test characteristics were adjusted to simulate iFOBT positivity and cancer detection rates observed in the Queensland Bowel Cancer Screening Program between August 2006 and December 2010.22,23 This dataset was chosen because of the unique and comprehensive nature of data collected by the Queensland program. Sensitivity and specificity were chosen so that simulated iFOBT positivity rates and positive predictive values for cancer matched the observed rates to within 0.1%. The sensitivity of the iFOBT for cancer was split to account for the variance in test sensitivity at different time points before clinical diagnosis (shortly before and longer before). Additional assumptions of the MISCAN-Colon model can be found in Box 2.
Participation
In each of the modelled implementation scenarios, those eligible were invited to participate in screening. For all scenarios, age-specific participation rates for uptake of iFOBT screening for the first time and diagnostic colonoscopy following a positive iFOBT result were simulated based on participation rates for July 2008 to June 2011, as reported in the NBCSP monitoring report: phase 210 (Appendix 3). Participation rates for ages between those reported were linearly extrapolated. As rescreening within the NBCSP did not commence until mid 2013, there are no data available on adherence with rescreening in the Australian setting. Therefore, we used data from the United Kingdom on follow-up screening rounds, which suggested that 80% of those who participated in the previous screening round would do so again,24 and 15% of non-participants would take up the next offer to screen. Similarly, attendance at surveillance colonoscopy was assumed to be 80%, based on data from US clinical practice.25
Outcomes
For each scenario, the model estimated the number of bowel cancer deaths prevented and colonoscopies required from 2006 to 2055. We then compared these results with the Current and Slow scenarios. The number of colonoscopies required each year per scenario includes colonoscopies that were a result of both a positive iFOBT result and surveillance colonoscopy. Overall estimates, as well as estimates by calendar year and birth cohort, were calculated. Due to space limitations, we will only present here the results of three scenarios — Current, Slow and 5-year. The results for the other scenarios are available in Appendix 4.
Sensitivity analyses
As there is no target participation rate for the NBCSP, we used the sensitivity analysis to explore the effect of a potential increase in screening participation rates to 60% once full implementation was achieved. This participation rate was chosen because, on balance, it appears to be achievable; both BreastScreen and the National Cervical Screening Program have previously achieved similar rates of participation,1 and bowel cancer screening has the potential to achieve higher rates of participation as the iFOBT is a convenient test that can be easily performed in private.
Results
Bowel cancer deaths prevented
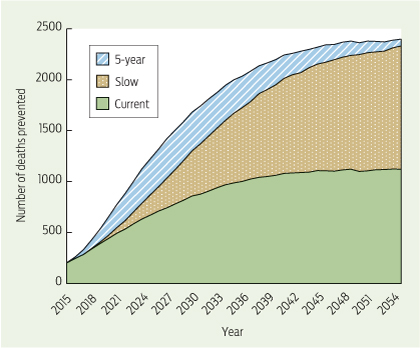
Without expansion, the current NBCSP would prevent 35 169 bowel cancer deaths between 2015 and 2055. Completing implementation by 2035, as per the Slow scenario, would prevent 25 702 extra deaths between 2015 (the first year the scenarios diverge) and 2055 (Box 3; see Appendix 4 for results of all scenarios). Accelerating the implementation, as per the 5-year scenario, with full implementation by 2020, would prevent up to 9167 additional bowel cancer deaths (34 869 more deaths prevented compared with Current), clearly demonstrating that speed of implementation affects the number of deaths prevented.
The annual distribution of deaths prevented when compared with Slow showed that the difference in bowel cancer deaths between the scenarios reached its peak between 2026 and 2031, with almost 400 more deaths prevented in 2026 in the 5-year scenario (Box 4). Although all scenarios simulate biennial screening (age 50–74 years) from 2035 onwards, the number of deaths prevented differs between scenarios until after 2055, with the 5-year scenario preventing the most deaths each year.
To ensure that no birth cohort was disadvantaged by the different scenarios, we conducted a comparison of deaths prevented by year of birth. In all cases, additional deaths were prevented in each birth cohort compared with the Current scenario. This was most notable in the 5-year scenario.
Colonoscopy requirement
The scenarios with a faster implementation also required more colonoscopies (Appendix 4). To prevent the additional 25 702 deaths between the Current and Slow scenarios, 1 943 395 additional colonoscopies (85%) would be required. However, only a further 701 117 colonoscopies (17% more than Slow) would be needed to prevent the additional 9167 deaths in the 5-year scenario. The overall number of colonoscopies required per death prevented is 65 in the Current scenario, 69 in the Slow scenario and 70 in the 5-year scenario, representing a good balance between burden and benefit.
Colonoscopy requirement over time (2015–2055) showed a distinct pattern related to the speed of implementation — the faster the implementation, the greater the increase in requirement. The greatest increase in colonoscopy requirement occurred during the implementation of each scenario. From 2014 to 2015, the absolute increase in colonoscopy requirement was largest, ranging from 6887 for the Current scenario to 16 739 for the 5-year scenario. Over time, the absolute increase in colonoscopy requirement reduced for all scenarios, and at many time points, requirement was less than the previous year. There was a noticeable dip in the Slow scenario in 2022 and 2030, when the 55- and 65-year-old cohorts were removed from the screening program.
Sensitivity analyses
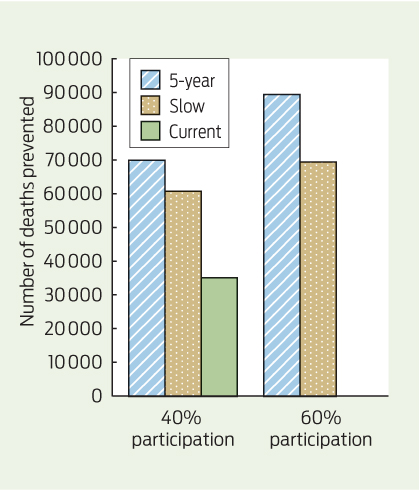
Once full biennial screening was achieved and participation increased to 60%, a substantial increase in deaths prevented was seen in all scenarios. This was most notable for the 5-year scenario, where over 54 000 additional deaths were prevented between 2015 and 2055 compared with Current (Box 5). The number of required colonoscopies also increased for all scenarios; the most notable increase was in the 5-year scenario, where about 4.35 million additional colonoscopies were required over the 40-year modelled period. Results for all scenarios can be found in Appendix 4.
Discussion
Our research clearly shows that the choice of implementation scenario for the NBCSP affects the number of deaths prevented. Based on current participation rates in the NBCSP, the Slow scenario prevents more than 25 000 additional bowel cancer deaths compared with the Current scenario. Accelerating the implementation, as per the 5-year scenario, increases this number by about 40% to 34 869, with close to 100% more bowel cancer deaths prevented than in the Current scenario. This equates to a mean of 872 deaths prevented per year over 40 years (2015–2055), 229 per year more than in the Slow scenario.
The sensitivity analysis highlighted that if, once fully implemented, participation reached 60%, there is potential to prevent an additional 20 000 deaths in the 5-year scenario compared with Slow, equating to about 500 additional deaths prevented per year over the 40-year period.
It is unsurprising that a faster implementation will result in greater numbers of deaths prevented. A strength of our research is that it quantified the impact of different implementation scenarios to establish their effect on deaths prevented. These results are conservative estimates, as they are based on current rates of participation in the NBCSP which, while varying across age cohorts, remain collectively low. While acceptability of the iFOBT has been reported to be as high as 83%,26 low participation may, in part, be due to the lack of communication about the program and the difficulty in communicating a clear message about participation when eligibility is limited.27 The assumed 60% participation in the sensitivity analysis appears optimistic compared with the current rates of participation in bowel cancer screening, but it is not an unrealistic target participation rate.28 The convenience of the iFOBT coupled with the reported high levels of acceptability suggest that the iFOBT has the potential to reach more people, including those in regional and remote Australia. Given the current low participation rates, a well planned, comprehensive and long-term social marketing campaign with support strategies including community and health professional education will be required for the screening program to achieve an optimal level of participation — the importance of which cannot be underestimated.
Colonoscopy requirement also increased with all expansion scenarios (Appendix 4). The calculations underpinning the modelled colonoscopy utilisation rely on national guidelines for screening and colonoscopy utilisation.9,21 However, as these assumptions do not necessarily reflect current practice, it was important to compare the increase in requirement resulting from a fully implemented screening program with current utilisation. Data from the Department of Human Services and Medicare Australia show that current reported colonoscopy utilisation (which is recognised as an underestimate of colonoscopy utilisation29,30) is markedly higher than the modelled required utilisation, even for a program that is fully implemented within 5 years and achieves a participation rate of 60%.29 The NBCSP Quality Working Group reported that some colonoscopy utilisation in Australia is due to its overuse as a primary screening and surveillance tool.30 While this may have some impact on the mortality gains of the program, yield has been shown to be limited.31 A well functioning program should encourage better compliance with NHMRC guidelines for screening and colonoscopic surveillance and, coupled with other appropriate strategies, should free up capacity for an increased number of NBCSP-related procedures, a notion supported by the NBCSP Quality Working Group.30 Recommendations for workforce, service capacity and program quality assurance were beyond the scope of this project but were investigated by the NBCSP Quality Working Group, and several of these recommendations have been or are in the process of being implemented.30
Our research considered the number of deaths prevented by bowel cancer screening and did not take into account disability- or quality-adjusted life-years gained. It is not expected that this would greatly influence the results with respect to the speed of implementation.
While we did not investigate the cost-effectiveness of an expedited implementation, there is a strong body of evidence to show that bowel cancer screening is highly cost-effective, and in light of the increasing treatment costs, there is some suggestion that screening might even be cost-saving.14,32,33 This indicates that a faster rollout may actually be desirable from a cost-effectiveness perspective.
Implementing the NBCSP within a 5-year time frame from 2015 is not unrealistic, as both the national breast and cervical cancer screening programs became fully operational within 5 years.34 Moreover, while there is a substantial increase in colonoscopy requirement, within the context of current utilisation, the demand for colonoscopy due to overuse as a primary screening tool will likely decrease.
Our analysis focused on the impact of accelerating the implementation of the NBCSP, comparing the Current situation with the Slow scenario with full implementation by 2035, and with the 5-year scenario with full implementation by 2020. The findings strongly support an expedited implementation of the NBCSP, using the 5-year scenario as the benchmark, to maximise prevention of loss of life from bowel cancer.
1 Modelled implementation scenarios showing the age cohorts added to the National Bowel Cancer Screening Program in each year
Implementation scenario | |||||||||||||||
Year | Current | Slow | Annual | Multiple | 5-year | ||||||||||
2006 | 55, 65 | 55, 65 | 55, 65 | 55, 65 | 55, 65 | ||||||||||
2008 | 50 | 50 | 50 | 50 | 50 | ||||||||||
2013 | 60 | 60 | 60 | 60 | 60 | ||||||||||
2015 | 70 | 70 | 70 | 70 | 70, 72, 74 | ||||||||||
2016 | 64, 68* | ||||||||||||||
2017 | 72, 74 | 72, 74 | 72, 74 | 54, 58† | |||||||||||
2018 | 68 | 64, 68* | 62, 66 | ||||||||||||
2019 | 68 | 64* | 62, 58, 54† | 52, 56‡ | |||||||||||
2020 | 62, 58 | 52, 66 | |||||||||||||
2021 | 68* | 66 | 56‡ | ||||||||||||
2022 | 54† | ||||||||||||||
2023 | 66 | 52 | |||||||||||||
2024 | 56‡ | ||||||||||||||
2025 | 64 | ||||||||||||||
2027 | 62 | ||||||||||||||
2029 | 58† | ||||||||||||||
2031 | 56 | ||||||||||||||
2033 | 54 | ||||||||||||||
2035 | 52‡ | ||||||||||||||
* Final year of screening for 65-year-olds. † Final year of screening for 55-year-olds. ‡ Biennial screening achieved. | |||||||||||||||
2 MISCAN-Colon model assumptions
Sensitivity and specificity of iFOBT* | |||||||||||||||
Specificity (per person) | 95.0% | ||||||||||||||
Sensitivity, diminutive adenomas (1–5 mm) | 0 | ||||||||||||||
Sensitivity, small adenomas (6–9 mm) | 9.0% | ||||||||||||||
Sensitivity, large adenomas (≥ 10 mm) | 32.0% | ||||||||||||||
Sensitivity, cancer long before clinical diagnosis | 36.5% | ||||||||||||||
Sensitivity, cancer shortly before clinical diagnosis | 72.8% | ||||||||||||||
Simulated positivity rates† and positive predictive values‡ of iFOBT (observed values) | |||||||||||||||
Overall iFOBT positivity rate† | 7.7% (7.7%) | ||||||||||||||
Positive results without histopathologically confirmed adenomas or cancer‡ | 47.4% (47.7%) | ||||||||||||||
Positive results with adenomas‡ | 48.2% (48.0%) | ||||||||||||||
Positive results with advanced adenomas‡ | 25.6% (26.0%) | ||||||||||||||
Positive results with confirmed cancer‡ | 4.4% (4.3%) | ||||||||||||||
Sensitivity of colonoscopy | |||||||||||||||
Diminutive adenoma, 1–5 mm | 75.0% | ||||||||||||||
Small adenoma, 6–9 mm | 85.0% | ||||||||||||||
Large adenoma, ≥ 10 mm | 95.0% | ||||||||||||||
Preclinical cancer | 95.0% | ||||||||||||||
Uptake of rescreening | |||||||||||||||
Previously attended | 80.0% | ||||||||||||||
Did not attend previously | 15.0% | ||||||||||||||
Participation rates for follow-up colonoscopy and surveillance | |||||||||||||||
Colonoscopy follow-up after positive iFOBT result | 74.0% | ||||||||||||||
Surveillance | 80.0% | ||||||||||||||
iFOBT = immunochemical faecal occult blood test. MISCAN = microsimulation screening analysis. * Sensitivity in the table constitutes the probability of an individual lesion to bleed and be detected. The overall probability of a positive iFOBT result in a person depends on the person's number and type of lesions and probability of bleeding from other causes than adenomas and cancer. This latter probability is equal to the lack of specificity. † Simulated positivity rate is the percentage of iFOBT results that were positive (ie, blood was detected in the sample). ‡ Positive predictive value is the percentage of positive iFOBT results that have a clinically significant finding (eg, adenoma, advanced adenoma or cancer). | |||||||||||||||
3 Summary of projected major outcomes by modelled implementation scenario, 2015–2055
Implementation scenario | |||||||||||||||
Outcome | Current | Slow | 5-year | ||||||||||||
Total number of deaths prevented | 35 169 | 60 871 | 70 038 | ||||||||||||
Mean number of deaths prevented per year | 879 | 1522 | 1750 | ||||||||||||
Total number of colonoscopies per scenario | 2 275 054 | 4 218 449 | 4 919 566 | ||||||||||||
Number of colonoscopies per death prevented | 65 | 69 | 70 | ||||||||||||
Additional deaths prevented compared with Current | — | 25 702 | 34 869 | ||||||||||||
Mean additional deaths prevented per year compared with Current | — | 643 | 872 | ||||||||||||
Additional colonoscopies compared with Current (% increase) | — | 1 943 395 (85%) | 2 644 512 (116%) | ||||||||||||
Additional deaths prevented compared with Slow | — | — | 9167 | ||||||||||||
Mean additional deaths prevented per year compared with Slow | — | — | 229 | ||||||||||||
Additional colonoscopies compared with Slow (% increase) | — | — | 701 117 (17%) | ||||||||||||
Received 25 November 2013, accepted 26 June 2014
- Dayna R Cenin1
- D James B St John2,3
- Melissa J N Ledger1
- Terry Slevin4
- Iris Lansdorp-Vogelaar5,6
- 1 Education and Research, Cancer Council Western Australia, Perth, WA.
- 2 Cancer Prevention Centre, Cancer Council Victoria, Melbourne, VIC.
- 3 Department of Medicine, University of Melbourne, Melbourne, VIC.
- 4 Cancer Council Western Australia, Perth, WA.
- 5 Department of Public Health, Erasmus MC, University Medical Center Rotterdam, Rotterdam, The Netherlands.
- 6 Centre for Behavioural Research in Cancer Control, Curtin University, Perth, WA.
The Bowel Cancer Education Coordinator position is funded by the Western Australian Department of Health. This publication was partially made possible by grant U01CA152959 from the US National Cancer Institute as part of the Cancer Intervention and Surveillance Modeling Network, which supported a forum for the comparative development of simulation-based decision models. Its contents are solely the responsibility of the authors and do not necessarily represent the official views of the National Cancer Institute.
No relevant disclosures.
- 1. Australian Institute of Health and Welfare. Cancer in Australia 2010: an overview. Canberra: AIHW, 2010. (AIHW Cat. No. CAN 56; Cancer Series No. 60.) http://www.aihw.gov.au/publication-detail/?id=6442472459 (accessed Mar 2012).
- 2. Australian Institute of Health and Welfare. Australian Cancer Incidence and Mortality (ACIM) books: bowel cancer. Canberra: AIHW, 2011. http://www.aihw.gov.au/acim-books (accessed Oct 2012).
- 3. International Agency for Research on Cancer. GLOBOCAN 2012: Colorectal cancer estimated incidence, mortality and prevalence worldwide in 2012. Summary. Lyon: IARC, 2008. http://globocan.iarc.fr (accessed Mar 2013).
- 4. Australian Population Health Development Principal Committee, Screening Subcommittee. Population based screening framework. Canberra: Commonwealth of Australia, 2008. http://www.cancerscreening.gov.au/internet/screening/publishing.nsf/Content/pop-based-screening-fwork/$File/screening-framework.pdf (accessed Mar 2012).
- 5. Hardcastle JD, Chamberlain JO, Robinson MH, et al. Randomised controlled trial of faecal-occult-blood screening for colorectal cancer. Lancet 1996; 348: 1472-1477.
- 6. Kronborg O, Fenger C, Olsen J, et al. Randomised study of screening for colorectal cancer with faecal-occult-blood test. Lancet 1996; 348: 1467-1471.
- 7. Mandel JS, Bond JH, Church TR, et al. Reducing mortality from colorectal cancer by screening for fecal occult blood. Minnesota Colon Cancer Control Study. N Engl J Med 1993; 328: 1365-1371.
- 8. Towler B, Irwig L, Glasziou P, et al. A systematic review of the effects of screening for colorectal cancer using the faecal occult blood test, hemoccult. BMJ 1998; 317: 559-565.
- 9. Australian Cancer Network Colorectal Cancer Guidelines Revision Committee. Guidelines for the prevention, early detection and management of colorectal cancer. Sydney: The Cancer Council Australia and Australian Cancer Network, 2005. http://www.nhmrc.gov.au/guidelines/publications/cp106 (accessed Mar 2012).
- 10. Australian Institute of Health and Welfare. National Bowel Cancer Screening Program monitoring report: phase 2, July 2008 – June 2011. Canberra: AIHW, 2012. (AIHW Cat. No. CAN 61; Cancer Series No. 65.) http://www.aihw.gov.au/publication-detail/?id=10737421408 (accessed Mar 2012).
- 11. Australian Government. Budget 2012-13 Part 2: expense measures. Canberra: Commonwealth of Australia, 2012. http://www.budget.gov.au/2012-13/content/bp2/html/bp2_expense-12.htm (accessed Jun 2012).
- 12. Australian Bureau of Statistics. Australian demographic statistics - table 59. Estimated resident population by single year of age, Australia. Canberra: ABS, 2012. (ABS Cat. No. 3101.0.) http://www.abs.gov.au/AUSSTATS/abs@.nsf/DetailsPage/3101.0Jun%202012?OpenDocument (accessed Oct 2012).
- 13. Australian Bureau of Statistics. Deaths, Australia, 2009. Canberra: ABS, 2012. (ABS Cat. No. 3302.0.) http://abs.gov.au/ausstats/abs@.nsf/Products/381E296AFC292B6CCA2577D60010A095?opendocument (accessed Oct 2012).
- 14. Tran B, Keating CL, Ananda SS, et al. Preliminary analysis of the cost-effectiveness of the National Bowel Cancer Screening Program: demonstrating the potential value of comprehensive real world data. Intern Med J 2012; 42: 794-800.
- 15. Ananda SS, McLaughlin SJ, Chen F, et al. Initial impact of Australia's National Bowel Cancer Screening Program. Med J Aust 2009; 191: 378-381. <MJA full text>
- 16. Lansdorp-Vogelaar I, van Ballegooijen M, Boer R, et al. A novel hypothesis on the sensitivity of the fecal occult blood test: results of a joint analysis of 3 randomized controlled trials. Cancer 2009; 115: 2410-2419.
- 17. Loeve F, Boer R, van Ballegooijen M, et al. Final report MISCAN-COLON microsimulation model for colorectal cancer: report to the National Cancer Institute Project No. NO1-CN55186. Rotterdam: Department of Public Health, Erasmus University, 1998.
- 18. Loeve F, Boer R, Zauber AG, et al. National Polyp Study data: evidence for regression of adenomas. Int J Cancer 2004; 111: 633-639.
- 19. Vogelaar I, van Ballegooijen M, Schrag D, et al. How much can current interventions reduce colorectal cancer mortality in the US? Mortality projections for scenarios of risk-factor modification, screening, and treatment. Cancer 2006; 107: 1624-1633.
- 20. Department of Health and Ageing. National Bowel Cancer Screening Program. Participant screening pathway. Canberra: DoHA, 2013. http://www.cancerscreening.gov.au/internet/screening/publishing.nsf/Content/bw-part-scr-path (accessed Jul 2013).
- 21. Cancer Council Australia Colonoscopy Surveillance Working Party. Clinical practice guidelines for surveillance colonoscopy – in adenoma follow-up; following curative resection of colorectal cancer; and for cancer surveillance in inflammatory bowel disease. Sydney: Cancer Council Australia, 2011. http://www.nhmrc.gov.au/guidelines/publications/ext8 (accessed Oct 2012).
- 22. Appleyard M, Grimpen F, Spucches C, et al. Participation in the national bowel cancer screening program and screening outcomes in Queensland. J Gastroenterol Hepatol 2011; 26 Suppl 4: Abstract 29.
- 23. Queensland Health. Queensland Bowel Cancer Screening Program: statistical report August 2006 – December 2010. Brisbane: Queensland Health, 2011. http://www.health.qld.gov.au/bowelcancer/documents/statreport.pdf (accessed Oct 2012).
- 24. Weller D, Coleman D, Robertson R, et al. The UK colorectal cancer screening pilot: results of the second round of screening in England. Br J Cancer 2007; 97: 1601-1605.
- 25. Colquhoun P, Chen HC, Kim JI, et al. High compliance rates observed for follow up colonoscopy post polypectomy are achievable outside of clinical trials: efficacy of polypectomy is not reduced by low compliance for follow up. Colorectal Dis 2004; 6: 158-161.
- 26. Jalleh G, Donovan RJ, Lin C, et al. Beliefs about bowel cancer among the target group for the National Bowel Cancer Screening Program in Australia. Aust N Z J Public Health 2010; 34: 187-192.
- 27. Olver IN, Young GP. The urgency of saving lives through bowel cancer screening. Med J Aust 2012; 196: 490-491. <MJA full text>
- 28. Victorian Government Department of Human Services. Victoria's Cancer Action Plan 2008-2011. Melbourne: Victorian Government Department of Human Services, 2008. http://docs.health.vic.gov.au/docs/doc/Victorias-Cancer-Action-Plan-2008-2011-complete-document---Dec-2008 (accessed May 2013).
- 29. Department of Human Services, Medicare Australia Statistics. Requested Medicare items processed from January 1994 to June 2013. Canberra: Department of Human Services, 2013. https://www.medicareaustralia.gov.au/cgi-bin/broker.exe?_PROGRAM=sas.mbs_item_standard_report.sas&_SERVICE=default&DRILL=ag&_DEBUG=0&group=32090%2C+32093&VAR=services&STAT=count&RPT_FMT=by+time+period+and+state&PTYPE=calyear&START_DT=199401&END_DT=201306 (accessed Aug 2013).
- 30. National Bowel Cancer Screening Program Quality Working Group. Improving colonoscopy services in Australia. Canberra: Australian Government Department of Health and Ageing, 2009. http://www.cancerscreening.gov.au/internet/screening/publishing.nsf/Content/3FD09B61D2B4E286CA25770B007D1537/$File/Improving%20col%20serv0709.pdf (accessed Apr 2012).
- 31. Ee HC, Olynyk JK. Making sense of differing bowel cancer screening guidelines. Med J Aust 2009; 190: 348-349. <MJA full text>
- 32. Pignone MP, Flitcroft KL, Howard K, et al. Costs and cost-effectiveness of full implementation of a biennial faecal occult blood test screening program for bowel cancer in Australia. Med J Aust 2011; 194: 180-185. <MJA full text>
- 33. Bishop J, Glass P, Tracey E, et al. Health economics review of bowel cancer screening in Australia. Sydney: Cancer Institute NSW, 2008. http://www.cancerinstitute.org.au/publications/i/health-economics-review-of-bowel-cancer-screening-in-australia-august-2008 (accessed Mar 2012).
- 34. Australian Institute of Health and Welfare. Breast and cervical cancer screening in Australia 1996-1997. Canberra: AIHW, 1998. (AIHW Cat. No. CAN 3; Cancer Series No. 8.) http://www.aihw.gov.au/publication-detail/?id=6442466999 (accessed Sep 2013).
Abstract
Objectives: To estimate the impact of various expansion scenarios of the National Bowel Cancer Screening Program (NBCSP) on the number of bowel cancer deaths prevented; and to investigate the impact of the expansion scenarios on colonoscopy demand.
Design: MISCAN-Colon, a well established, validated computer simulation model for bowel cancer screening, was adjusted to reflect the Australian situation. In July 2013, we simulated the effects of screening over a 50-year period, starting in 2006. The model parameters included rates of participation in screening and follow-up, rates of identification of cancerous and precancerous lesions, bowel cancer incidence, mortality and the outcomes of the NBCSP. Five implementation scenarios, based on biennial screening using an immunochemical faecal occult blood test, were developed and modelled. A sensitivity analysis that increased screening participation to 60% was also conducted.
Participants: Australian residents aged 50 to 74 years.
Main outcome measures: Comparison of the impact of five implementation scenarios on the number of bowel cancer deaths prevented and demand for colonoscopy.
Results: MISCAN-Colon calculated that in its current state, the NBCSP should prevent 35 169 bowel cancer deaths in the coming 40 years. Accelerating the expansion of the program to achieve biennial screening by 2020 would prevent more than 70 000 deaths. If complete implementation of biennial screening results in a corresponding increase in participation to 60%, the number of deaths prevented will increase across all scenarios.
Conclusions: The findings strongly support the need for rapid implementation of the NBCSP. Compared with the current situation, achieving biennial screening by 2020 could result in 100% more bowel cancer deaths (about 35 000) being prevented in the coming 40 years.