


In 2008 the number of Australians who died totalled 143 900, and this annual total will increase as the population grows.1 At least half of these people died of conditions from which their deaths were clinically expected and where a palliative-care approach was warranted.2 Yet, surprisingly, little is known about where seriously ill Australians spend their last months of life. Hospital use before death has received little attention,3 and what is known has been motivated by concern about inpatient costs.3,4 In contrast, international perspectives provide some insight, particularly those that note an exponential increase in hospitalisations in the last months or weeks of life.5-7 A recent Canadian study used linked health care data from administrative sources to show that emergency department (ED) use by people dying of cancer may be avoidable in some circumstances.8
Inappropriate use of EDs, as well as numerous or long hospital stays, may be indicative of limitations in community services for some people.7 One study identified a number of potential indicators of poor quality end-of-life cancer care: starting new cancer therapies or continuing ongoing treatments very near death; a high number of ED visits, inpatient hospital admissions, or days in an intensive care unit near the end of life; and a high proportion of patients never enrolled in palliative care services, only admitted in the last few days of life, or dying in an acute-care setting.9 A more recent systematic review based on organisational, patient and family perspectives has endorsed the importance of these indicators.10
“Quality of death” can be enhanced by improving the standards of end-of-life care. This includes providing services to enable people to be cared for and die in the home if that is their wish.11 For this study, we chose a cohort of people who died from conditions considered amenable to palliative care, and contrasted hospital use for those who had cancer and conditions other than cancer. By charting the incidence of hospital and ED use by this cohort over the last 365 days of life, we aimed to estimate the proportion of people with such conditions in relation to their place of care on any given day in their last year of life.
Our cohort comprised people who died in Western Australia between 1 August 2005 and 30 June 2006, had an informal primary carer at the time of death, did not reside in a residential aged care facility, and died of one of 10 conditions identified from the underlying cause(s) of death on the death registrations. Cause of death was established for people for whom the primary diagnosis recorded on the death certificate was a condition considered amenable to palliative care. This included cancer, chronic heart failure, chronic renal failure, chronic liver failure, chronic obstructive pulmonary disease, Alzheimer’s disease, Parkinson’s disease, motor neurone disease/amyotrophic lateral sclerosis, HIV/AIDS and Huntington’s disease.12 Underlying causes of death were grouped according to International Classification of Diseases, 10th revision, Australian modification (ICD-10-AM) codes.
Non-linear regression models were fitted to these data and used to estimate change points. We then compared these non-linear models with separately predicted linear components of the proportion of decedents in hospital. This allowed us to define a change point to be the point at which the linear component of the proportion of decedents in hospital was substantially less than the overall non-linear curve. We used a 5% deviation from the fitted linear component as indication of change. Approximate 95% bootstrap confidence intervals for these change points were calculated based on 1000 bootstrap samples. All statistical analyses were carried out using the R statistical computing language.13
The cohort comprised 1071 people, 63.2% of whom were men. Three-quarters of the cohort (75.8%) lived in the metropolitan area of Perth, WA; their age distribution was one-quarter (25.3%) aged less than 65 years, one-quarter (24.5%) aged 65–75 years and half (50.2%) aged over 75 years. Over two-thirds (746; 69.7%) had died of a cancer condition, and the remainder (325; 30.3%) had died of one of another nine conditions considered amenable to palliative care. Box 1 provides a summary of the demographic characteristics of the cohort by death from cancer and non-cancer conditions.
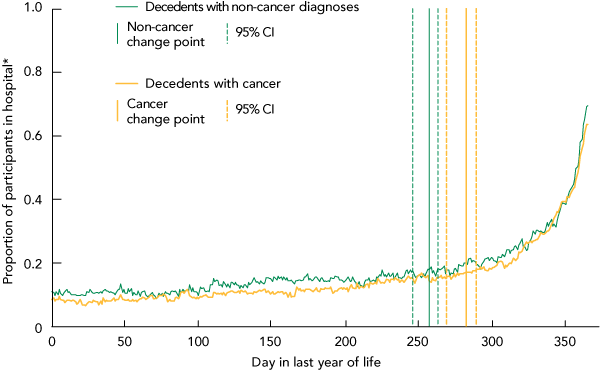
The estimated change point for hospitalisations of decedents who died of cancer was 257 days (95% CI, 246–263) into the last year of life, or 108 days before death (Box 2). The change point for decedents who died of non-cancer diagnoses was 282 days (95% CI, 255–270 days) into the last year of life or 83 days before death (Box 2). The estimated change point for ED visits for all decedents was 311 days (95% CI, 232–339 days) or 54 days before death. The change point for decedents who died of a cancer condition (272 days; 95% CI, 111–329 days; 93 days before death) was earlier than for those who died of a non-cancer condition (326 days; 95% CI, 277–340; 39 days before death).
The data provide a crucial baseline for modelling ways in which care at the end of life can be modified. Total number of bed-days, length of stay for individual admissions and total number of admissions per person are interrelated. Any decrease in any of these will relieve pressure on the hospital system. The number of admissions is of particular importance, given that much of the cost in health care is borne in the initial clinical assessment at the time of admission.14 Reduction in the number of short admissions is likely to have a long-term impact on health resource utilisation.
Differences in the course of different diseases, in part, help to explain the period of time towards the end of life when the increase in the prevalence of hospital admission occurs. People with cancer, on average, do not have as many admissions to hospital as those without cancer. However, the change point at which the proportion of hospital admissions increases is closer to death for those with cancer. The physical debility of people with cancer appears to have a much more precipitous drop, and patients’ families and community services have often not prepared adequately for this eventuality.15,16 Without building extensive support networks over time, care may, by default, move to acute-care hospital inpatient beds.
We intentionally excluded those who lived in a residential aged care facility before death from the study. There is a decrease in the use of hospital beds among older people compared with those of younger ages in the last year of life, which has been partially explained by the threshold for hospital admission being higher for those receiving care in aged care facilities.4 The long-term care sector is likely to absorb some of the economic burden from the hospital sector but only for those residing in residential aged care facilities.
Provenance: Not commissioned; externally peer reviewed.
Received 23 September 2010, accepted 17 February 2011
- Lorna K Rosenwax1
- Beverley A McNamara1
- Kevin Murray2
- Rebecca J McCabe1
- Samar M Aoun3
- David C Currow4
- 1 School of Occupational Therapy and Social Work, Curtin University of Technology, Perth, WA.
- 2 School of Mathematics and Statistics, University of Western Australia, Perth, WA.
- 3 Western Australian Centre for Cancer and Palliative Care, Curtin University of Technology, Perth, WA.
- 4 Flinders University, Adelaide, SA.
This article is based on research funded by the National Health and Medical Research Council to determine indicators for palliative care provision in the life-limiting illness pathway in the last year of life (Grant No. 425554). We acknowledge Linda Kristjanson of Curtin University and Stephen Carmody of Silver Chain Nursing Association for their clinical, ethical and epidemiological advice.
None identified.
- 1. Australian Bureau of Statistics. Deaths, Australia, 2008 Canberra: ABS, 2009. (ABS Cat. No. 3302.0.) http://www.abs.gov.au/ausstats/abs@.nsf/Products/E47083301566CE0DCA 2576780025A2FB?opendocument (accessed Sep 2010).
- 2. Rosenwax L, McNamara B. Who receives specialist palliative care in Western Australia — and who misses out. Palliat Med 2006; 20: 439-445.
- 3. Calver J, Bulsara M, Boldy D. In-patient hospital use in the last years of life: A Western Australian population-based study. Aust N Z J Public Health 2006; 30: 143-146.
- 4. Kardamanidis K, Lim K, da Cunha C, et al. Hospital costs of older people in New South Wales in the last year of life. Med J Aust 2007; 187: 383-386. <MJA full text>
- 5. Mukamel DB, Bajorska A, Temkin-Greener H. Health care services utilization at the end of life in a managed care program integrating acute and long-term care. Med Care 2002; 40: 1136-1148.
- 6. Huang J, Boyd C, Tyldesley S, et al. Time spent in hospital in the last six months of life in patients who died of cancer in Ontario. J Clin Oncol 2002; 20: 1584-1592.
- 7. van den Block L, Deschepper R, Drieskens K, et al. Hospitalisations at the end of life: using a sentinel surveillance network to study hospital use and associated patient, disease and healthcare factors. BMC Health Serv Res 2007; 7: 69.
- 8. Barbera L, Taylor C, Dudgeon D. Why do patients with cancer visit the emergency department near the end of life? CMAJ 2010; 182: 563-568.
- 9. Earle CC, Park ER, Lai B, et al. Identifying potential indicators of the quality of life cancer care from administrative data. J Clin Oncol 2003; 21: 1133-1138.
- 10. Pasman HRW, Brandt HE, Deliens L, et al. Quality indicators for palliative care: a systematic review. J Pain Symptom Manage 2009; 38: 145-156.
- 11. Economist Intelligence Unit. The quality of death: ranking end-of-life care across the world. London: EIU, 2010. http://www.eiu.com/site_info.asp?info_name=qualityofdeath_lienfoundation&page=noads&rf=0 (accessed Apr 2011).
- 12. McNamara B, Rosenwax L. Which carers of family members at the end of life need more support from health services and why? Soc Sci Med 2010; 70: 1035-1041.
- 13. Ihak R, Gentleman R. R: a language for data analysis and graphics. J Computat Graph Stat 1996; 5: 299-314.
- 14. Taheri PA, Butz DA, Greenfield LJ. Length of stay has minimal impact on the cost of hospital admission. J Am Coll Surg 2000; 191: 123-130.
- 15. Lynn J. Serving patients who may die soon and their families: the role of hospices and other services. JAMA 2001; 285: 925-932.
- 16. Lunney J, Lynn J, Foley D, et al. Patterns of functional decline at the end of life. JAMA 2003; 289: 2387-2392.
Abstract
Objectives: To describe hospital and emergency department use in the last year of life by people for whom death from cancer or one of another nine conditions was an expected outcome.
Design, participants and setting: Retrospective cross-sectional study based on death registrations and morbidity data for 1071 Western Australians who died between 1 August 2005 and 30 June 2006. Decedents had an informal primary carer, did not live in residential aged care and died of a condition amenable to palliative care.
Main outcome measures: Total number of hospital admissions; emergency presentations (with and without hospital admission); days spent in hospital by age group at death, sex, metropolitan or rural place of residence and cancer versus non-cancer diagnosis; proportion in hospital on any day in the last 365 days of life; time points of change in the last 365 days of life at which there was an increasing proportion of hospital admissions for those with cancer and non-cancer conditions.
Results: All but 4% of the decedents spent time in hospital with a marked increase in hospitalisations in the last 108 days of life for people who died of cancer and the last 83 days of life for people who died of non-cancer conditions. Those with cancer spent less time in hospital than those with other diagnoses. Seventy per cent of the cohort had at least one emergency presentation. On the last day of life, 61.5% of people were in hospital and 4.0% had been seen in emergency departments.
Conclusions: Western Australian hospitals currently provide extensive and progressively greater care at the end of life. Identifying patterns of emergency and inpatient use for various disease trajectories will assist in the planning of appropriate services for people where death is an expected outcome.