People who attend hospital emergency departments (EDs) frequently have often been described as a vulnerable population with high rates of alcohol and drug use, psychiatric disorders and chronic medical conditions.1-3 This group of patients has, however, been difficult to characterise, as different studies have used different definitions of what constitutes frequent attendance.
One very large probabilistically linked statewide database in Utah in the United States, defined repeat attenders as having two visits in three years and serial attenders four visits in a year.4 A smaller study from a single hospital in Sheffield in the United Kingdom compared the frequency distribution of attenders with a normal distribution and suggested that a frequent user be defined as someone who attends more than four times a year.5 This figure was also used in a large statewide linked-data study in Massachusetts in the US.6
Western Australia’s population was 2.01 million at 30 June 2005, with 1.48 million (73.6%) residing in metropolitan Perth,7 which has seven public and two private hospitals with EDs. The Emergency Care, Hospitalisation and Outcome (ECHO) linked-data project linked all of metropolitan Perth’s emergency care records to hospitalisation and mortality records for the whole state.8 The methods and limitations of this study have previously been described in detail.8
Patients’ emergency and hospital morbidity records were linked by the Western Australian Health Information Linkage Branch using a probabilistic matching process.9 This process identified all emergency-attendance and hospital-admission episodes relating to the same individual, known as a “chain of events”. Emergency records included patient demographic characteristics and clinical data; hospital morbidity records coded data related to hospital admissions.10
We adapted the definition of FA from a previous study’s recommendation that frequent users be defined as those who attend more than four times annually.5 Thus, we coded non-frequent attenders (NFAs) as those who presented to EDs 1–4 times in a year. To allow detailed differentiation of patient characteristics within the FA group, FAs were subcategorised according to their number of ED presentations in a year (5–9, 10–19, 20–29, 30–39 and 40 +). Any patient had the potential to be an FA in any or all of the years of the study.
Box 1 shows the annual breakdown of attendances for NFAs and the five subcategories of FAs. Over the 6.5 years of the study, 25 153 annual chains of events were initiated by 18 396 FAs. On a per-year basis, FAs represented 2.4% (25 153/1 066 496 total chains of events) of attenders to Perth EDs. Of all FAs, 659 presented 20 or more times in any year over the 6.5-year period — an average of 101 patients per year between the nine hospitals. The maximum number of presentations by an individual patient by year was 28 in 2000 (6 months only); 97 in 2001; 76 in 2002; 162 in 2003; 132 in 2004; 196 in 2005; and 218 in 2006.
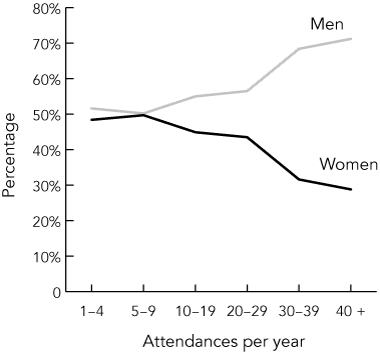
The overall predominance of men among ED attenders increased steadily with increasing number of attendances (P < 0.001), from 51.6% among NFAs to 71.2% among FAs attending 40 + times per year (Box 2). Age also differed significantly (P < 0.001) between NFAs (mean age, 45 years) and FAs (mean age, 49 years), with people in middle age and late-middle age accounting for increasing proportions of frequent attendances as the number of attendances increased, particularly in the 35–44-year and 55–64-year age groups.
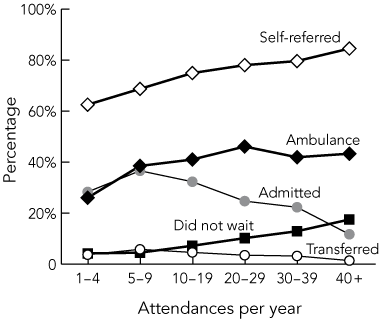
Self-referral increased progressively with increasing frequency of attendance, from 62.5% for NFAs to 84.5% for the 40 + visits per year group (Box 3). The admission rate was 28.3% for NFAs, increasing to 36.6% for FAs making 5–9 visits per year and 32.3% for those making 10–19 visits per year, before falling steadily to 11.7% in the 40 + visits-per-year group. Transfer patterns were similar to admission patterns (Box 3 and Box 4).
In contrast, the proportion of those who did not wait for treatment increased steadily from 4.2% of NFAs through the FA categories to 17.5% of those in the 40 + visits per year group. The rate at which patients discharged themselves at their own risk after initial assessment also increased steadily from 0.4% of NFAs to 3.5% of those in the 40 + visits-per-year group (Box 4).
The percentage of patients arriving by ambulance increased from just over a quarter of NFAs, to peak at 46.1% in the 20–29 attendances-per-year group (Box 3).
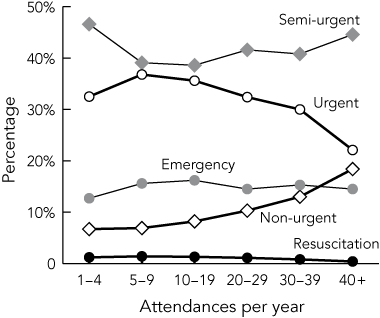
Box 5 shows that patients who attended 5–9 times and 10–19 times in a year were overrepresented in the highest three triage (Australasian Triage Scale [ATS]11) categories — resuscitation (ATS 1), emergency (ATS 2) and urgent (ATS 3) — in comparison to both the NFAs and FAs presenting 20 or more times per year. ATS category 4 (semi-urgent) showed reciprocal changes, with patients who attended 5–9 times and 10–19 times in a year being under-represented, and overrepresentation in ATS 5 (non-urgent) increased progressively as attendance frequency increased.
To our knowledge, our study is the first to explore in detail the changing demographic and other characteristics of people who attend EDs frequently, according to how often they attend. By using a linked-database of all hospitals in a geographically remote capital city, it is likely that we captured virtually all reattendances, even if the patients went to several different EDs. We found that, on a per-year basis, 2.4% of patients presenting to Perth EDs were FAs. This compares with 1% of FAs among patients presenting to EDs in Massachusetts in the US in a similar linked-data study.6
There was a changing spectrum of illness with increasing frequency of attendance. On the one hand, our study substantiates the previously reported preponderance of mental and behavioural disorders,5,12 acute intoxication13 and self-harm among FAs, although we found FAs were more likely to arrive by ambulance.
It may be from EFAs that a common misconception has arisen about FAs being time-consuming “illegitimate” users of ED resources.2 In fact, the great majority of FAs were sicker than other patients and more often required inpatient management. However, the total number of FAs comprised only a small percentage of ED patients, and the workload associated with their attendances was relatively inconsequential compared with the overall work of EDs.
Although EFAs had less urgent conditions and required admission less often, it should not be assumed that these patients are more suited to management in general practice, as their admission rate is still many times greater than that seen from general practice, and nearly half arrive by ambulance. A single hospital study in Melbourne has previously noted that attempting to divert the most frequent ED attenders to general practice may not be successful because of the severity, acuity and casemix of their presentations.12
Box 3 shows a widening disparity between admission rate and the use of ambulance services as the frequency of attendance to EDs increases. While EFAs clearly see their conditions as urgent and requiring hospital management, this is not borne out by their admission rate or the urgency of their conditions. Equally, once these patients arrive, they often do not wait for medical assessment or they self-discharge. The finding that mental health disorders and alcohol-related problems make up a large proportion of the diagnoses for this group raises questions about the extent and value of community-based resources for these people and these conditions. The very frequent use of ambulance services by these EFAs requires further study.
1 Annual number of patient attendances to Perth hospital emergency departments by year, 1 July 2000 to 31 December 2006
2 Percentage of men and women by frequency of attendance to Perth hospital emergency departments, 1 July 2000 to 31 December 2006

3 Selected arrival, admission and departure status by frequency of attendance for patients attending Perth hospital emergency departments from 1 July 2000 to 31 December 2006

Received 16 April 2008, accepted 29 July 2008
- George A Jelinek1
- Moyez Jiwa2
- Nicholas P Gibson1
- Ann-Maree Lynch1,3
- 1 Discipline of Emergency Medicine, University of Western Australia, Perth, WA.
- 2 Curtin Health Innovation Research Institute, Curtin University, Perth, WA.
- 3 Western Australian Poisons Information Centre, Sir Charles Gairdner Hospital, Perth, WA.
The Frequent Attenders at Emergency Departments (FATED) study was funded by the Ada Bartholomew Medical Research Trust. We acknowledge the contribution to the ECHO project provided by the Directors of Emergency Medicine of the nine Perth hospitals involved in the study, and thank the medical staff who entered information into EDIS.
None identified.
- 1. Byrne M, Murphy AW, Plunkett PK, et al. Frequent attenders to an emergency department: a study of primary health care use, medical profile, and psychosocial characteristics. Ann Emerg Med 2003; 41: 309-318.
- 2. Fulde GWO, Duffy M. Emergency department frequent flyers: unnecessary load or a lifeline? [editorial]. Med J Aust 2006; 184: 595. <MJA full text>
- 3. Phillips GA, Brophy DS, Weiland TJ, et al. The effect of multidisciplinary case management on selected outcomes for frequent attenders at an emergency department. Med J Aust 2006; 184: 602-606. <MJA full text>
- 4. Cook LJ, Knight S, Junkins EP Jr, et al. Repeat patients to the emergency department in a statewide database. Acad Emerg Med 2004; 11: 256-263.
- 5. Locker TE, Baston S, Mason SM, et al. Defining frequent use of an urban emergency department. Emerg Med J 2007; 24: 398-401.
- 6. Fuda KK, Immekus R. Frequent users of Massachusetts emergency departments: a statewide analysis. Ann Emerg Med 2006; 48: 9-16.
- 7. Australian Bureau of Statistics. Population by age and sex, Western Australia — Electronic Delivery, Jun 2005. Canberra: ABS, 2005. (ABS Cat. No. 3235.5.55.001.) http://www.abs.gov.au/AUSSTATS/abs@.nsf/Lookup/3235.5.55.001Main+Features1Jun%202005?OpenDocument (accessed Oct 2008).
- 8. Sprivulis P, Da Silva JA, Jacobs I, et al. ECHO: the Western Australian emergency care hospitalisation and outcome linked data project. Aust N Z J Public Health 2006; 30: 123-127.
- 9. Jaro MA. Probabilistic linkage of large public health data files. Stat Med 1995; 14: 491-498.
- 10. Holman CD, Bass AJ, Rouse IL, et al. Population-based linkage of health records in Western Australia: development of a health services research linked database. Aust N Z J Public Health 1999; 23: 453-459.
- 11. Australasian College for Emergency Medicine. Policy document — the Australasian triage scale. Melbourne: ACEM, 2000.
- 12. Dent AW, Phillips GA, Chenhall AJ, et al. The heaviest repeat users of an inner city emergency department are not general practice patients. Emerg Med (Fremantle) 2003; 15: 322-329.
- 13. Mandelberg JH, Kuhn RE, Kohn MA. Epidemiologic analysis of an urban, public emergency department’s frequent users. Acad Emerg Med 2000; 7: 637-646.


Abstract
Objectives: To examine the characteristics of adult patient attendances to emergency departments (EDs) in Perth hospitals by patients’ frequency of attendance.
Design, setting and participants: A linked-data population study of adults (aged ≥ 15 years) attending all nine Perth hospital EDs between 1 July 2000 and 31 December 2006.
Main outcome measures: Proportion of frequent attenders (FAs; those attending five or more times annually); and demographic characteristics, mode of arrival at the ED, disposition (admission, transfer, discharge or death), urgency and clinical conditions by frequency of attendance.
Results: There was a mean of 1.5 attendances per individual per year, resulting in 1 583 924 attendances by 663 309 individuals over the 6.5 years of the study. Most patients (97.6%) attended Perth EDs fewer than five times a year. The more frequently patients attended, the more likely they were to be male, middle-aged and late-middle-aged, have self-referred, have mental and behavioural disorders and alcohol intoxication, to not wait to be assessed, and to arrive by ambulance. The groups of patients attending between 5–9 and 10–19 times per year (97.4% of FAs) had more urgent conditions, more circulatory system disease and higher admission rates than all other patients.
Conclusion: Most FAs at Perth EDs present fewer than 20 times a year and have more serious and urgent illness than other patients, more often requiring inpatient services. A very small minority of patients (around 100 patients/year) attends 20 or more times a year, many with mental and behavioural disorders and alcohol intoxication not requiring hospital admission.