


The known: Patient‐centred medical home care models may improve care quality and outcomes for people with chronic conditions.
The new: The Health Care Homes intervention, which included shared care planning for people with chronic conditions at the general practices with which they were enrolled and bundled care payments for the participating practices, improved access to care and processes of care, but not diabetes outcomes, most measures of hospital use, or mortality.
The implications: Evaluations of future patient‐centred primary care initiatives should be larger scale randomised controlled studies of longer duration, with more efficient linking of primary care records and administrative datasets.
In Australia, 30% of people aged 45–64 years and 50% of those aged 65 years or older have two or more chronic medical conditions.1 Several initiatives for managing chronic disease have been introduced in Australia,2 but most had single disease frameworks.3 Greater recognition of the impact of living with multiple chronic conditions4 has led, both locally5,6 and overseas,7,8,9 to strong support for patient‐centred medical homes in primary care, characterised by shared decision making, comprehensiveness, coordination, accessibility, quality, and safety.7,10
A major primary care initiative — Health Care Homes (HCH) — was trialled in Australia during 1 October 2017 – 30 June 2021. A total of 11 334 people in the ten participating primary health networks were enrolled by the final enrolment date (30 June 2019). The model built on lessons learned during earlier Australian primary care initiatives and insights from patient‐centred medical home models in the United States9,11,12,13 and New Zealand.8 Key features of HCH included voluntary patient enrolment with general practices (“health care homes”), clinical complexity stratification, complexity tier‐specific per capita bundled payments, and support for shared care. Bundled payments replaced Medicare fees for individual services for all care provided by general practices related to chronic conditions, including care planning, review, and coordination.14
A comprehensive mixed methods evaluation of the HCH trial assessed its implementation, changes in how primary care practices managed people with chronic diseases, quality of care, and its financial effects.14 In this article, we report the impact of the HCH primary health care initiative on quality of care and patient outcomes.
Methods
We undertook a quasi‐experimental, matched cohort study. Practice registration for the HCH trial — 227 practices (165 of which ultimately enrolled patients), including 32 Aboriginal Medical Services and Aboriginal Community Controlled Health Services, in ten primary health networks following expressions of interest in late 2016 (Adelaide, Country South Australia, South Eastern Melbourne, Brisbane North, Hunter New England and Central Coast, Nepean Blue Mountains, Western Sydney, Northern Territory, Perth North, and Tasmania) — and the enrolment of patients of any age who attended participating HCH practices commenced on 1 October 2017. People were eligible for enrolment and were invited to do so if they had a Medicare card, did not reside in an aged care facility, were not enrolled in the Department of Veterans’ Affairs Coordinated Veterans’ Care Program, and were at high risk of hospitalisation (assessed with an electronic risk stratification tool).14,15 People who consented to participation in the HCH trial were assigned to one of the three risk tiers that determined the annual bundled payment to their HCH practice (tier 1, $591; tier 2, $1267; tier 3, $1795). The participating medical practitioners determined how to best provide evidence‐based chronic disease management. Enrolled patients and carers (when appropriate) were involved in the development and review of individualised shared care plans, including end‐of‐life advance care directives (if applicable), and were provided enhanced access to team‐based care. Enrolled patients were encouraged to attend their HCH practice for all care related to their chronic conditions.
People in the comparison group (15 years or older who attended general practices not participating in the HCH [practice data extracts] or 16 years or older who resided in the catchment areas of the ten primary health networks [linked administrative data]) received usual medical care. The age restrictions for the comparison group were related to data governance of the MedicineInsight program (source of the non‐HCH practice data extracts) and the ethics approval for the administrative data linkage.
Data sources
For our first analysis, patient data were extracted from general practice electronic medical records. For people in the HCH group, data for the 24 months preceding practice registration, and from registration until 30 June 2021 or the end of practice trial participation, were extracted by third party data analysis companies (Pen CS [https://www.pencs.com.au/products/cat4] or Population Level Analysis and Reporting [POLAR; https://polargp.org.au/polar‐gp/general‐practice]), or were directly provided by the head offices of corporate practices. Practice data extracts for people in the usual care group were obtained from 403 non‐HCH practices participating in the NPS MedicineWise MedicineInsight program16 (Supporting Information, part 1).
For our second analysis, the Australian Institute of Health and Welfare Data Integration Services Centre linked the HCH enrolment database with records of hospital admissions, emergency department presentations, Medicare Benefits Schedule (MBS) and Pharmaceutical Benefits Scheme (PBS) claims, aged care services, and deaths for all people in the HCH group, as well as for all usual care patients in the Adelaide, Country South Australia, and South Eastern Melbourne primary health networks and a random sample of 100 000 people from each of the other seven primary health networks (further details: Supporting Information, part 1).
Study outcomes
We assessed access to care (ie, medical service use), processes of care, clinical outcomes for people with diabetes, and hospital service use during the first and second twelve month periods after enrolment. As the bundled payment replaced Medicare payments for general practitioner consultations for chronic disease management of people in the HCH group, we derived the number of encounters with general practitioners (within the practice, any mode of consultation) from practice data extracts, and the number of claims for specialist, allied health, pathology, and imaging services from MBS data. The processes of care we assessed were vaccination against influenza, and assessments of blood pressure, blood lipids, glycated haemoglobin (HbA1c), and (for people with type 2 diabetes or cardiovascular disease) kidney function. We calculated the proportion of people with type 2 diabetes with HbA1c levels of 53 mmol/mol (7%) or less, systolic blood pressure of 130 mmHg or less, and diastolic blood pressure of 80 mmHg or less at the end of the first and second twelve‐month periods after enrolment. Hospital service use assessed included emergency department presentations, emergency hospital admissions, potentially preventable hospitalisations, and cumulative total hospital stay bed‐days (any reason). We estimated mortality to 30 June 2021 (Supporting Information, part 2).
Statistical analysis
We used propensity score matching to adjust for underlying differences between people in the HCH and usual care groups, separately for the practice data extract and linked data analyses (Box 1). Propensity scores were calculated in logistic regression models, with HCH enrolment status as the dependent variable and patient characteristics as explanatory variables. For both practice data extracts and linked data, matching variables included age, sex, and beneficiary status (ie, whether participants received age pensions or held veterans’ or concessional health care cards). For practice data extracts, additional matching variables were Indigenous status, remoteness (Australian Statistical Geography Standard 201617) and socio‐economic disadvantage status (Index of Relative Socioeconomic Disadvantage18) by practice location, chronic health conditions, medication use, general practitioner encounters, influenza vaccinations, and recorded blood pressure, lipid, HbA1c, and kidney function assessments. For linked data, additional matching variables were geographic remoteness and socio‐economic disadvantage by residential postcode, medical conditions identified as hospital diagnoses or on the basis of dispensed medicines, the number of MBS claims for general practitioner, specialist, allied health, pathology, and imaging services, continuity of care with the usual general practitioner,19 and number of unique medicines dispensed; the number of emergency department presentations, the number of emergency and potentially preventable hospitalisations, and total length of stay in hospital (as hospital bed‐days) were also assessed for the eight New South Wales, Victoria, Queensland, South Australia, and Tasmania primary health networks (further details: Supporting Information, table 4).
Data for the matching variables were derived from episodes of care during the twelve months preceding patient enrolment. For the HCH group, the date of enrolment was ascertained in practice data extracts or the linked HCH enrolment database. For the usual care group, the first day of each calendar month during the enrolment period (1 October 2017 – 30 June 2019) was used for enrolment dates. People in the HCH and usual care groups were matched according to year and month of enrolment and propensity score (greedy algorithm, calliper 0.25, 1:1 ratio) without replacement. Absolute standardised differences smaller than 0.1 were deemed to indicate balance in the characteristics between the two matched groups (Supporting Information, part 3).
We compared outcomes for the HCH and usual care groups during the first and second twelve‐month periods following enrolment. We excluded people from analyses for whom follow‐up data were not available for the complete follow‐up period (usually because practices had withdrawn from the trial). We summarise data as counts and proportions, or as means with standard deviations (SDs). For continuous outcomes we report rate ratios with 95% confidence intervals (CIs) (negative binomial regression); for binary outcomes we report relative risks with 95% CIs (log‐binomial regression). Hazard ratios for mortality to 30 June 2021 were estimated (with 95% CIs) in a Cox proportional hazards model. All analyses were conducted in SAS 9.4; P < 0.05 was deemed statistically significant. We report our study in accordance with the Strengthening the Reporting of Observational Studies in Epidemiology guidelines.20
Ethics approval
The federal Department of Health Human Research Ethics Committee (project 04‐2017) and the Australian Institute of Health and Welfare Human Research Ethics Committee (EO2017/5/421) approved the HCH trial evaluation.
Results
By 30 June 2019, 11 334 patients had been enrolled by 165 HCH practices. Twelve‐month follow‐up practice extract data were available for 9433 people (96.1%), twenty‐four month follow‐up practice extract data for 9080 (92.2%). Twelve‐month follow‐up linked data were available for 10 454 people (97.9%), twenty‐four month follow‐up linked data for 10 196 (95.4%).
Practice data extracts were obtained for 10 174 HCH patients (all ages) and 3.5 million usual care patients (15 years or older). After exclusions and propensity score matching, the HCH and comparison cohorts each included 9811 people (Box 1).
Linkage to administrative datasets was completed for 11 334 HCH patients (all ages) and 3.4 million usual care patients (16 years or older). After exclusions and propensity score matching, the HCH and comparison cohorts each included 10 682 people (Box 1).
The mean age of people in the HCH group at enrolment was 62.8 years (SD, 16.9 years), 5332 were women (54.3%), 1379 were Aboriginal or Torres Strait Islander people (14.1%), and 6342 received age pensions or held veterans’ or concessional health care cards (64.6%). The mean number of chronic diseases was 2.8 (SD, 1.9); cardiovascular disorders (6479 people, 66.0%), osteoarthritis or osteoporosis (3207, 32.7%), diabetes (3065, 31.2%), mental health disorders (2746, 28.0%), and respiratory conditions (2521, 25.7%) were the most frequent. The pre‐enrolment characteristics of the matched usual care patients were similar (Box 2; Supporting Information, table 5).
Access to care (practice data extracts, linked administrative data)
The mean number of general practitioner encounters was higher for people in the HCH group than the usual care group during both the first (13.7 [SD, 10.3] v 12.0 [SD, 10.2]; rate ratio, 1.14; 95% CI, 1.11–1.17) and the second years of enrolment (13.7 [SD, 12.5] v 11.5 [SD, 10.7]; rate ratio, 1.19; 95% CI, 1.16–1.23). The mean number of MBS claims for allied health services was also higher for the HCH group than the usual care group during the first (2.3 [SD, 2.8] v 1.8 [SD, 2.7]; rate ratio, 1.28; 95% CI, 1.24–1.33) and second years of enrolment (1.9 [SD, 2.5] v 1.6 [SD, 2.4]; rate ratio, 1.17; 95% CI, 1.13–1.22). There were no marked differences between the two groups in the numbers of MBS claims for specialist or imaging services (Box 3).
Processes of care (practice data extracts)
Annual influenza vaccinations were more likely for people in the HCH group than the usual care group during the first (relative risk, 1.20; 95% CI, 1.17–1.22) and second years of enrolment (relative risk, 1.19; 95% CI, 1.16–1.22). Blood pressure was more likely to have been recorded for people in the HCH group than in the usual care group during the first year of enrolment (relative risk, 1.09; 95% CI, 1.08–1.11), as were assessments of lipids (relative risk, 1.19; 95% CI, 1.16–1.21) and HbA1c (relative risk, 1.06; 95% CI, 1.03–1.08), and kidney function assessment in people with diabetes or cardiovascular disease (relative risk, 1.13; 95% CI, 1.11–1.15). The relative risks for each outcome were similar during the second year (Box 4).
Clinical outcomes for people with diabetes (practice data extracts)
A larger proportion of people with diabetes in the HCH group (1049 of 2520 people with measurements, 41.6%) than in the usual care group (890 of 2308, 38.6%) had blood pressure levels of 130/80 mmHg or less in the first year (relative risk, 1.08; 95% CI, 1.01–1.16); the difference in the second year was not statistically significant (relative risk, 1.02; 95% CI, 0.94–1.10). Similarly, differences in achievement of HbA1c levels of 53 mmol/mol or less were not significant in either year (first year: relative risk, 1.02; 95% CI, 0.97–1.07; second year: relative risk, 0.96; 95% CI, 0.91–1.02) (Box 4).
Hospital service use (linked administrative data; excludes Perth North, Northern Territory)
During the pre‐enrolment period, 2543 of 9120 people in the HCH group (27.9%) and 2605 in the usual care group (28.6%) had presented to emergency departments (mean, 0.56 [SD, 1.47] v 0.54 [SD, 1.35] presentations); emergency hospitalisations were recorded for 1665 people in the HCH group (18.3%) and 1664 in the usual care group (18.3%) (mean, 0.31 [SD, 0.91] v 0.29 [SD, 0.78] hospitalisations); and potentially preventable hospitalisations were recorded for 500 in the HCH group (5.5%) and 425 in the usual care group (4.7%) (mean, 0.08 [SD, 0.36] v 0.07 [SD, 0.33] hospitalisations). The mean cumulative number of hospital bed‐days (any reason) was 2.2 (SD, 9.1) for people in the HCH group and 2.1 (SD 8.2) in the usual care group. The proportions of people with these outcomes did not change during the first and second years after enrolment in either group; differences between the two groups were not statistically significant, except for emergency department presentations and emergency admissions during the first year, but even these differences were small (Supporting Information, table 7).
Mortality (linked administrative data)
By 30 June 2021, 689 people in the HCH group (6.5%) and 646 in the usual care group (6.1%) had died (hazard ratio, 1.07; 95% CI, 0.96–1.20); the mean time to death from enrolment was 17.2 months (SD, 9.9 months) for the HCH group and 17.1 months (SD, 9.9 months) for the usual care group.
Discussion
In our quasi‐experimental matched cohort study, we found that the HCH intervention improved access to general practitioner and allied health services and processes of care for people with chronic diseases, but not clinical outcomes for those with diabetes, most measures of hospital service use, or risk of death.
Patient‐centred medical homes programs in the United States have been reported to improve process measures of quality of care, improve HbA1c and blood pressure levels, and reduce the numbers of emergency department visits and hospital admissions.9,11,12,13 However, the models evaluated and the quality of the evidence and methodology varied considerably. The advantages associated with patient‐centred medical homes in other countries may not be readily translatable to Australia because of implementation difficulties related to differences in the structure of the health care system, health care funding, and care delivery.
In Australia, information about the effectiveness of patient‐centred models of care is sparse. The evaluation of the New South Wales Health Chronic Disease Management Program (care coordination and health coaching for people admitted to hospital or who had visited an emergency department because of a chronic disease)21 found no effect on mortality or non‐avoidable hospitalisations, but more avoidable hospital admissions over two years of follow‐up. These findings were tentatively ascribed to greater identification of unmet needs in the intervention group.21 The Flinders Quality Enhanced general practice Services Trial,22 a pragmatic cluster randomised controlled trial in which people enrolled with a preferred general practitioner and received longer consultations and timely follow‐up, similarly found no effects on emergency department presentations and hospitalisations during the twelve‐month follow‐up, but did find that patient‐reported quality of life improved to a greater extent than in the usual care control group. The follow‐up periods in these studies may have been too short to detect changes in the trajectories of chronic illness and the outcomes assessed.
Limitations
The improved processes of care for people in the HCH group could reflect changes in care related to improved quality of practice data (eg, six‐monthly reports to HCH practices on processes of care measures).14 The coronavirus disease 2019 (COVID‐19) pandemic may have affected the regularity of processes of care, but this would have applied to a similar degree in HCH and usual care practices. Despite adjustment for differences in patient demographic and health‐related characteristics, the influence of other factors cannot be excluded, such as the motivation level of providers and patients, and the health literacy of patients. About 45% of HCH practices estimated that 81–100% of people invited enrolled, and a further 20% of HCH practices reported 61–80% enrolment.23 However, information on differences between those who did and did not enrol was not available to us. Practice data extracts accurately reflect the data in the source electronic medical records,24 but the completeness and validity of these data may differ between practices, and we found data harmonisation a problem. Further, the practice data extracts and linked data were not integrated into a single dataset, precluding the inclusion of all variables for propensity score matching and assessment of the relationships between measures of primary care and other health outcomes at the individual level. Finally, the short follow‐up period limited the ability to detect the longer term effects of improved access to care and processes of care on health outcomes.
Conclusion
The HCH initiative was associated with greater access to care and improved processes of care for people with chronic diseases, but not changes in diabetes‐related outcomes, most measures of hospital services use, or risk of death. Its impact was limited by lower than expected enrolment of both patients and practices, variations between practices in implementation, and the short trial period.14 Patient‐centred primary care is one of three reform streams outlined in Australia's Primary Health Care 10 Year Plan 2022–2032.25 Evaluations of future patient‐centred primary care initiatives should be larger scale randomised controlled studies of longer duration, with more efficient linkage of primary care records and administrative datasets.
Box 1 – Propensity score matching of the two cohort pairs for assessing quality of care and patient outcomes in the Health Care Homes (HCH) trial
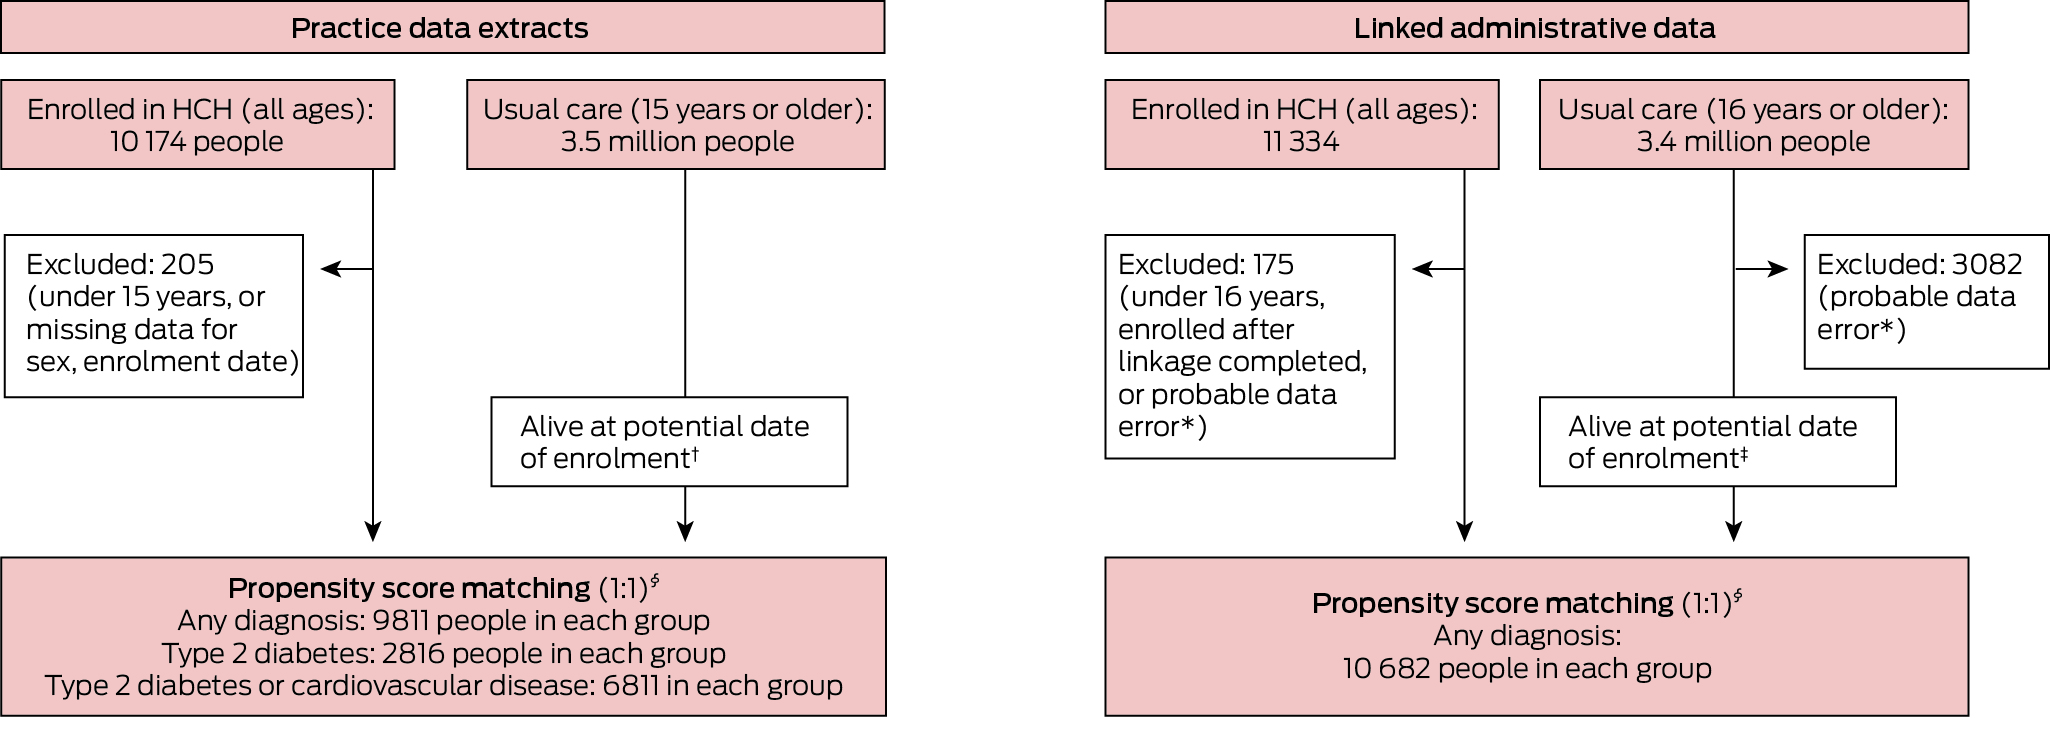
* Recorded date of health service use was later than recorded date of death.† Year of death was later than year of enrolment or not recorded.‡ Date of death was later than date of enrolment or no record of death.§ Matched by propensity score and year and month of enrolment.
Box 2 – Pre‐enrolment demographic and clinical characteristics of Health Care Homes and matched usual care cohorts, derived from practice data extracts
|
Characteristic |
Health Care Homes |
Usual care* |
Absolute standardised difference |
||||||||||||
|
|
|||||||||||||||
|
Number of people |
9811 |
9811 |
|
||||||||||||
|
Sex (women) |
5332 (54.3%) |
5262 (53.6%) |
0.01 |
||||||||||||
|
Age (years), mean (SD) |
62.8 (16.9) |
63.6 (16.9) |
0.05 |
||||||||||||
|
Aboriginal and Torres Strait Islander people |
1379 (14.1%) |
1316 (13.4%) |
0.02 |
||||||||||||
|
Pension, health care card, Department of Veterans’ Affairs beneficiary |
6342 (64.6%) |
6638 (67.7%) |
0.06 |
||||||||||||
|
Chronic diseases, mean number (SD)† |
2.8 (1.9) |
2.8 (1.9) |
0.00 |
||||||||||||
|
Cardiovascular disease |
6479 (66.0%) |
6589 (67.2%) |
0.02 |
||||||||||||
|
Osteoarthritis/osteoporosis |
3207 (32.7%) |
3268 (33.3%) |
0.01 |
||||||||||||
|
Diabetes |
3065 (31.2%) |
3068 (31.3%) |
0.00 |
||||||||||||
|
Mental health disorders |
2746 (28.0%) |
2796 (28.5%) |
0.01 |
||||||||||||
|
Respiratory disorders |
2521 (25.7%) |
2408 (24.5%) |
0.03 |
||||||||||||
|
Cancer |
1232 (12.6%) |
1234 (12.6%) |
0.00 |
||||||||||||
|
Chronic renal disease |
1165 (11.9%) |
1056 (10.8%) |
0.04 |
||||||||||||
|
Dementia |
175 (1.8%) |
194 (2.0%) |
0.01 |
||||||||||||
|
Medicines used in preceding twelve months, by condition |
|
|
|
||||||||||||
|
Cardiovascular disease |
3444 (35.1%) |
3408 (34.7%) |
0.01 |
||||||||||||
|
Nervous system disorders |
3210 (32.7%) |
3272 (33.4%) |
0.01 |
||||||||||||
|
Respiratory disorders |
1843 (18.8%) |
1816 (18.5%) |
0.01 |
||||||||||||
|
Diabetes |
1573 (16.0%) |
1502 (15.3%) |
0.02 |
||||||||||||
|
Blood clots |
1283 (13.1%) |
1259 (12.8%) |
0.01 |
||||||||||||
|
|
|||||||||||||||
|
SD = standard deviation. * Usual care group patients were matched with Health Care Homes group patients (1:1) on the basis of propensity score and year and month of enrolment. † Nineteen conditions assessed related to cardiovascular disease (atrial fibrillation, coronary heart disease, heart failure, stroke, hypertension, hyperlipidaemia), osteoarthritis/osteoporosis, diabetes (type 1 diabetes, type 2 diabetes), mental health disorders (anxiety, depression, bipolar disorder, schizophrenia), respiratory disorders (asthma, chronic obstructive pulmonary disease), cancer, chronic kidney disease, and dementia. |
|||||||||||||||
Box 3 – Access to care (medical service use) by patients in the matched Health Care Homes (HCH) and usual care cohorts prior to enrolment and during first and second years after enrolment of HCH patients
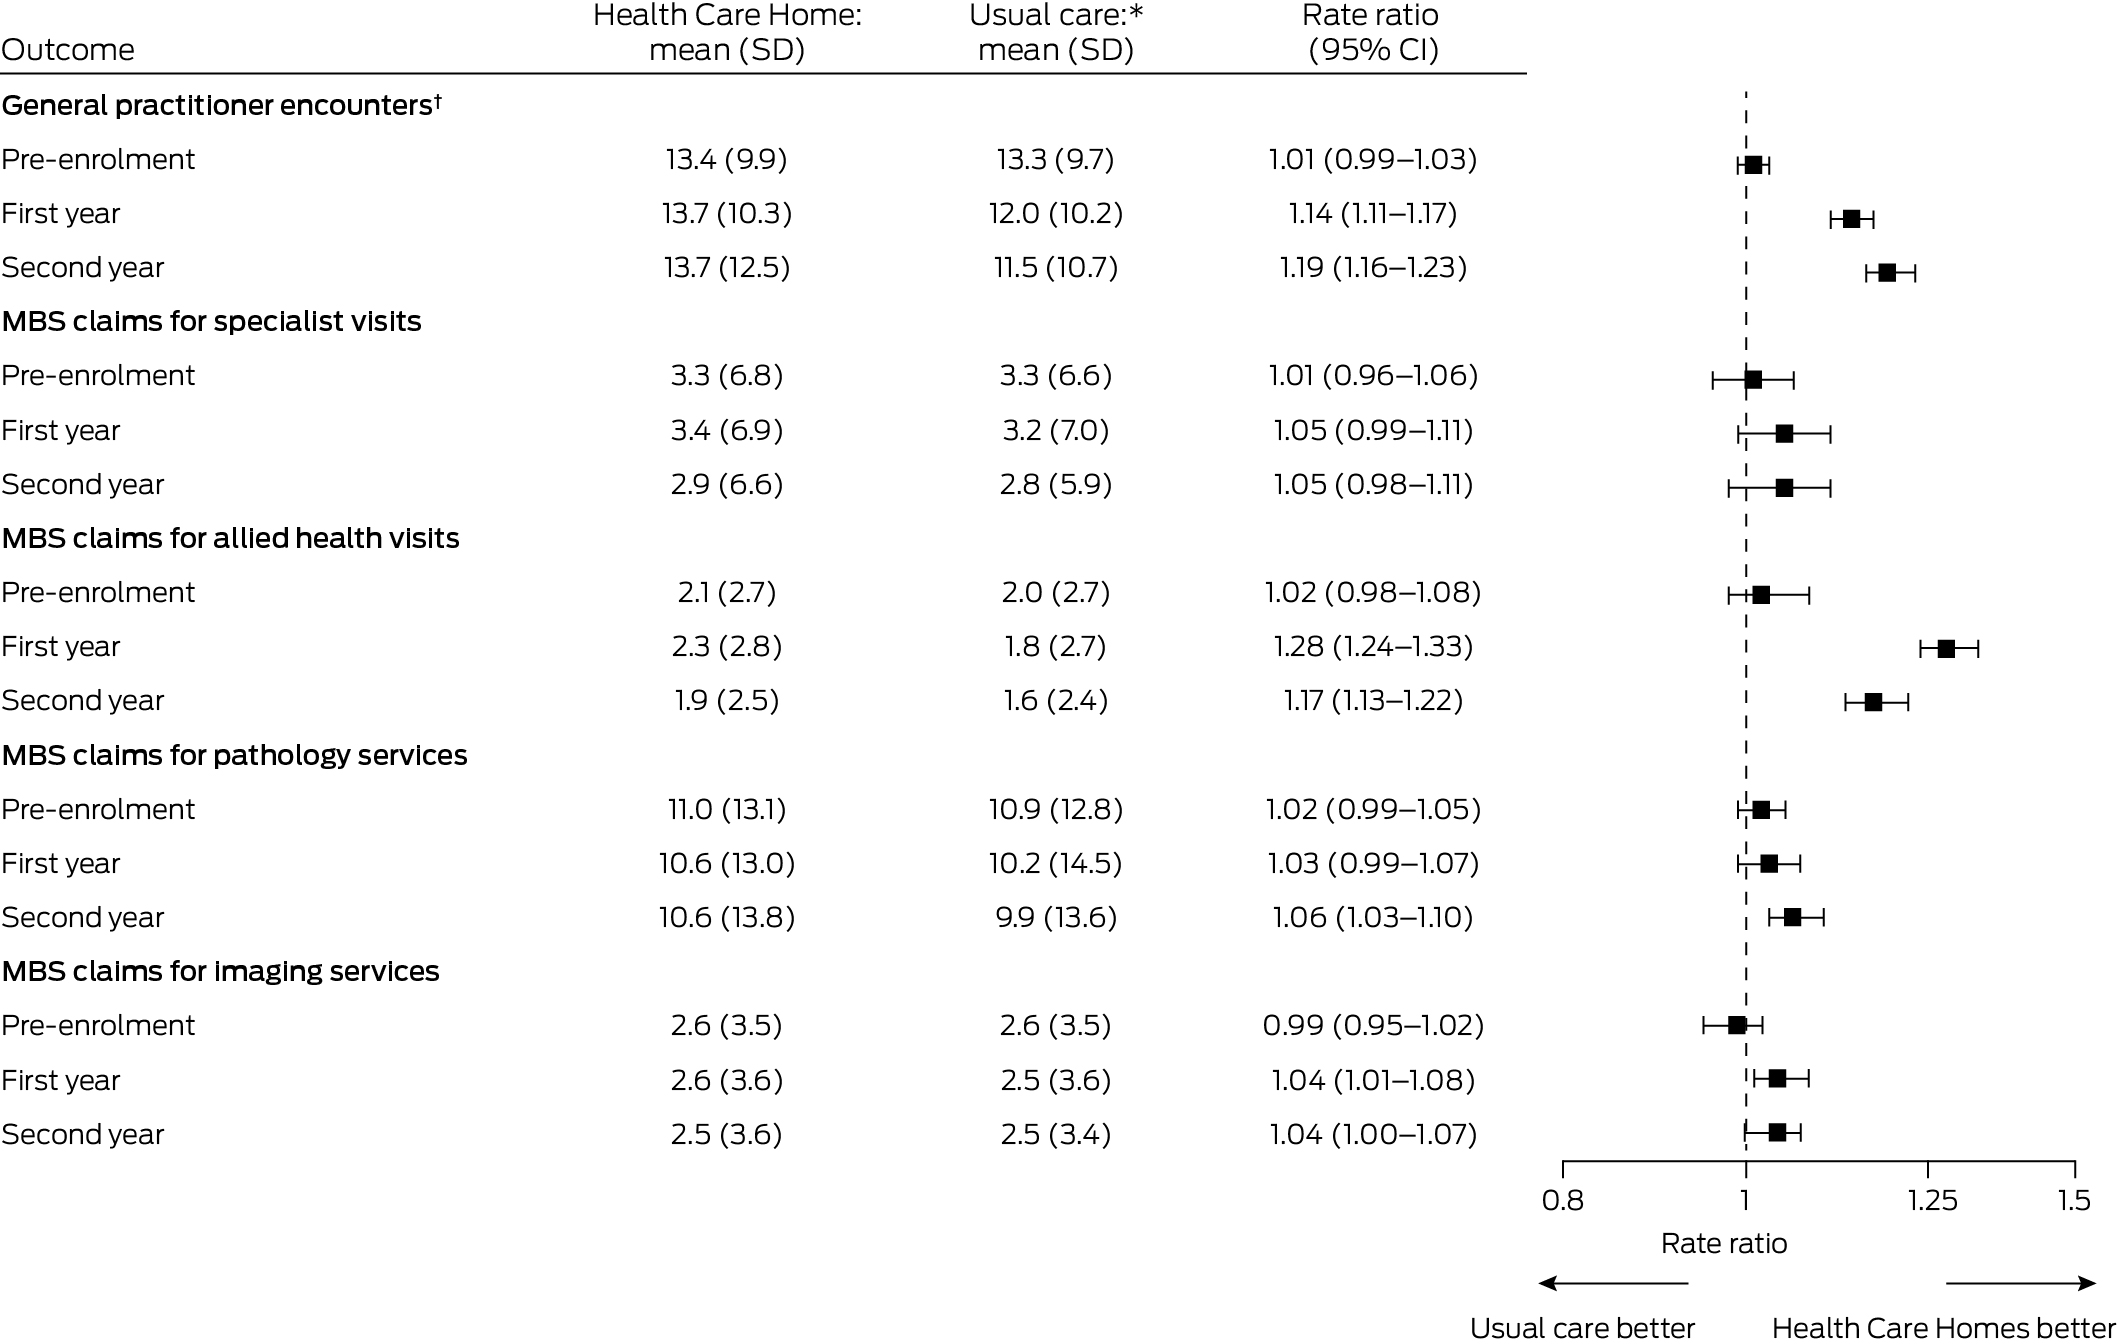
CI = confidence interval; SD = standard deviation.* Health Care Homes and usual care patients were matched (1:1) according to propensity score and year and month of enrolment; those with length of follow‐up less than one or two years were excluded from the respective comparison. For general practitioner encounters, each group included 8322 people for the pre‐enrolment period, 7950 people for the first year after enrolment, and 7705 people for the second year after enrolment. For MBS claims for specialist visits, allied health visits, pathology services, and imaging services, each group included 10 682 people for the pre‐enrolment period, 10 454 for the first year after enrolment, and 10 196 people for the second year after enrolment.† General practitioner encounters of any type (face‐to‐face, telephone, email, non‐visit), including for consultations and reviewing and updating patient records. Data extracts provided directly by corporate Health Care Home practices did not include information about type of provider; for these practices, this measure was not calculated.
Box 4 – Chronic disease management processes of care for patients in the matched Health Care Homes (HCH) and usual care cohorts prior to enrolment and during first and second years after enrolment of HCH patients
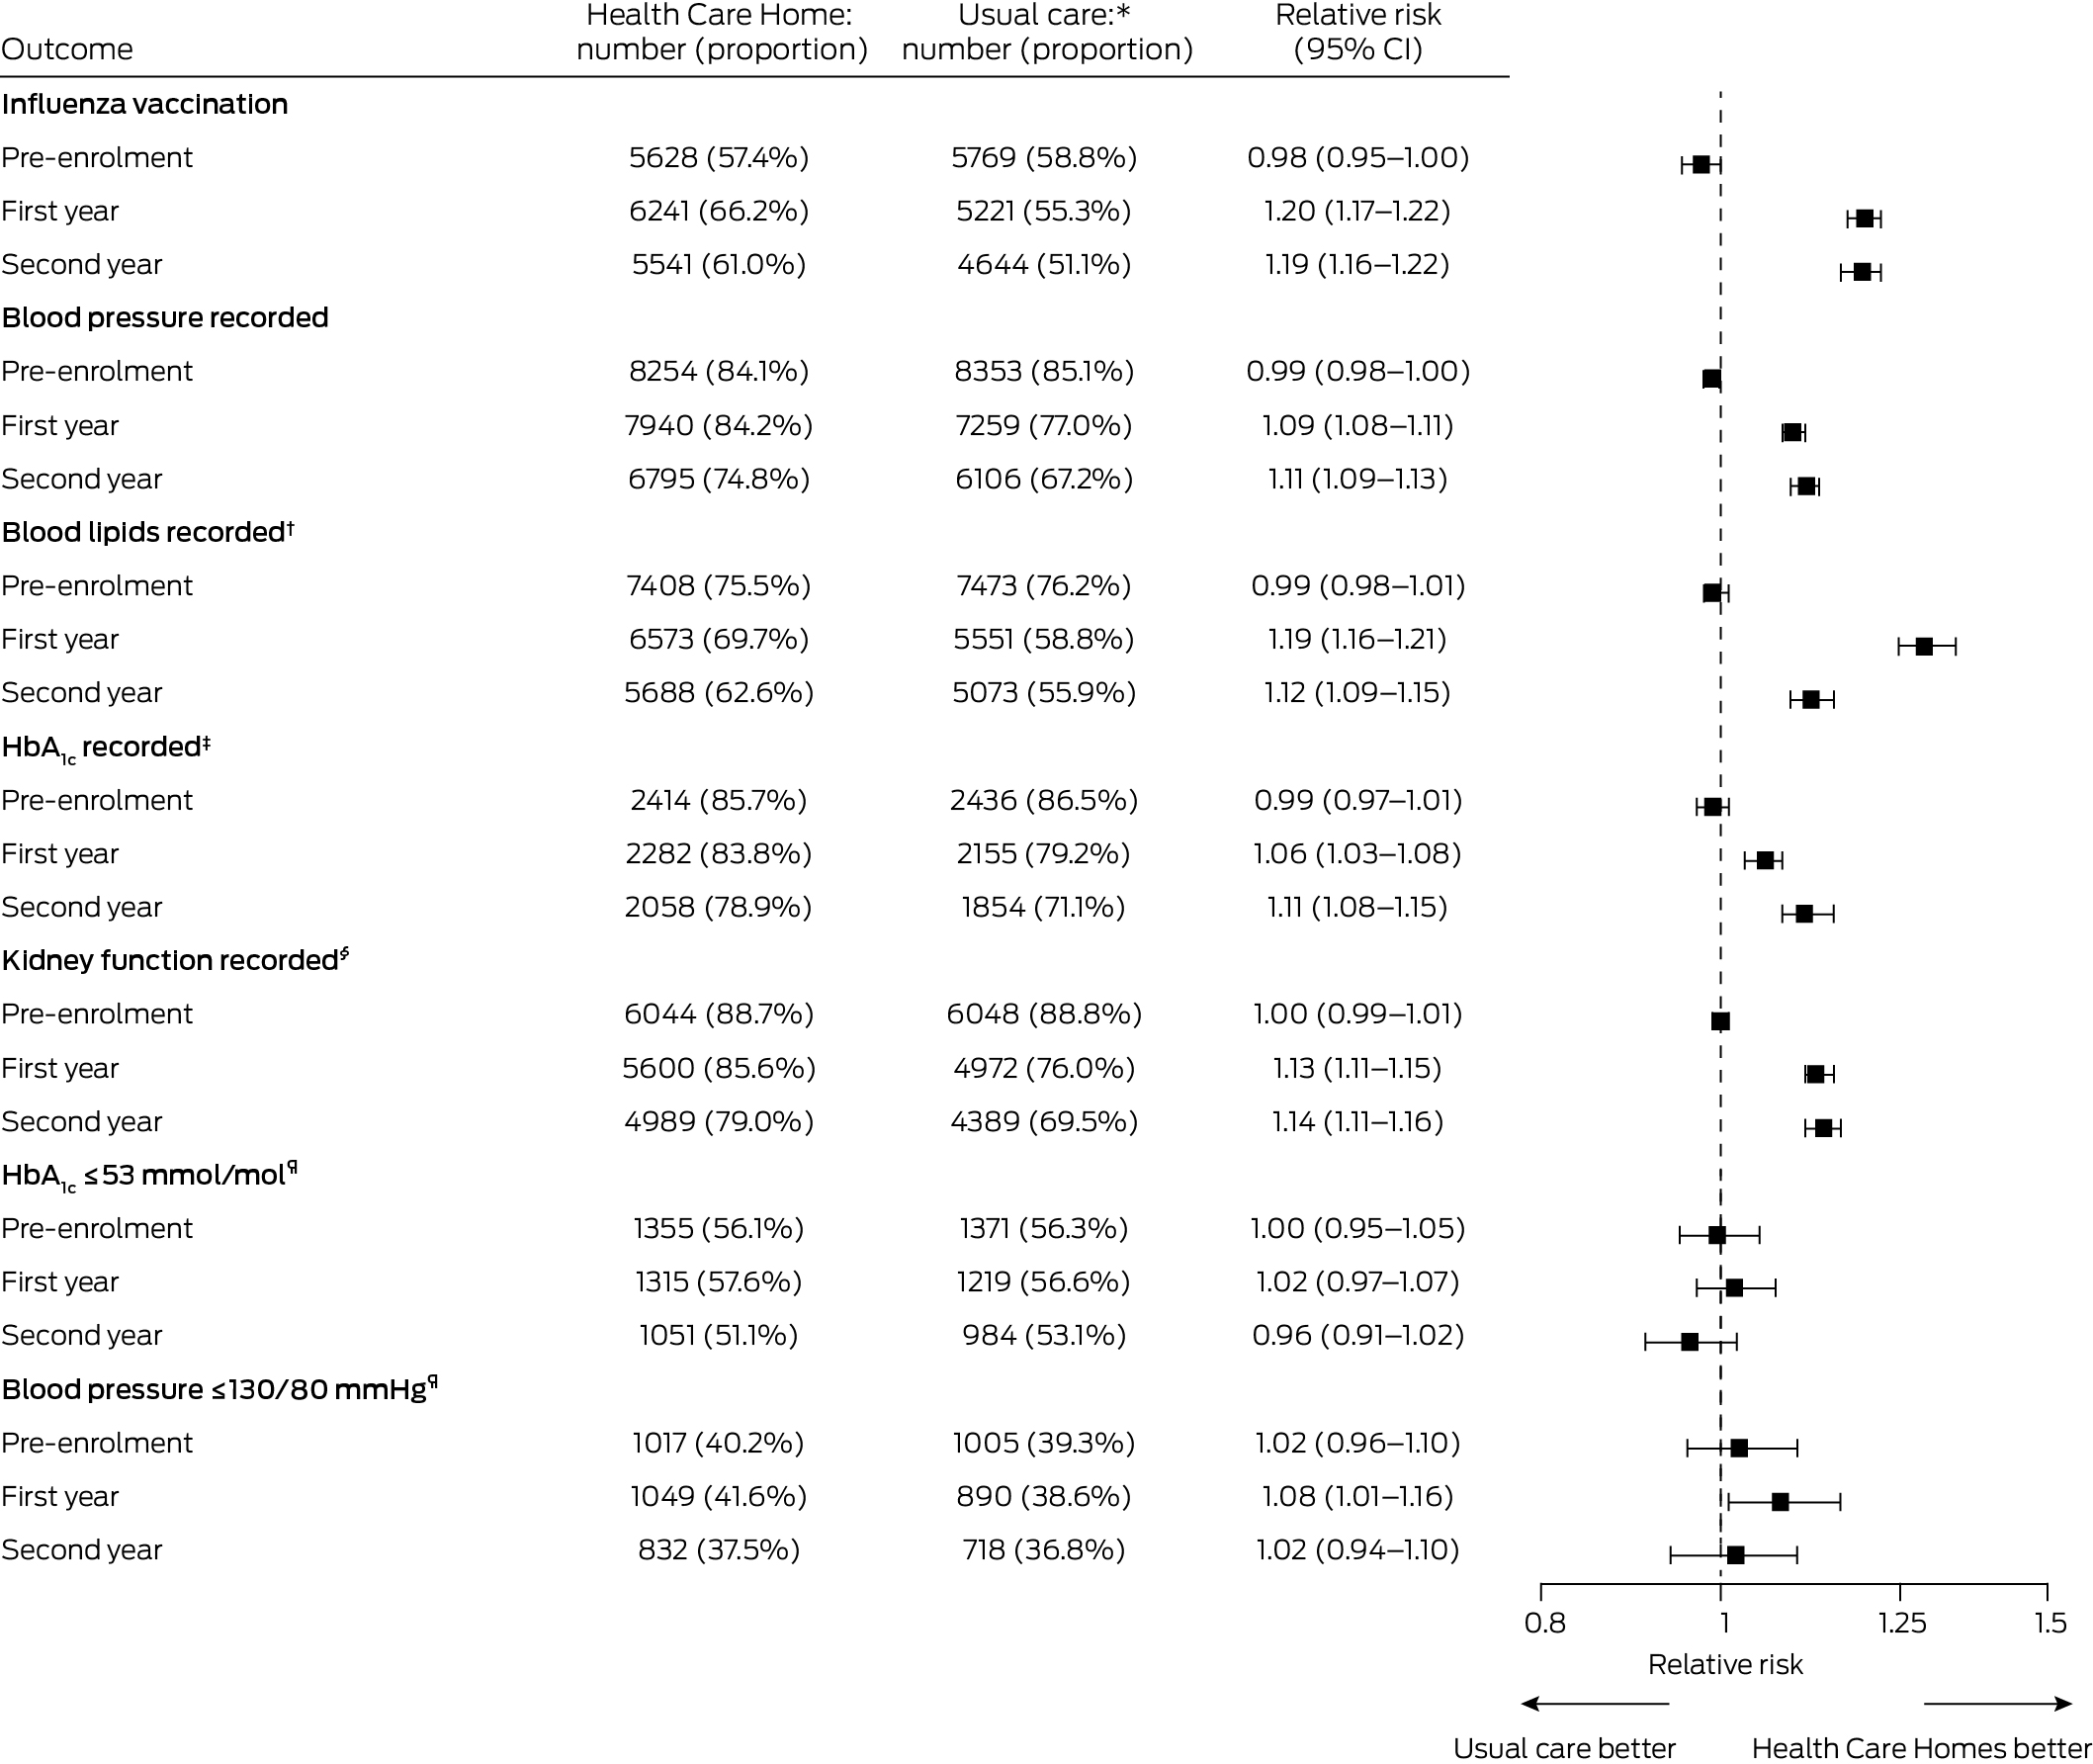
CI = confidence interval; SD = standard deviation.* Health Care Homes and usual care patients were matched (1:1) according to propensity score and year and month of enrolment; those with length of follow‐up less than one or two years were excluded from the respective comparison. Influenza vaccination, blood pressure, and blood lipids recorded were assessed for all participants (9811 pre‐enrolment, 9433 in the first year, 9080 in the second year in each group).† Total, low‐density lipoprotein, and high‐density lipoprotein cholesterol; triglycerides.‡ Patients with type 2 diabetes only. Each group included 2816 people in the pre‐enrolment period, 2722 in the first year, and 2607 in the second year after enrolment.§ Estimated glomerular filtration rate, creatinine and albumin–creatine ratio, in patients with type 2 diabetes or cardiovascular disease only. Each group included 6811 people in the pre‐enrolment period, 6539 in the first year, and 6313 in the second year after enrolment.¶ Patients with type 2 diabetes only, excluding those without recorded measurements. For HbA1c, the HCH group respectively included 2414, 2282, and 2058 people in the pre‐enrolment period, first year, and second year after enrolment, and the usual care group 2436, 2155, and 1854 people. For blood pressure, the HCH group respectively included 2527, 2520, and 2217 people in the pre‐enrolment period, first year and second year after enrolment, and the usual care group 2559, 2308, and 1951 people.
Received 2 June 2023, accepted 18 October 2023
- Duong T Tran1
- Michael O Falster1
- Jim Pearse2
- Deniza Mazevska2
- Patrick McElduff2,3
- Sallie Pearson1
- Kees C Gool4
- Jane Hall4
- Louisa Jorm1
- 1 Centre for Big Data Research in Health, University of New South Wales, Sydney, NSW
- 2 Health Policy Analysis, Sydney, NSW
- 3 University of Newcastle, Newcastle, NSW
- 4 Centre for Health Economics Research and Evaluation, University of Technology Sydney, Sydney, NSW
Open access:
Open access publishing facilitated by University of New South Wales, as part of the Wiley – University of New South Wales agreement via the Council of Australian University Librarians.
Data sharing:
The datasets we used were constructed with the permission of each of the source data custodians and with specific ethics approvals. We do not have permission to share patient‐level data because of the highly confidential nature of the data. Permission to access the data is restricted to researchers named and approved by relevant human research ethics committees.
The findings reported in this article are drawn from the Evaluation of the Health Care Homes trial funded by the Australian Department of Health and Aged Care. Intellectual property rights for the evaluation materials are vested in the Commonwealth of Australia. The information and opinions expressed in this article do not necessarily reflect the views or current policy of the Department of Health and Aged Care.
We acknowledge the other collaborators in the Health Care Homes trial, including Tim Smyth (Tim Smyth Consulting), James Dunbar (Deakin University), and Rebecca Rosen (Nuffield Trust). We acknowledge the contributions of the many participants in the Health Care Homes trial, including patients and carers, practice staff, the primary health networks, and the Australian Medical Services Alliance Northern Territory. We also thank the Australian Institute of Health and Welfare Data Integration Services Centre, NPS MedicineWise, Pen CS, and Outcome Health, and other data custodians for providing access to the data we analysed. We thank the Australian Institute of Health and Welfare Data Integration Services Centre for their assistance with data linkage. Michael Falster was supported by a National Health and Medical Research Council Early Career Fellowship (1139133).
The evaluation team independently designed the evaluation and consulted with the Evaluation and Data Working Group, established by the funder and including independent experts and representatives of the funder. The design of the evaluation was not changed by input from this group. Evaluation and Data Working Group members provided recommendations for refining survey and interview questions (not reported in this paper). The funder was not involved in data collection and analysis for the evaluation, nor in the preparation of the manuscript or the decision to publish.
- 1. Australian Institute of Health and Welfare. Chronic conditions and multimorbidity. Updated 14 Dec 2023. https://www.aihw.gov.au/reports/australias‐health/chronic‐conditions‐and‐multimorbidity (viewed Dec 2023).
- 2. Harris MF, Rhee J. Achieving continuity of care in general practice: the impact of patient enrolment on health outcomes. Med J Aust 2022; 216: 460‐461. https://www.mja.com.au/journal/2022/216/9/achieving‐continuity‐care‐general‐practice‐impact‐patient‐enrolment‐health
- 3. Department of Health and Aged Care. Chronic disease management patient information. Updated 14 Mar 2014. https://www1.health.gov.au/internet/main/publishing.nsf/Content/mbsprimarycare‐chronicdisease‐pdf‐infosheet (viewed Aug 2023).
- 4. World Health Organization. Multimorbidity [Technical series on safer primary care]. 13 Dec 2016. https://www.who.int/publications/i/item/9789241511650 (viewed Aug 2023).
- 5. Royal Australian College of General Practitioners. Standards for patient‐centred medical homes. Patient‐centred, comprehensive, coordinated, accessible and quality care. Sept 2016. https://www.racgp.org.au/FSDEDEV/media/documents/Running%20a%20practice/Practice%20standards/Patient‐centered‐medical‐homes.pdf (viewed Aug 2023).
- 6. Australian Medical Association. The “medical home” is the family GP [media release]. 11 Dec 2015. https://www.ama.com.au/media/%E2%80%98medical‐home%E2%80%99‐family‐gp (viewed July 2023).
- 7. Primary Care Collaborative. Defining the medical home. A patient‐centered philosophy that drives primary care excellence. 4 Nov 2015. https://www.pcpcc.org/about/medical‐home (viewed Aug 2023).
- 8. Goodyear‐Smith F, Gauld R, Cumming J, et al. International learning on increasing the value and effectiveness of primary care (I LIVE PC) New Zealand. J Am Board Fam Med 2012; 25 (Suppl 1): S39‐S44.
- 9. John JR, Jani H, Peters K, et al. The effectiveness of patient‐centred medical home‐based models of care versus standard primary care in chronic disease management: a systematic review and meta‐analysis of randomised and non‐randomised controlled trials. Int J Environ Res Public Health 2020; 17: 6886.
- 10. Sinaiko AD, Landrum MB, Meyers DJ, et al. Synthesis of research on patient‐centered medical homes brings systematic differences into relief. Health Aff (Millwood) 2017; 36: 500‐508.
- 11. van den Berk‐Clark C, Doucette E, Rottnek F, et al. Do patient‐centered medical homes improve health behaviors, outcomes, and experiences of low‐income patients? A systematic review and meta‐analysis. Health Serv Res 2018; 53: 1777‐1798.
- 12. McManus LS, Dominguez‐Cancino KA, Stanek MK, et al. The patient‐centered medical home as an intervention strategy for diabetes mellitus: a systematic review of the literature. Curr Diabetes Rev 2021; 17: 317‐331.
- 13. Veet CA, Radomski TR, D'Avella C, et al. Impact of healthcare delivery system type on clinical, utilization, and cost outcomes of patient‐centered medical homes: a systematic review. J Gen Intern Med 2020; 35: 1276‐1284.
- 14. Pearse J, Mazevska D, McElduff P, et al. Health Care Homes trial final evaluation report. Volume 2. Main report. 16 Aug 2022. https://www.health.gov.au/resources/publications/evaluation‐of‐the‐health‐care‐homes‐trial‐final‐evaluation‐report‐2022 (viewed July 2023).
- 15. Khanna S, Rolls DA, Boyle J, et al. A risk stratification tool for hospitalisation in Australia using primary care data. Sci Rep 2019; 9: 5011.
- 16. NPS MedicineWise. MedicineInsight data book, version 4.0. Dec 2021. https://www.nps.org.au/assets/NPS/pdf/MedicineInsight‐databook‐4.0‐December‐2021.pdf (viewed Aug 2023).
- 17. Australian Bureau of Statistics. Australian Statistical Geography Standard (ASGS), volume 5. Remoteness Structure, July 2016 (1270.0.55.005). 16 Mar 2018. https://www.abs.gov.au/ausstats/abs@.nsf/mf/1270.0.55.005 (viewed July 2023).
- 18. Australian Bureau of Statistics. IRSD. In: Census of Population and Housing: Socio‐Economic Indexes for Areas (SEIFA), Australia, 2016 (2033.0.55.001). 27 Mar 2018. https://www.abs.gov.au/ausstats/abs@.nsf/Lookup/by%20Subject/2033.0.55.001~2016~Main%20Features~IRSD~19 (viewed Aug 2023).
- 19. Saultz JW. Defining and measuring interpersonal continuity of care. Ann Fam Med 2003; 1: 134‐143.
- 20. von Elm E, Altman DG, Egger M, et al; STROBE Initiative. Strengthening the Reporting of Observational Studies in Epidemiology (STROBE) statement: guidelines for reporting observational studies. BMJ 2007; 335: 806‐808.
- 21. Billot L, Corcoran K, McDonald A, et al. Impact evaluation of a system‐wide chronic disease management program on health service utilisation: a propensity‐matched cohort study. PLoS Med 2016; 13: e1002035.
- 22. Reed RL, Roeger L, Kwok YH, et al. A general practice intervention for people at risk of poor health outcomes: the Flinders QUEST cluster randomised controlled trial and economic evaluation. Med J Aust 2022; 216: 469‐475. https://www.mja.com.au/journal/2022/216/9/general‐practice‐intervention‐people‐risk‐poor‐health‐outcomes‐flinders‐quest
- 23. Pearse J, Mazevska D, McElduff P, et al. Evaluation of the Health Care Homes trial (commissioned by the Australian Department of Health). Volume 3: Methods and data supplement 29 July 2022. https://www.health.gov.au/sites/default/files/documents/2022/08/evaluation‐of‐the‐health‐care‐homes‐trial‐final‐evaluation‐report‐2022‐methods‐and‐data‐supplement.pdf (viewed Oct 2023).
- 24. Daniels B, Havard A, Myton R, et al. Evaluating the accuracy of data extracted from electronic health records into MedicineInsight, a national Australian general practice database Int J Popul Data Sci 2022; 7: 1713.
- 25. Australian Department of Health. Future focused primary health care: Australia's primary health care 10 year plan 2022–2032. 25 Mar 2022. https://www.health.gov.au/resources/publications/australias‐primary‐health‐care‐10‐year‐plan‐2022‐2032 (viewed Aug 2023).
Abstract
Objective: To assess the impact of the Health Care Homes (HCH) primary health care initiative on quality of care and patient outcomes.
Design, setting: Quasi‐experimental, matched cohort study; analysis of general practice data extracts and linked administrative data from ten Australian primary health networks, 1 October 2017 – 30 June 2021.
Participants: People with chronic health conditions (practice data extracts: 9811; linked administrative data: 10 682) enrolled in the HCH 1 October 2017 – 30 June 2019; comparison groups of patients receiving usual care (1:1 propensity score‐matched).
Intervention: Participants were involved in shared care planning, provided enhanced access to team care, and encouraged to seek chronic condition care at the HCH practice where they were enrolled. Participating practices received bundled payments based on clinical risk tier.
Main outcome measures: Access to care, processes of care, diabetes‐related outcomes, hospital service use, risk of death.
Results: During the first twelve months after enrolment, the mean numbers of general practitioner encounters (rate ratio, 1.14; 95% confidence interval [CI], 1.11–1.17) and Medicare Benefits Schedule claims for allied health services (rate ratio, 1.28; 95% CI, 1.24–1.33) were higher for the HCH than the usual care group. Annual influenza vaccinations (relative risk, 1.20; 95% CI, 1.17–1.22) and measurements of blood pressure (relative risk, 1.09; 95% CI, 1.08–1.11), blood lipids (relative risk, 1.19; 95% CI, 1.16–1.21), glycated haemoglobin (relative risk, 1.06; 95% CI, 1.03–1.08), and kidney function (relative risk, 1.13; 95% CI, 1.11–1.15) were more likely in the HCH than the usual care group during the twelve months after enrolment. Similar rate ratios and relative risks applied in the second year. The numbers of emergency department presentations (rate ratio, 1.09; 95% CI, 1.02–1.18) and emergency admissions (rate ratio, 1.13; 95% CI, 1.04–1.22) were higher for the HCH group during the first year; other differences in hospital use were not statistically significant. Differences in glycaemic and blood pressure control in people with diabetes in the second year were not statistically significant. By 30 June 2021, 689 people in the HCH group (6.5%) and 646 in the usual care group (6.1%) had died (hazard ratio, 1.07; 95% CI, 0.96–1.20).
Conclusions: The HCH program was associated with greater access to care and improved processes of care for people with chronic diseases, but not changes in diabetes‐related outcomes, most measures of hospital use, or risk of death.