


The known: The estimated prevalence of long COVID varies widely between studies (range, 9–81% of people with SARS‐CoV‐2 infections).
The new: In a highly vaccinated population not broadly exposed to earlier SARS‐CoV‐2 variants, 18% of people infected with the Omicron variant reported symptoms consistent with long COVID 90 days after infection; 18% of these people had not fully resumed previous work or study by three months, and 38% required care from general practitioners for their symptoms two to three months after infection.
The implications: Long COVID affects a considerable number of people in Australia, and general practices play a major role in managing its burden.
The severe acute respiratory syndrome coronavirus 2 (SARS‐CoV‐2), the pathogen of coronavirus disease 2019 (COVID‐19), has caused considerable morbidity and mortality around the world. A substantial proportion of people experience symptoms months after the acute infection, a condition termed post‐COVID‐19 condition or long COVID.1,2,3,4 A precise clinical definition is difficult: the condition can include a variety of respiratory, neurological, cardiovascular, gastrointestinal, and other symptoms,5 and differences in the number and duration of symptoms required by various case definitions confound comparisons of long COVID studies.6,7 The World Health Organization therefore developed a clinical case definition of the post COVID‐19 condition as “the continuation or development of new symptoms 3 months after the initial SARS‐CoV‐2 infection, with these symptoms lasting for at least 2 months with no other explanation.”8,9
Western Australia was largely free of locally acquired COVID‐19 until interstate and overseas travel restrictions were relaxed in late February 2022, by which time more than 90% of the vaccine‐eligible population had been vaccinated.10 Western Australia was unusual in that almost all cases of COVID‐19 during 2022 were caused by the Omicron variant of SARS‐CoV‐2 circulating in a population without background immunity acquired during extensive exposure to earlier viral variants.10,11 Consequently, estimates of the risk of long COVID based on experience elsewhere may not be applicable in Western Australia.
The aim of our study was therefore to estimate the prevalence of long COVID among Western Australian adults, a highly vaccinated population whose first major exposure to SARS‐CoV‐2 was to its Omicron variant in 2022, and to assess its impact on health service use and return to work or study.
Methods
We undertook a survey of Western Australian residents aged 18 years or older at the time of infection for whom SARS‐CoV‐2 infections, detected by polymerase chain reaction (PCR) testing or with rapid antigen tests (RATs), were reported to the Western Australia Department of Health during 16 July – 3 August 2022 (recruitment ended once the minimum target of 20 000 participants was achieved), and who had consented during the case review process to follow‐up contact for research purposes. We did not include people for whom more than one SARS‐CoV‐2 infection was recorded, as prior or subsequent infections may influence the likelihood of long COVID (eg, partial immunity conferred by a previous infection).
During 14 October – 1 November 2022, the Department of Health sent each eligible person a text message with a unique link to the online survey 90 days after their positive SARS‐CoV‐2 test result. One or two reminder messages were sent to people who did not respond within 24 hours. Trained interviewers telephoned people who did not respond to the reminders, and administered the survey by telephone if they agreed to participate in the study. Survey responses were linked by the WA Health Public Health Operations with demographic and other data collected during the SARS‐CoV‐2 notification process and COVID‐19 vaccination data recorded in the Public Health Operations COVID‐19 Unified System (PHOCUS).12
Survey
Our survey (Supporting Information, part 1) included validated questions from a published questionnaire13 or derived from WHO and Centers for Disease Control resources.3,8 A pilot study assessed practical aspects of participants completing the online survey (results not reported), and training was provided to staff involved in interviews to standardise data collection procedures.
Outcome measures
The first major outcome was the proportion of respondents with long COVID, defined as their reporting new or ongoing symptoms or health problems, 90 days after a positive SARS‐CoV‐2 test, that the respondent related to COVID‐19. The WHO long COVID definition8,9 was the basis of our case definition, but we did not require that symptoms be present for at least two months, as symptoms reported three months after infection were presumed to be long standing symptoms. Further, we asked respondents whether they believed their symptoms were related to COVID‐19 without enquiring whether other explanations were possible. The purpose of both deviations from the case definition was to ease interpretation of the survey questions for participants.
The second major outcome was the proportion of respondents with long COVID who sought health care for long COVID‐related symptoms in the month preceding the survey; that is, two to three months after infection. The third outcome was the proportion of respondents who worked or studied prior to their infection who reported not fully returning to work or study because of long COVID‐related symptoms.
Statistical analysis
Sampling weights were calculated using gender and 10‐year age groups to adjust for differences in age–gender group proportions between respondents and all Western Australian adults with reported SARS‐CoV‐2 infections during the study period (Supporting Information, table 1). We report results as weighted proportions with 95% confidence intervals (CIs).
Relationships between variables potentially associated with long COVID and outcomes were assessed in log‐binomial regression analyses adjusted for all other variables; we report adjusted relative risks (aRRs) with 95% CIs. The characteristics deemed to be potentially associated with having long COVID were gender, age group, area of residence (metropolitan Perth or other Western Australia) (all obtained by the WA Department of Health during the SARS‐CoV‐2 notification process), and the number and time of COVID‐19 vaccinations at least one week before the positive SARS‐CoV‐2 test (vaccination data recorded in PHOCUS), as well as having a health condition prior to COVID‐19 (survey question). When gender was not recorded in the case review database, it was imputed when possible using the gender package in R 4.2.1 (R Core Team), based on first names and United States census data for 1950–2005.14 All other statistical analyses were performed in Stata 15.
Ethics approval
The study was approved by the Western Australia Department of Health Human Research Ethics Committee (RGS0000005516).
Results
Of the 70 876 adults with SARS‐CoV‐2 infections reported to the Department of Health during 16 July – 3 August 2022, 24 024 consented to contact for research purposes (33.9%). We excluded 1280 people from our survey (5.3% of those who provided consent): 912 because more than one SARS‐CoV‐2 infection had been reported, 342 were not Western Australia residents, and 26 had died prior to the survey. Of the 22 744 people invited to complete the survey, 12 711 agreed (55.9%); 959 respondents (7.5%) did not complete one or more questions about ongoing symptoms required for case classification, and their responses were excluded from our analysis. Gender was imputed for 294 of 349 people for whom this information was not recorded; we excluded responses by 55 people for whom the missing information could not be imputed. Responses from 11 697 respondents were ultimately included in our analysis (51.4% of those invited to participate, 16.5% of all adults with reported SARS‐CoV‐2 infections) (Box 1, Box 2).
Long COVID
Our case definition for long COVID was satisfied 90 days after positive SARS‐CoV‐2 test results by 2130 respondents (18.2%; 95% CI, 17.5–18.9%). After adjusting for other variables, the risk of long COVID was greater for women than men (aRR, 1.5; 95% CI, 1.4–1.6), for people aged 50–69 years than for those aged 18–29 years (aRR, 1.6; 95% CI, 1.4–1.9), for people with pre‐existing health conditions (aRR, 1.5; 95% CI, 1.4–1.7). The risk of long COVID was greater for people who had received two or fewer (aRR, 1.4; 95% CI, 1.2–1.8) or three COVID–19 vaccine doses (aRR, 1.3; 95% CI, 1.1–1.5) than for those who had received four or more doses prior to infection (Box 3).
More than one ongoing symptom was reported by 1925 people with long COVID (90.4%; median, six symptoms; interquartile range, 3–9 symptoms) (Box 4). The most frequently reported symptoms were tiredness or fatigue that interfered with daily life (1504 respondents, 70.6%; 95% CI, 68.6–72.6%) and difficulty with thinking or concentrating (1267 respondents; 59.5%; 95% CI, 57.4–61.6%) (Box 5).
Health service use by people with long COVID
Health service use in the month preceding the survey regarding symptoms respondents linked with their COVID‐19 illness was reported by 825 people with long COVID (38.7%); 814 visited general practitioners (38.2%), 84 visited emergency departments (3.9%), and 34 were admitted to hospital (1.6%). The adjusted risk of health service use was higher for women than men (aRR, 1.2; 95% CI, 1.1–1.4) (Box 6).
Self‐reported health
Most respondents who reported long COVID‐related symptoms rated that their current health as fair (1064 people, 50.0%) or poor (205, 9.6%). Most respondents without long COVID‐related symptoms described their health as excellent (2175 people, 22.7%) or good (5685, 59.4%) (Box 7).
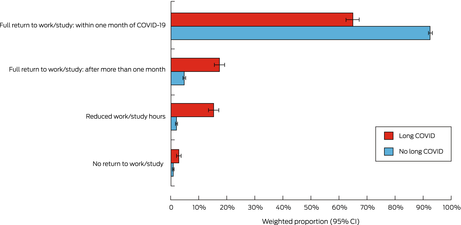
Return to work or study
Of the 1779 respondents with long COVID who had worked or studied before their positive SARS‐CoV‐2 test, 1154 (64.9%) had returned to work or study within one month of the test result, and a further 307 (17.3%) had returned within 90 days; 271 (15.2%) had reduced the number of hours they worked or studied, and 48 (2.7%) had not returned at all (Box 8). After adjusting for other participant characteristics, the risk of not returning or reduced hours was greater for people who had received two or fewer doses of COVID‐19 vaccine than for those who had received four or more doses (aRR, 2.0; 95% CI, 1.2–3.2); the risk was also greater for people with pre‐existing health conditions (aRR, 1.3; 95% CI, 1.1–1.6) (Box 9).
Discussion
The aim of our survey was to estimate the prevalence of long COVID in a highly vaccinated population exclusively exposed to the Omicron variant of SARS‐CoV‐2. We found that 18.2% of respondents met our criteria for long COVID 90 days after a positive SARS‐CoV‐2 test result, of whom 38.7% had used health services two to three months after their infection because of ongoing symptoms. Among respondents with long COVID who had worked or studied prior to their infection, 15.2% had reduced their number of hours, and 2.7% had not returned to work or study at all.
The prevalence of long COVID in our sample was higher than reported by large studies in the United Kingdom (5–17%)15,16,17 and Canada (17%),18 and by a 2022 review of Australian data (9.7% twelve weeks or longer after suspected COVID‐19).19 Our finding is, however, lower than that of a recent Queensland study, which found that 21% of people reported ongoing symptoms twelve weeks after PCR‐confirmed infections with the SARS‐CoV‐2 Omicron variant.20 Despite reports that the risk of long COVID may be lower following Omicron infections than with earlier SARS‐CoV‐2 variants,18,21 we found that the burden of long COVID may be substantial 90 days after Omicron infections.
About 39% of respondents with long COVID had used health care for ongoing symptoms 60–90 days after SARS‐CoV‐2 infections, similar to the proportion reported in Switzerland, where 40% of people had at least one contact with the health care system for reasons related to earlier COVID‐19.22 This was equivalent to 7.1% of all survey respondents; extrapolated to the 1.2 million people with first SARS‐CoV‐2 infections reported in Western Australia during 2022,23 this equates to about 80 000 health care episodes. As more than 90% of health care visits were to general practitioners, and the need for hospital services was quite limited, providing care to people with long COVID could focus on primary care.
We found that 64.9% of respondents with long COVID who were working or studying at the time of their SARS‐CoV‐2 infection had fully resumed this activity within a month of their test result. However, 17.9% could not do so by 90 days, or had reduced their work or study hours. Long COVID may therefore have economic and workforce implications, as also suggested by other authors.24
Finally, we found that the risk of long COVID‐related symptoms was lower for people who had been vaccinated against COVID‐19, also as reported by other investigators.25
Our survey findings are generally consistent with those of overseas studies undertaken earlier in the COVID‐19 pandemic which found that the risk of developing long COVID was greater for women than men, middle‐aged and older adults than younger adults, and people with pre‐existing health conditions, and that vaccination offers some protection.15,16,17,18,19 Nevertheless, differences in access to health care services and unemployment and social welfare support may prevent applying some of our findings outside Australia.
Limitations
To reduce selection bias, our survey was open to all adult Western Australian residents with notified SARS‐CoV‐2 infections during the study period who had consented to later contact for research purposes. Ascertainment of SARS‐CoV‐2 infections was probably high, as PCR tests and free RATs were widely available and results subject to mandatory reporting. Further, resource‐efficient communication and data collection technology facilitated our recruitment of a large survey sample; the response rate was reasonable (51.4%) and we applied sampling weights to our respondent sample. The COVID‐19 vaccination data from a comprehensive national register are presumed to be accurate. Finally, the absence of widespread SARS‐CoV‐2 transmission in Western Australia prior to 2022 reduces the likelihood that substantial numbers of unrecognised earlier infections affected background immunity and consequently the development of long COVID after re‐infection.
However, our findings are based on subjective symptom reports, and the specificity of the selected symptoms for diagnosing long COVID is unclear. As we surveyed only SARS‐CoV‐2‐positive people who had consented to follow‐up contact, we could not compare them with a control group without antecedent SARS‐CoV‐2 infections. Information on health service use and the impact of symptoms on work or study relied on respondents’ reports and were not independently verified. Information on the severity of the COVID‐19 illness associated with individual SARS‐CoV‐2 infections was limited to whether they were symptomatic infections; the overall number of hospitalisations (ie, for any cause) of people invited to participate, however, was only 0.7% (Box 2, footnote). Finally, selection and response biases inherent to our study design may have inflated the proportion of people we classified as having long COVID. As the vast majority of notified SARS‐CoV‐2 infections in Western Australia during 2022 were for people with symptoms, our denominators do not include a potentially large number of asymptomatic or undetected infections (ie, in people who were not tested). Further, people who feel ill are generally more likely to participate in research, and people with ongoing symptoms more likely to complete our survey,26 leading to overestimation of the prevalence of long COVID.
Conclusion
About 18% of survey respondents from a highly vaccinated population whose first epidemic encounter with SARS‐CoV‐2 was with its Omicron variant reported symptoms consistent with long COVID 90 days after infection. Hospital‐based care was not required by most people, but about 38% of people with long COVID (6.7% of all infected people) had visited general practices two to three months after infection for symptoms they linked with their SARS‐CoV‐2 infection. Most people with long COVID had fully returned to work or study within a month of their infection, but about 18% had not done so three months after their infections. Further studies could enhance our understanding of the duration and severity of long COVID and help identify effective treatment. We are currently assessing the responses to a six‐month follow‐up survey of the participants in our first survey.
Data sharing
The data underlying this report are available from the WA Department of Health upon request and approval.
Box 1 – Recruitment of adult Western Australian residents with reported SARS‐CoV‐2 infections during 16 July – 3 August 2022 for our long COVID survey, 14 October – 1 November 2022
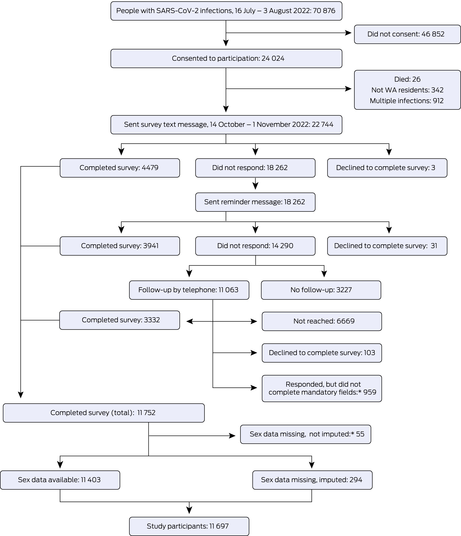
SARS‐CoV‐2 = severe acute respiratory syndrome coronavirus 2; WA = Western Australia.* Responses from people for whom information on gender were missing and could not be imputed, or who did not complete one or more questions regarding ongoing symptoms (required for the case classification) were excluded.
Box 2 – Characteristics of adult Western Australian residents with reported SARS‐CoV‐2 infections during 16 July – 3 August 2022 who were invited to complete our long COVID survey, 14 October – 1 November 2022
|
Characteristic |
People invited to complete survey |
Weighted number of responses |
|||||||||||||
|
|
|||||||||||||||
|
Total number of people |
22 744 |
11 697 |
|||||||||||||
|
Gender |
|
|
|||||||||||||
|
Men |
10 210 (45.1%) |
5618 (48.0%) |
|||||||||||||
|
Women |
12 410 (54.9%) |
6079 (52.0%) |
|||||||||||||
|
Missing data |
124 (0.5%) |
55 (0.5%) |
|||||||||||||
|
Age group (years) |
|
|
|||||||||||||
|
18–29 |
3673 (16.1%) |
2447 (20.9%) |
|||||||||||||
|
30–39 |
4227 (18.6%) |
2455 (21.0%) |
|||||||||||||
|
40–49 |
4330 (19.0%) |
2190 (18.7%) |
|||||||||||||
|
50–59 |
5102 (22.4%) |
2109 (18.0%) |
|||||||||||||
|
60–69 |
3449 (15.2%) |
1362 (11.6%) |
|||||||||||||
|
70 or older |
1963 (8.6%) |
1134 (9.7%) |
|||||||||||||
|
Residential area |
|
|
|||||||||||||
|
Metropolitan Perth |
18 690 (82.2%) |
9836 (84.1%) |
|||||||||||||
|
Other Western Australia |
4054 (17.8%) |
1861 (15.9%) |
|||||||||||||
|
SARS‐CoV‐2 test type |
|
|
|||||||||||||
|
Polymerase chain reaction |
7775 (34.2%) |
4055 (34.7%) |
|||||||||||||
|
Rapid antigen test |
14 963 (65.8%) |
7638 (65.3%) |
|||||||||||||
|
Missing data |
6 (< 0.1%) |
4 (< 0.1%) |
|||||||||||||
|
COVID‐19 vaccine doses before positive SARS‐CoV‐2 test result |
|
|
|||||||||||||
|
0–2 |
1810 (8.0%) |
703 (6.0%) |
|||||||||||||
|
3 |
17 186 (75.6%) |
8919 (76.3%) |
|||||||||||||
|
4 or more |
3748 (16.5%) |
2075 (17.7%) |
|||||||||||||
|
Time between most recent vaccine dose and SARS‐CoV‐2 test |
|
|
|||||||||||||
|
Less than 3 months |
4944 (21.7%) |
2451 (21.0%) |
|||||||||||||
|
3–6 months |
9912 (43.6%) |
5246 (44.8%) |
|||||||||||||
|
More than 6 months |
7353 (32.3%) |
3789 (32.4%) |
|||||||||||||
|
Not vaccinated |
535 (2.4%) |
211 (1.8%) |
|||||||||||||
|
Acute SARS‐CoV‐2 infection |
|
|
|||||||||||||
|
Asymptomatic |
2991 (13.2%) |
1529 (13.1%) |
|||||||||||||
|
Symptomatic |
19 648 (86.4%) |
10 168 (86.9%) |
|||||||||||||
|
Missing data |
105 (0.5%) |
4 (< 0.1%) |
|||||||||||||
|
Pre‐existing health condition* |
|
|
|||||||||||||
|
No |
— |
9206 (78.7%) |
|||||||||||||
|
Yes |
— |
2491 (21.3%) |
|||||||||||||
|
|
|||||||||||||||
|
COVID‐19 = coronavirus disease 2019; SARS‐CoV‐2 = severe acute respiratory syndrome coronavirus 2. * Information on pre‐existing health conditions was collected for the survey and is therefore not available for people who did not respond to the survey. During the study period, 171 people invited to complete the survey were admitted to hospital (0.7%; source: author Paul Knight [Public Health Operations, Western Australia Department of Health], 20 July 2023). |
|||||||||||||||
Box 3 – Long COVID (90 days after acute SARS‐CoV‐2 infection, 16 July – 3 August 2022) in adult Western Australian residents who responded to our long COVID survey, 14 October – 1 November 2022: log‐binomial regression analysis
|
|
|
Risk ratio |
|||||||||||||
|
Characteristic |
Respondents with long COVID* |
Unadjusted |
Adjusted† |
||||||||||||
|
|
|||||||||||||||
|
Gender |
|
|
|
||||||||||||
|
Men |
796/5618 (14.2%) |
1 |
1 |
||||||||||||
|
Women |
1334/6079 (21.9%) |
1.5 (1.4–1.7) |
1.5 (1.4–1.6) |
||||||||||||
|
Age group (years) |
|
|
|
||||||||||||
|
18–29 |
347/2447 (14.2%) |
1 |
1 |
||||||||||||
|
30–39 |
416/2455 (16.9%) |
1.2 (1.02–1.4) |
1.2 (1.03–1.4) |
||||||||||||
|
40–49 |
418/2190 (19.1%) |
1.3 (1.2–1.6) |
1.4 (1.2–1.6) |
||||||||||||
|
50–59 |
460/2109 (21.8%) |
1.5 (1.3–1.8) |
1.6 (1.4–1.9) |
||||||||||||
|
60–69 |
295/1362 (21.7%) |
1.5 (1.3–1.8) |
1.6 (1.4–1.9) |
||||||||||||
|
70 or older |
194/1134 (17.1%) |
1.2 (1.01–1.4) |
1.4 (1.2–1.7) |
||||||||||||
|
Residential area |
|
|
|
||||||||||||
|
Metropolitan Perth |
1749/9836 (17.8%) |
1 |
1 |
||||||||||||
|
Other Western Australia |
381/1861 (20.4%) |
1.1 (1.04–1.3) |
1.1 (0.99–1.2) |
||||||||||||
|
COVID‐19 vaccine doses before positive SARS‐CoV‐2 test result |
|
|
|
||||||||||||
|
0–2 |
140/703 (19.9%) |
1.2 (1.02–1.5) |
1.4 (1.2–1.8) |
||||||||||||
|
3 |
1652/8919 (18.5%) |
1.1 (1.02–1.3) |
1.3 (1.1–1.5) |
||||||||||||
|
4 or more |
337/2075 (16.2%) |
1 |
1 |
||||||||||||
|
Time between most recent vaccine dose and SARS‐CoV‐2 test |
|
|
|
||||||||||||
|
Less than 3 months |
467/2833 (16.5%) |
1 |
1 |
||||||||||||
|
3–6 months |
900/4960 (18.1%) |
1.1 (0.98–1.2) |
1.2 (1.01–1.4) |
||||||||||||
|
More than 6 months |
763/3904 (19.5%) |
1.2 (1.1–1.3) |
1.1 (0.99–1.3) |
||||||||||||
|
Pre‐existing health condition |
|
|
|
||||||||||||
|
No |
1493/9206 (16.2%) |
1 |
1 |
||||||||||||
|
Yes |
637/2491 (25.6%) |
1.6 (1.5–1.7) |
1.5 (1.4–1.7) |
||||||||||||
|
|
|||||||||||||||
|
COVID‐19 = coronavirus disease 2019; SARS‐CoV‐2 = severe acute respiratory syndrome coronavirus 2. * Weighted numbers and proportions of respondents. † For all other listed characteristics. |
|||||||||||||||
Box 4 – Numbers of symptoms reported by adult Western Australian residents with long COVID who responded to our long COVID survey, 14 October – 1 November 2022*
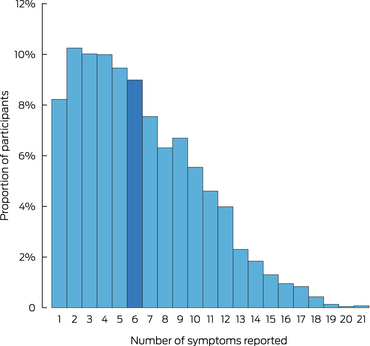
* Total number of respondents with long COVID: 2130. Thirty‐two participants with long COVID did not report any of the typical symptoms included in our survey. The data underlying this figure are including in the Supporting Information, table 2.
Box 5 – Symptoms reported by adult Western Australian residents with long COVID who responded to our long COVID survey, 14 October – 1 November 2022: proportions with 95% confidence intervals*
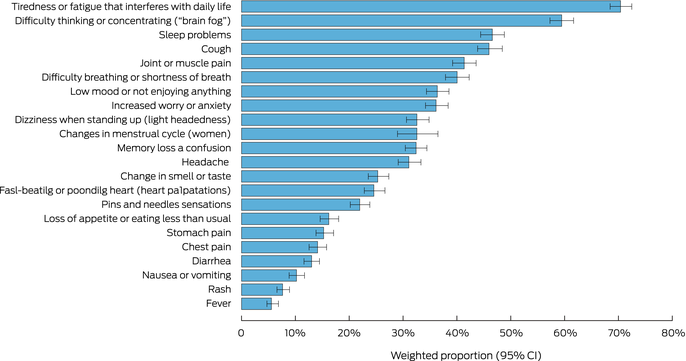
* Total number of respondents with long COVID: 2130. The data underlying this figure are including in the Supporting Information, table 3.
Box 6 – Health service use by adult Western Australian residents with long COVID who responded to our long COVID survey, 14 October – 1 November 2022: log‐binomial regression analysis
|
Characteristic |
|
|
|
|
Any health service use: risk ratio (95% confidence interval) |
||||||||||
|
General practice visit* |
Emergency department visit* |
Hospital admission* |
Any health service use* |
Unadjusted |
Adjusted† |
||||||||||
|
|
|||||||||||||||
|
Overall |
814/2130 (38.2%) |
84/2130 (3.9%) |
34/2130 (1.6%) |
825/2130 (38.7%) |
– |
– |
|||||||||
|
Gender |
|
|
|
|
|
|
|||||||||
|
Men |
262/796 (32.9%) |
57/1334 (4.3%) |
21/1334 (1.6%) |
265/796 (33.3%) |
1 |
1 |
|||||||||
|
Women |
552/1334 (41.4%) |
28/796 (3.5%) |
13/882 (1.5%) |
560/1334 (42.0%) |
1.2 (1.1–1.4) |
1.2 (1.1–1.4) |
|||||||||
|
Age group (years) |
|
|
|
|
|
|
|||||||||
|
18–29 |
128/347 (37.0%) |
19/347 (5.4%) |
6/347 (1.7%) |
128/347 (37.0%) |
1 |
1 |
|||||||||
|
30–39 |
158/416 (37.9%) |
12/416 (2.9%) |
3/416 (0.8%) |
162/416 (39.0%) |
1.1 (0.8–1.3) |
1.1(0.9–1.3) |
|||||||||
|
40–49 |
167/418 (40.1%) |
15/418 (3.6%) |
7/418 (1.8%) |
169/418 (40.5%) |
1.1 (0.8–1.4) |
1.1 (0.9–1.4) |
|||||||||
|
50–59 |
165/460 (35.9%) |
20/460 (4.2%) |
6/460 (1.3%) |
169/460 (36.7%) |
1.0 (0.8–1.2) |
1.0 (0.8–1.2) |
|||||||||
|
60–69 |
110/295 (37.3%) |
9/295 (3.2%) |
5/295 (1.7%) |
111/295 (37.7%) |
1.0 (0.8–1.3) |
1.0 (0.8–1.3) |
|||||||||
|
70 or older |
85/194 (44.0%) |
10/194 (5.1%) |
6/194 (3.3%) |
85/194 (43.8%) |
1.2 (0.95–1.5) |
1.2 (0.9–1.5) |
|||||||||
|
Residential area |
|
|
|
|
|
|
|||||||||
|
Metropolitan Perth |
670/1749 (38.3%) |
69/1749 (3.9%) |
28/1749 (1.6%) |
678/1749 (38.8%) |
1 |
1 |
|||||||||
|
Other Western Australia |
144/380 (37.8%) |
16/380 (4.1%) |
6/380 (1.5%) |
146/380 (38.5%) |
0.1 (0.8–1.4) |
1.0 (0.9–1.1) |
|||||||||
|
COVID‐19 vaccine doses before positive SARS‐CoV‐2 test result |
|
|
|
|
|
|
|||||||||
|
0–2 |
53 (37.4%) |
67/1652 (4.0%) |
5/140 (3.7%) |
53/140 (37.4%) |
0.9 (0.8–1.1) |
1.0 (0.7–1.2) |
|||||||||
|
3 |
624 (37.7%) |
5/140 (3.8%) |
21/1652 (1.3%) |
634/1653 (38.3%) |
0.9 (0.8–1.1) |
1.0 (0.9–1.1) |
|||||||||
|
4 or more |
138 (40.9%) |
12/337 (3.7%) |
7/337 (2.1%) |
138/337 (41.0%) |
1 |
1 |
|||||||||
|
Pre‐existing medical condition |
|
|
|
|
|
|
|||||||||
|
No |
549/1493 (36.7%) |
53/1493 (3.5%) |
19/1493 (1.3%) |
555/1493 (37.2%) |
1 |
1 |
|||||||||
|
Yes |
265/637 (41.7%) |
32/637 (5.0%) |
14/637 (2.2%) |
270/637 (42.3%) |
1.1 (1.02–1.3) |
1.1 (0.98–1.2) |
|||||||||
|
|
|||||||||||||||
|
COVID‐19 = coronavirus disease 2019; SARS‐CoV‐2 = severe acute respiratory syndrome coronavirus 2. * Weighted numbers and proportions of respondents. † For all other listed characteristics. |
|||||||||||||||
Box 7 – Self‐reported health of adult Western Australian residents who responded to our long COVID survey, 14 October – 1 November 2022, by long COVID status: proportions with 95% confidence intervals*
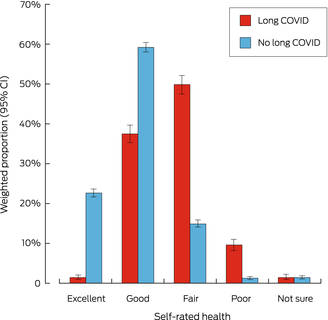
* Total numbers of respondents: 2130 with long COVID, 9537 without long COVID. The data underlying this figure are including in the Supporting Information, table 4.
Box 8 – Return to work or study by adult Western Australian residents who responded to our long COVID survey, 14 October – 1 November 2022, by long COVID status: proportions with 95% confidence intervals*
* Total numbers of respondents who worked or studied prior to infection: 1779 with long COVID, 7973 without long COVID. The data underlying this figure are including in the Supporting Information, table 5.
Box 9 – Adult Western Australian residents with long COVID who responded to our long COVID survey, 14 October – 1 November 2022, who had not returned to previous level of study or work: log‐binomial regression analysis
|
|
|
Risk ratio (95% confidence interval) |
|||||||||||||
|
Characteristic |
Not returned or reduced hours of work or study* |
Unadjusted |
Adjusted† |
||||||||||||
|
|
|||||||||||||||
|
Overall |
318/1779 (17.8%) |
– |
– |
||||||||||||
|
Gender |
|
|
|
||||||||||||
|
Men |
103/690 (14.9%) |
1 |
1 |
||||||||||||
|
Women |
215/1089(19.8%) |
1.3 (1.04–1.7) |
1.3 (0.996–1.6) |
||||||||||||
|
Age group (years) |
|
|
|
||||||||||||
|
18–29 |
71/333 (21.3%) |
1 |
1 |
||||||||||||
|
30–39 |
63/384 (16.4%) |
0.8 (0.4–1.1) |
0.7 (0.4–1.1) |
||||||||||||
|
40–49 |
75/394 (19.0%) |
0.5 (0.4–0.9) |
0.5 (0.3–0.9) |
||||||||||||
|
50–59 |
61/417 (14.6%) |
0.6 (0.3–0.7) |
0.6 (0.4–1.1) |
||||||||||||
|
60–69 |
33/200 (16.4%) |
0.5 (0.3–0.8) |
0.5 (0.3–1.8) |
||||||||||||
|
70 or older |
16/51 (31.7%) |
0.5 (0.4–0.8) |
0.5 (0.3–0.8) |
||||||||||||
|
Residential area |
|
|
|
||||||||||||
|
Metropolitan Perth |
259/1461 (17.7%) |
1 |
1 |
||||||||||||
|
Other Western Australia |
60/318 (18.7%) |
1.1 (0.8–1.4) |
1.1 (0.9–1.4) |
||||||||||||
|
COVID‐19 vaccine doses before positive SARS‐CoV‐2 test result |
|
|
|
||||||||||||
|
0–2 |
34/109 (31.7%) |
1.5 (1.0–2.2) |
2.0 (1.2–3.2) |
||||||||||||
|
3 |
246/1490 (16.5%) |
0.8 (0.6–1.04) |
1.0 (0.7–1.6) |
||||||||||||
|
4 or more |
38/180 (21.1%) |
1 |
1 |
||||||||||||
|
Time between most recent vaccine dose and SARS‐CoV‐2 test |
|
|
|
||||||||||||
|
Less than 3 months |
63/300 (21.0%) |
1 |
1 |
||||||||||||
|
3–6 months |
139/778 (17.9%) |
0.9 (0.7–1.1) |
0.9 (0.6–1.2) |
||||||||||||
|
More than 6 months |
116/701 (16.5%) |
0.8 (0.6–1.1) |
0.8 (0.6–1.1) |
||||||||||||
|
Pre‐existing medical condition |
|
|
|
||||||||||||
|
No |
201/1309 (15.4%) |
1 |
1 |
||||||||||||
|
Yes |
117/470 (24.9%) |
1.6 (1.3–2.0) |
1.5 (1.2–1.9) |
||||||||||||
|
|
|||||||||||||||
|
COVID‐19 = coronavirus disease 2019; SARS‐CoV‐2 = severe acute respiratory syndrome coronavirus 2. * Weighted numbers and proportions of respondents. † For all other listed characteristics. |
|||||||||||||||
Received 24 July 2023, accepted 25 October 2023
- Mulu Woldegiorgis1,2
- Gemma Cadby1
- Sera Ngeh1
- Rosemary J Korda2
- Paul K Armstrong1
- Jelena Maticevic1
- Paul Knight1
- Andrew Jardine3
- Lauren E Bloomfield1,4
- Paul V Effler1
- 1 Communicable Disease Control Directorate, Western Australia Department of Health, Perth, WA
- 2 National Centre for Epidemiology and Population Health, Australian National University, Canberra, ACT
- 3 Environmental Health Directorate, Western Australia Department of Health, Perth, WA
- 4 The University of Notre Dame Australia, Fremantle, WA
Open access:
Open access publishing facilitated by Australian National University, as part of the Wiley ‐ Australian National University agreement via the Council of Australian University Librarians.
Our study was funded by the Western Australia Department of Health. We extend our sincere gratitude to Clare Huppatz (Deputy Chief Health Officer; Acting Director of the Communicable Disease Control Directorate, Western Australia Department of Health) for her invaluable insights and guidance during protocol development and participant recruitment. We thank the Health Support Services team, particularly Gary Fosberry, Clinton Hall, and Tony Lyons, for the development and coordination of text messages to survey respondents, supporting the database platform, and maintaining data quality. We also thank the Public Health Operations surveillance officers who played a crucial role in conducting interviews, and the coordinators, James Macatangay, Jane Newcomb, and Deb Aggett, for their leadership and coordination. We appreciate the valuable oversight and guidance provided by Carolien Giele (Surveillance and Disease Control Manager, Communicable Disease Control Directorate). We thank the Australian National University, particularly the National Centre for Epidemiology and Population Health, for technical support. Finally, we acknowledge and thank the survey respondents for their time and contributions.
No relevant disclosures.
- 1. Al‐Aly Z, Bowe B, Xie Y. Long COVID after breakthrough SARS‐CoV‐2 infection. Nat Med 2022; 28: 1461‐1467.
- 2. Alwan NA, Johnson L. Defining long COVID: going back to the start. Med 2021; 2: 501‐504.
- 3. Centers for Disease Control and Prevention. Long COVID or post‐COVID conditions. Updated 20 July 2023. https://www.cdc.gov/coronavirus/2019‐ncov/long‐term‐effects/index.html (viewed June 2022).
- 4. Crook H, Raza S, Nowell J, et al. Long covid‐mechanisms, risk factors, and management. BMJ 2021; 374: n1648.
- 5. Salamanna F, Veronesi F, Martini L, et al. Post‐COVID‐19 syndrome: the persistent symptoms at the post‐viral stage of the disease. A systematic review of the current data. Front Med (Lausanne) 2021; 8: 653516.
- 6. Kingstone T, Taylor AK, O'Donnell CA, et al. Finding the “right” GP: a qualitative study of the experiences of people with long‐COVID. BJGP Open 2020; 4: bjgpopen20X101143.
- 7. Sudre CH, Murray B, Varsavsky T, et al. Attributes and predictors of long COVID. Nat Med 2021; 27: 626‐631.
- 8. World Health Organization. A clinical case definition of post COVID‐19 condition by a Delphi consensus, 6 October 2021. https://www.who.int/publications/i/item/WHO‐2019‐nCoV‐Post_COVID‐19_condition‐Clinical_case_definition‐2021.1 (viewed June 2022).
- 9. World Health Organization. Post COVID‐19 condition (long COVID). 7 Dec 2022. https://www.who.int/europe/news‐room/fact‐sheets/item/post‐covid‐19‐condition (viewed Oct 2023).
- 10. Bloomfield LE, Ngeh S, Cadby G, et al. SARS‐CoV‐2 vaccine effectiveness against omicron variant in infection‐naive population, Australia, 2022. Emerg Infect Dis 2023; 29: 1162‐1172.
- 11. Katella K. Omicron, delta, alpha, and more: what to know about the coronavirus variants. Yale Medicine, 1 Sept 2023. https://www.yalemedicine.org/news/covid‐19‐variants‐of‐concern‐omicron (viewed Mar 2023).
- 12. Western Australia Department of Health. Assessing the risk of long COVID in Western Australia (RGS0000005516), version 2 [unpublished research protocol]. 28 Sept 2022.
- 13. Hughes SE, Haroon S, Subramanian, et al. Development and validation of the symptom burden questionnaire for long covid (SBQ‐LC): Rasch analysis. BMJ 2022; 377: e070230.
- 14. Blevins C, Mullen L. Jane, John… Leslie? A historical method for algorithmic gender prediction. DHQ 2015; http://www.digitalhumanities.org/dhq/vol/9/3/000223/000223.html (viewed Oct 2023).
- 15. Ayoubkhani D, Pawelek P. Prevalence of ongoing symptoms following coronavirus (COVID‐19) infection in the UK: 1 April 2021. https://www.ons.gov.uk/peoplepopulationandcommunity/healthandsocialcare/conditionsanddiseases/bulletins/prevalenceofongoingsymptomsfollowingcoronaviruscovid19infectionintheuk/1april2021 (viewed Feb 2024).
- 16. Subramanian A, Nirantharakumar K, Hughes S, et al. Symptoms and risk factors for long COVID in non‐hospitalized adults. Nat Med 2022; 28: 1706‐1714.
- 17. Thompson EJ, Williams DM, Walker AJ, et al. Long COVID burden and risk factors in 10 UK longitudinal studies and electronic health records. Nat Commun 2022; 13: 3528.
- 18. Government of Canada. COVID‐19: Longer‐term symptoms among Canadian adults; second report. Associations between longer‐term symptoms after COVID‐19 and sociodemographics, health characteristics, period of infection, and vaccination status in Canadian adults, January 2020 to August 2022. Updated 24 Mar 2023. https://health‐infobase.canada.ca/covid‐19/post‐covid‐condition/spring‐2023‐report.html (viewed June 2023).
- 19. Australian Institute of Health and Welfare. Long COVID in Australia: a review of the literature (PHE 318). 16 Dec 2022. https://www.aihw.gov.au/getmedia/9592f439‐9b96‐4589‐a55d‐6b04e262e5e1/aihw‐phe‐318.pdf.aspx?inline=true (viewed May 2023).
- 20. Brown M, Gerrard J, McKinlay L, et al. Ongoing symptoms and functional impairment 12 weeks after testing positive for SARS‐CoV‐2 or influenza in Australia: an observational cohort study. BMJ Public Health 2023; 1: e000060.
- 21. Antonelli M, Pujol JC, Spector TD, et al. Risk of long COVID associated with delta versus omicron variants of SARS‐CoV‐2. Lancet 2022; 399: 2263‐2264.
- 22. Menges D, Ballouz T, Anagnostopoulos A, et al. Burden of post‐COVID‐19 syndrome and implications for healthcare service planning: a population‐based cohort study. PLoS One 2021; 16: e0254523.
- 23. Western Australia Department of Health. COVID‐19 weekly surveillance report: 19 December to 25 December 2022. https://www.health.wa.gov.au/~/media/Corp/Documents/Health‐for/Infectious‐disease/COVID19/Weekly‐surveillance‐report/COVID‐19‐Weekly‐Surveillance‐report‐19‐December‐25‐December‐2022.pdf (viewed June 2023).
- 24. Fischer K, Reade JJ, Schmal WB. What cannot be cured must be endured: the long‐lasting effect of a COVID‐19 infection on workplace productivity. Labour Econ 2022; 79: 102281.
- 25. Kuodi P, Gorelik Y, Zayyad H, et al. Association between BNT162b2 vaccination and reported incidence of post‐COVID‐19 symptoms: cross‐sectional study 2020–21, Israel. NPJ Vaccines 2022; 7: 101.
- 26. Walter JK, Davis MM. Who's willing? Characteristics associated with willingness to participate in clinical research. IRB 2016; 38: 15‐20.
Abstract
Objective: To estimate the prevalence of long COVID among Western Australian adults, a highly vaccinated population whose first major exposure to the severe acute respiratory syndrome coronavirus 2 (SARS‐CoV‐2) was during the 2022 Omicron wave, and to assess its impact on health service use and return to work or study.
Study design: Follow‐up survey (completed online or by telephone).
Setting, participants: Adult Western Australians surveyed 90 days after positive SARS‐CoV‐2 test results (polymerase chain reaction or rapid antigen testing) during 16 July – 3 August 2022 who had consented to follow‐up contact for research purposes.
Main outcome measures: Proportion of respondents with long COVID (ie, reporting new or ongoing symptoms or health problems, 90 days after positive SARS‐CoV‐2 test result); proportion with long COVID who sought health care for long COVID‐related symptoms two to three months after infection; proportion who reported not fully returning to previous work or study because of long COVID‐related symptoms.
Results: Of the 70 876 adults with reported SARS‐CoV‐2 infections, 24 024 consented to contact (33.9%); after exclusions, 22 744 people were invited to complete the survey, of whom 11 697 (51.4%) provided complete responses. Our case definition for long COVID was satisfied by 2130 respondents (18.2%). The risk of long COVID was greater for women (v men: adjusted risk ratio [aRR], 1.5; 95% confidence interval [CI], 1.4–1.6) and for people aged 50–69 years (v 18–29 years: aRR, 1.6; 95% CI, 1.4–1.9) or with pre‐existing health conditions (aRR, 1.5; 95% CI, 1.4–1.7), as well as for people who had received two or fewer COVID–19 vaccine doses (v four or more: aRR, 1.4; 95% CI, 1.2–1.8) or three doses (aRR, 1.3; 95% CI, 1.1–1.5). The symptoms most frequently reported by people with long COVID were fatigue (1504, 70.6%) and concentration difficulties (1267, 59.5%). In the month preceding the survey, 814 people had consulted general practitioners (38.2%) and 34 reported being hospitalised (1.6%) with long COVID. Of 1779 respondents with long COVID who had worked or studied before the infection, 318 reported reducing or discontinuing this activity (17.8%).
Conclusion: Ninety days after infection with the Omicron SARS‐CoV‐2 variant, 18.2% of survey respondents reported symptoms consistent with long COVID, of whom 38.7% (7.1% of all survey respondents) sought health care for related health concerns two to three months after the acute infection.