


The known: In June 2020, prescribing restrictions for Pharmaceutical Benefits Scheme (PBS)‐subsidised opioid medicines were tightened and half‐pack product sizes for immediate‐release (IR) formulations introduced.
The new: The PBS changes were immediately followed by reduced dispensing of PBS‐subsidised opioids, but not by a major decline in overall opioid medicine sales in Australia. Adoption of half‐pack sizes of oxycodone IR was strong.
The implications: Some people may have moved to private prescriptions to circumvent the new restrictions for PBS‐subsidised opioids, but we found no evidence for a major shift to private prescriptions during their first year of operation.
The use of opioid medicines has increased markedly since the 1990s, in parallel with their expanded use for treating chronic non‐cancer pain.1,2 Opioid‐related harms have also increased; rates of opioid dependence and misuse among people with chronic pain have been estimated to be about 10% and 25% respectively,3 and opioid dependence was deemed responsible for 0.37% of all disability‐adjusted life years (DALYs) lost in 2010 (about nine million DALYs globally).4
Medicines regulators and funders have attempted to curb pharmaceutical opioid use and its associated harms with updated guidance,5 package warnings,6 and supply restrictions.7,8,9,10,11 The effectiveness of these interventions is not always clear, but no‐repeat prescribing policies and the availability of short course treatments have been cited as reasons for the lower frequency of opioid‐related harms in Europe than in the United States despite similar levels of use.12
Annual per capita opioid consumption in Australia is the ninth highest in the world.1 In 2015, an estimated 8.5% of Australians with chronic non‐cancer pain satisfied the clinical criteria for opioid dependence,13 and opioids are the leading cause of drug‐induced deaths in Australia.14 In response, Pharmaceutical Benefits Scheme (PBS) prescribing restrictions for publicly subsidised opioid medicines were tightened from 1 June 2020, and half‐pack product formulations for immediate release opioids were added to the PBS.15 These changes sought to align opioid use with recent Australian regulatory changes,16 and to reduce the number of people unnecessarily prescribed opioid medicines and the volume of prescription opioids in the community.15
The aim of our study was to evaluate the immediate impact of the PBS changes by estimating changes in both PBS‐subsidised opioid dispensing and total opioid sales during the twelve months following their introduction.
Methods
The PBS subsidises prescription medicines for Australian citizens and eligible residents. In our population‐based interrupted time series analysis, we assessed the impact of changes to PBS prescribing conditions for most subsidised opioid medicines effective from 1 June 2020 (Supporting Information, table 1):
- The restriction level for most immediate release (IR) formulations changed from “unrestricted” to “restricted benefit”. These formulations could now be prescribed only for specific indications.
- The restriction level for most controlled release (CR) formulations changed from “restricted benefit” to “authority required (streamlined)”. These formulations could now be prescribed only for certain indications and prescribers were required to provide a PBS authority code. These prescriptions can be audited by the PBS, and this change is more restrictive than that for IR formulations.
- Two PBS listings that allowed up to six months’ supply for codeine/paracetamol and 90 days’ supply of tramadol IR were removed. Repeat prescriptions for all PBS‐listed opioids were now classed as “authority required (streamlined)” and limited to a maximum of 30 days’ supply.
- Half‐pack size item codes were introduced for all IR opioid medicine formulations.15
Data sources
PBS dispensing claims are processed by Services Australia, which provides, for research purposes, a dataset of claims for a randomly selected 10% sample of PBS‐eligible people.17 The de‐identified, individual‐level data include the PBS‐specific item code for the medicine, formulation (IR, CR), and pack size of each medicine dispensed; the quantity dispensed; the date of dispensing; and whether the dispensing was a first or repeat dispensing. We analysed data for 28 May 2018 – 6 June 2021 to assess the effect of the prescribing restrictions on PBS‐subsidised opioid dispensing.
Opioid medicines subsidised by the PBS can also be purchased privately (ie, without PBS subsidy), and PBS prescribing restrictions do not apply to private prescriptions. To assess the impact of the PBS changes on total opioid medicine sales, we analysed aggregate monthly sales data to community pharmacies during 28 May 2018 – 6 June 2021. IQVIA (iqvia.com) maintains a database of pharmaceutical manufacturer and wholesaler data that captures about 96% of prescription pharmaceutical sales in Australia.18 The dataset provided includes the total number of packs sold per month for each opioid formulation. PBS‐subsidised and privately funded prescription sales are not distinguished in the dataset, but comparing estimated changes in total sales with those in PBS dispensing provides information about the extent of private prescription opioid sales in Australia.
Outcomes
We examined the following outcomes overall, by formulation type (IR, CR), and by specific opioid medicine formulation (eg, oxycodone IR):
- Mean amount of PBS‐subsidised opioid medicines dispensed per day, expressed as oral morphine equivalent milligrams (OME), derived from the 10% PBS dataset at the weekly level (to control for day of the week effects). OME are used to compare opioid formulations as quantities that produce equivalent analgesic effects;19 this facilitates the aggregation of data for different opioid formulations weighted by analgesic effect rather than weight or tablet count (Supporting Information, table 2).
- Mean overall amount of opioid medicine sold per day (OME/day), derived from IQVIA data at the monthly interval and adjusted for number of days in each month. Weekly sales data were not available.
- The proportion of total opioid medicine sales comprised of PBS‐subsidised dispensing (each as OME), derived from PBS and IQVIA data at the monthly level. This analysis examined whether the PBS changes were followed by switching from public to private prescriptions. As the PBS data were derived from a 10% sample dataset, we divided monthly overall amount of opioid medicine sold by ten for this calculation.
- Proportion of PBS‐subsidised opioid dispensing comprised of repeat dispensing of prescriptions, before and after 1 June 2020.
- Proportions of PBS‐subsidised IR opioid dispensing and total opioid medicine sales comprised of half‐pack dispensing (from 1 June 2020).
Statistical analysis
We quantified changes in opioid medicines dispensed and sold, and the total market proportion of PBS‐subsidised opioid medicines dispensed, in multivariate segmented regression models that included a structural component to facilitate joint estimation of seasonal effects for each opioid type. We report daily PBS‐subsidised dispensing (weekly data resolution), total daily sales (monthly data resolution), and PBS‐subsidised dispensing as a proportion of overall sales with Wald 95% confidence intervals (CIs). We also report changes in dispensing and sales trends before and after the PBS changes, with Wald 95% CIs. We assessed the statistical significance of changes in the weekly proportion of PBS‐subsidised dispensing comprised by repeat dispensing in Fisher exact tests. We compared repeat PBS‐subsidised dispensing of prescriptions during the four months before and the eight months after the PBS changes (to account for perturbations of the data and delays in filling prescriptions); we report odds ratios with 95% CIs. We report the proportion of PBS‐subsidised opioid dispensing and of OME dispensed between 1 July 2020 – 6 June 2021 comprised by dispensing of half‐pack sizes, identified by PBS item code (further details: Supporting Information). All analyses were performed in R 4.0.4 (R Foundation for Statistical Computing).
Ethics approval
The NSW Population and Health Services Research Ethics Committee approved our study (2013/11/494), and the Services Australia External Request Evaluation Committee approved PBS data access (RMS1483). We did not seek ethics approval for access to the IQVIA data, as they are aggregated and include no potentially identifying information.
Results
PBS‐subsidised opioid medicines dispensed
During the twelve months after the PBS changes, daily PBS‐subsidised opioid medicine dispensing was 81 565 OME lower (95% CI, –106 146 to –56 984 OME) than the mean daily level for 2018–20, a decline of 3.8% after adjusting for the pre‐intervention trend; the relative reduction was greater for IR (8.4%) than CR formulations (2.6%) (Box 1, Box 2). The largest declines were for IR formulations of codeine/paracetamol (–16 521 OME; 95% CI, –19 508 to –13 535 OME; 11.7%) and tramadol (–20 326 OME; 95% CI, –21 736 to –18 916 OME; 28.6%) (Box 1; Supporting Information, figures 1, 2).
Daily PBS‐subsidised dispensing of CR opioid formulations was 44 815 OME (95% CI, –66 538 to –23 092 OME) lower after the PBS changes (Box 1, Box 2). The declines were largest for CR formulations of oxycodone/naloxone, tapentadol, and tramadol (Supporting Information, figures 3–5).
The downward trend in PBS‐subsidised dispensing of all opioid medicines and of CR opioid formulations prior to 1 June 2020 did not change significantly after 1 June 2020; the decline in IR formulation dispensing accelerated (by –38 [95% CI, –64 to –12] OME/day/day) (Box 1, Box 2). Pre‐1 June 2020 declines in dispensing slowed for oxycodone IR (change: +34 [95% CI, 22–45] OME/day/day), oxycodone CR (+45 [95% CI, 22–68] OME/day/day), fentanyl CR (+52 [95% CI, 24–80] OME/day/day), and morphine CR (+25 [95% CI, 6–45] OME/day/day) (Box 1; Supporting Information, figures 6–9). Declines in dispensing accelerated for codeine/paracetamol IR (change: –40 [95% CI, –51 to –29] OME/day/day), hydromorphone IR (–35 [95% CI, –48 to –22] OME/day/day), tapentadol CR (–35 [95% CI, –64 to –5] OME/day/day), and tramadol CR (–77 [95% CI, –103 to –51] OME/day/day) (Box 1).
All opioid medicines sold
Total daily OME sold of all formulation, IR formulation, and CR formulation opioid medicines did not change significantly after the PBS changes (Box 3, Box 4). Total mean daily OME sales of codeine IR (–17 615 [95% CI, –28 695 to –6534] OME; –30.9%) and fentanyl IR (–4245 [95% CI, –7314 to –1176] OME; –12.0%) declined; sales of hydromorphone IR (+26 465 [95% CI, 10 100–42 831] OME; +12.5%) and tapentadol IR (+43 396 [95% CI, 5680–81 111] OME; +9.4%) increased (Box 4; Supporting Information, figures 10–13).
The declines in overall sales prior to 1 June 2020 ceased for codeine IR (change: +42 [95% CI, 1–83] OME/day/day), fentanyl IR (+19 [95% CI, 8–30] OME/day/day), and fentanyl CR (+395 [95% CI, 2–789] OME/day/day) (Box 3; Supporting Information, figures 10, 11). The rising sales of tapentadol IR prior to 1 June 2020 increased after the PBS changes (change: +137 [95% CI, 3–271] OME/day/day) (Box 3; Supporting Information, figure 13).
PBS‐subsidised opioid medicine dispensing in relation to overall opioid medicine sales
PBS‐subsidised tramadol IR dispensing as a proportion of overall sales declined from 83.4% before the PBS changes to 68.5% from 1 June 2020 (change: –14.9 percentage points; 95% CI, –24.7 to –5.0 percentage points). Changes for other opioid medicines were not statistically significant (Box 5).
Repeat dispensing
Repeat dispensing of prescriptions comprised 7.3% of PBS‐subsidised opioid dispensing before 1 June 2020, and 1.2% thereafter. The declines in the proportion of repeat dispensing were greatest for codeine/paracetamol IR (10.0% to 1.0%), tramadol IR (19.8% to 0.5%), and tramadol CR (26.2% to 3.3%) (Box 6). Repeat dispensing as a proportion of medicines sold declined by 9.9 percentage points (95% CI, –12.3 to –7.4 percentage points) for codeine/paracetamol IR, 33.7 percentage points (95% CI, –35.9 to –31.6 percentage points) for tramadol IR, and 9.7 percentage points (95% CI, –12.8 to –6.6 percentage points) for tramadol CR (Supporting Information, table 3).
Half‐pack sizes
Half‐pack sizes comprised 8.5% of PBS‐subsidised IR opioid medicine dispensing and 2.8% of all opioid medicine sales in the twelve months after the PBS changes. For single‐agent oxycodone IR, half‐packs accounted for 14.9% of dispensed packs and 4.8% of OME dispensed (Supporting Information, table 4).
Discussion
PBS‐subsidised dispensing of opioid medicines had been declining in Australia since 2018, and the PBS changes introduced on 1 June 2020 further reduced subsidised dispensing, particularly that of CR formulations of oxycodone/naloxone, tapentadol, and tramadol and IR formulations of codeine/paracetamol and tramadol. Declines in PBS‐subsidised dispensing of CR formulations were probably attributable to the new prescribing restrictions, while the declines for PBS‐subsidised IR formulations are more likely the result of repeat prescribing without authorisation of codeine/paracetamol and tramadol IR no longer being available.
In Australia, 44% of prescriptions by general practitioners for tramadol and 15% of those for codeine IR during the past decade included at least one repeat authorisation.20 Most were private prescriptions, which were not affected by removing repeat prescribing for PBS‐subsidised codeine/paracetamol and tramadol. Total sales of these medicines did not change significantly after 1 June 2020, which could indicate a shift from public to private prescriptions; however, a large proportion of codeine/paracetamol and tramadol prescribing was on private prescriptions even before the PBS changes.20 Changes in overall sales would not be expected to perfectly match PBS‐subsidised dispensing changes, and changes in the proportion of PBS‐subsidised dispensing with respect to total sales (ie, consistent with a shift to private prescriptions) were statistically significant only for tramadol IR. Tapentadol IR is not subsidised by the PBS, but increased sales after June 2020 suggest that prescribers may have switched to prescribing this formulation. More detailed data are needed to directly examine switching from public to private prescriptions. However, we found no evidence for a broad move from public to private prescribing, suggesting that reductions in PBS‐subsidised dispensing reflect reduced use of opioid medicines in Australia.
In the United States, laws requiring lower prescribed quantities of opioid medicines led to fewer initiations of opioid therapy, shorter treatment duration, and reduced opioid medicine use in the community.8,9,10,11 We similarly found modest declines in the dispensing of several opioid medicines in Australia. Opioid use has increased over the past 25 years in countries with universal health care systems similar to ours,1 but, like Australia, increases in opioid‐related harms on the scale of the American “opioid epidemic” have not been reported.21,22 Smaller pack sizes and shorter courses of treatment are already available in many countries, and tighter access restrictions, particularly removing repeat authorisations and automatic refills,5 may be more effective for reducing community levels of opioids.
Limitations
The dispensing data for PBS‐eligible Australians and opioid medicine sales data we analysed did not include clinical information or information on illicit opioid use, and we cannot comment on the clinical appropriateness of the dispensing and sales changes we report. The sales data refer to the number of packs sold to pharmacies, and we estimated shifts between subsidised and private prescriptions indirectly by comparing the PBS‐subsidised amount dispensed with total sales. As 4% of prescription medicine sales to Australian community pharmacies are not reported to IQVIA, we may have slightly overestimated the PBS‐subsidised dispensing proportion.
Interrupted time series analysis is a powerful, quasi‐experimental approach that cannot directly control for the effects of concurrent events that may influence medicine use. The coronavirus disease 2019 (COVID‐19) outbreak in March 2020 disrupted health care in Australia, including elective surgery suspensions, and may have affected opioid use during the study period. Our models were adjusted for the immediate impact of COVID‐19 in March and April 2020, when the effects of prescription stockpiling and restrictions on elective surgery were apparent.23 Attenuation of the decline in oxycodone IR dispensing from 1 June 2020 may reflect the resumption of elective surgery in several states during May and June 2020.24
Further, we cannot ascertain which of the PBS changes in June 2020 contributed to changes in dispensing and sales. Tightened prescribing conditions, most notably regarding repeat authorisations, were probably the main causes for declines in opioid medicine dispensing. As people with prescriptions with repeat authorisations written prior to 1 June 2020 may have filled them after this date, we may have underestimated the impact of eliminating repeat authorisations. Our study was limited by the lack of a suitable control series with which we could compare our results.
Conclusions
Eliminating repeat prescribing of IR opioid medicines and prescribing restrictions that increased oversight for many other opioid medicines were associated with reduced PBS‐subsidised dispensing of these agents. Smaller declines in overall opioid medicine sales suggest that some people switched to private prescriptions for opioid medicines, but such moves were not extensive and, based on PBS‐subsidised dispensing, opioid medicine use in Australia declined after the introduction of the new restrictions.
Box 1 – Pharmaceutical Benefits Schedule (PBS)‐subsidised dispensing of opioid medicines, Australia, 2018–21: estimated changes associated with new PBS prescribing rules (1 June 2020 – 6 June 2021 v 28 May 2018 – 31 May 2020)*
|
Opioid medicine |
Estimated mean difference: OME (mg)/day (95% CI) |
Proportion |
Change in dispensing rate trend: OME (mg)/day/day (95% CI) |
||||||||||||
|
|
|||||||||||||||
|
All opioids |
–81 565 (–106 146 to –56 984) |
–3.8% |
0 (–89 to 89) |
||||||||||||
|
All immediate release (IR) formulations |
–36 750 (–43 969 to –29 531) |
–8.4% |
–38 (–64 to –12) |
||||||||||||
|
All controlled release (CR) formulations |
–44 815 (–66 538 to –23 092) |
–2.6% |
38 (–41 to 117) |
||||||||||||
|
Buprenorphine CR |
302 (–2939 to 3543) |
0.2% |
–4 (–16 to 8) |
||||||||||||
|
Codeine IR |
–685 (–905 to –465) |
–29.3% |
1 (0 to 1) |
||||||||||||
|
Codeine/paracetamol IR |
–16 521 (–19 508 to –13 535) |
–11.7% |
–40 (–51 to –29) |
||||||||||||
|
Fentanyl CR |
5509 (–2005 to 13 023) |
3.6% |
52 (24 to 80) |
||||||||||||
|
Hydromorphone IR |
–2006 (–1510 to 5522) |
7.6% |
–35 (–48 to –22) |
||||||||||||
|
Hydromorphone CR |
–2098 (–5882 to 1686) |
–5.7% |
15 (1 to 29) |
||||||||||||
|
Methadone† |
805 (–4330 to 5940) |
1.2% |
–5 (–24 to 14) |
||||||||||||
|
Morphine IR |
595 (–2373 to 3563) |
1.7% |
1 (–10 to 12) |
||||||||||||
|
Morphine CR |
–117 (–5333 to 5100) |
–0.1% |
25 (6 to 45) |
||||||||||||
|
Oxycodone IR |
–1820 (–5015 to 1375) |
–1.1% |
34 (22 to 45) |
||||||||||||
|
Oxycodone CR |
2156 (–3998 to 8311) |
1.3% |
45 (22 to 68) |
||||||||||||
|
Oxycodone/naloxone |
–8588 (–14 956 to –2220) |
–2.7% |
22 (–2 to 45) |
||||||||||||
|
Tapentadol |
–17 638 (–25 637 to –9639) |
–4.3% |
–35 (–64 to –5) |
||||||||||||
|
Tramadol IR |
–20 326 (–21 736 to –18 916) |
–28.6% |
1 (–4 to 7) |
||||||||||||
|
Tramadol CR |
–25 146 (–32 224 to –18 069) |
–8.5% |
–77 (–103 to –51) |
||||||||||||
|
|
|||||||||||||||
|
CI = confidence interval; OME = oral morphine equivalent milligrams. * Estimated difference between the two periods in mean OME (in milligrams) dispensed per day, and difference in change in dispensing rate, after adjusting for the pre‐intervention trend and seasonal effects, based on 10% PBS sample dataset. † PBS‐listed methadone formulations are not controlled release formulations, but they are regulated in the same fashion as controlled release opioid medicines. For our analysis, we classified methadone as a controlled release opioid medicine. |
|||||||||||||||
Box 2 – Pharmaceutical Benefits Schedule (PBS)‐subsidised dispensing of opioid medicines, Australia, 2018–21: changes associated with new PBS prescribing rules (1 June 2020), by formulation type*
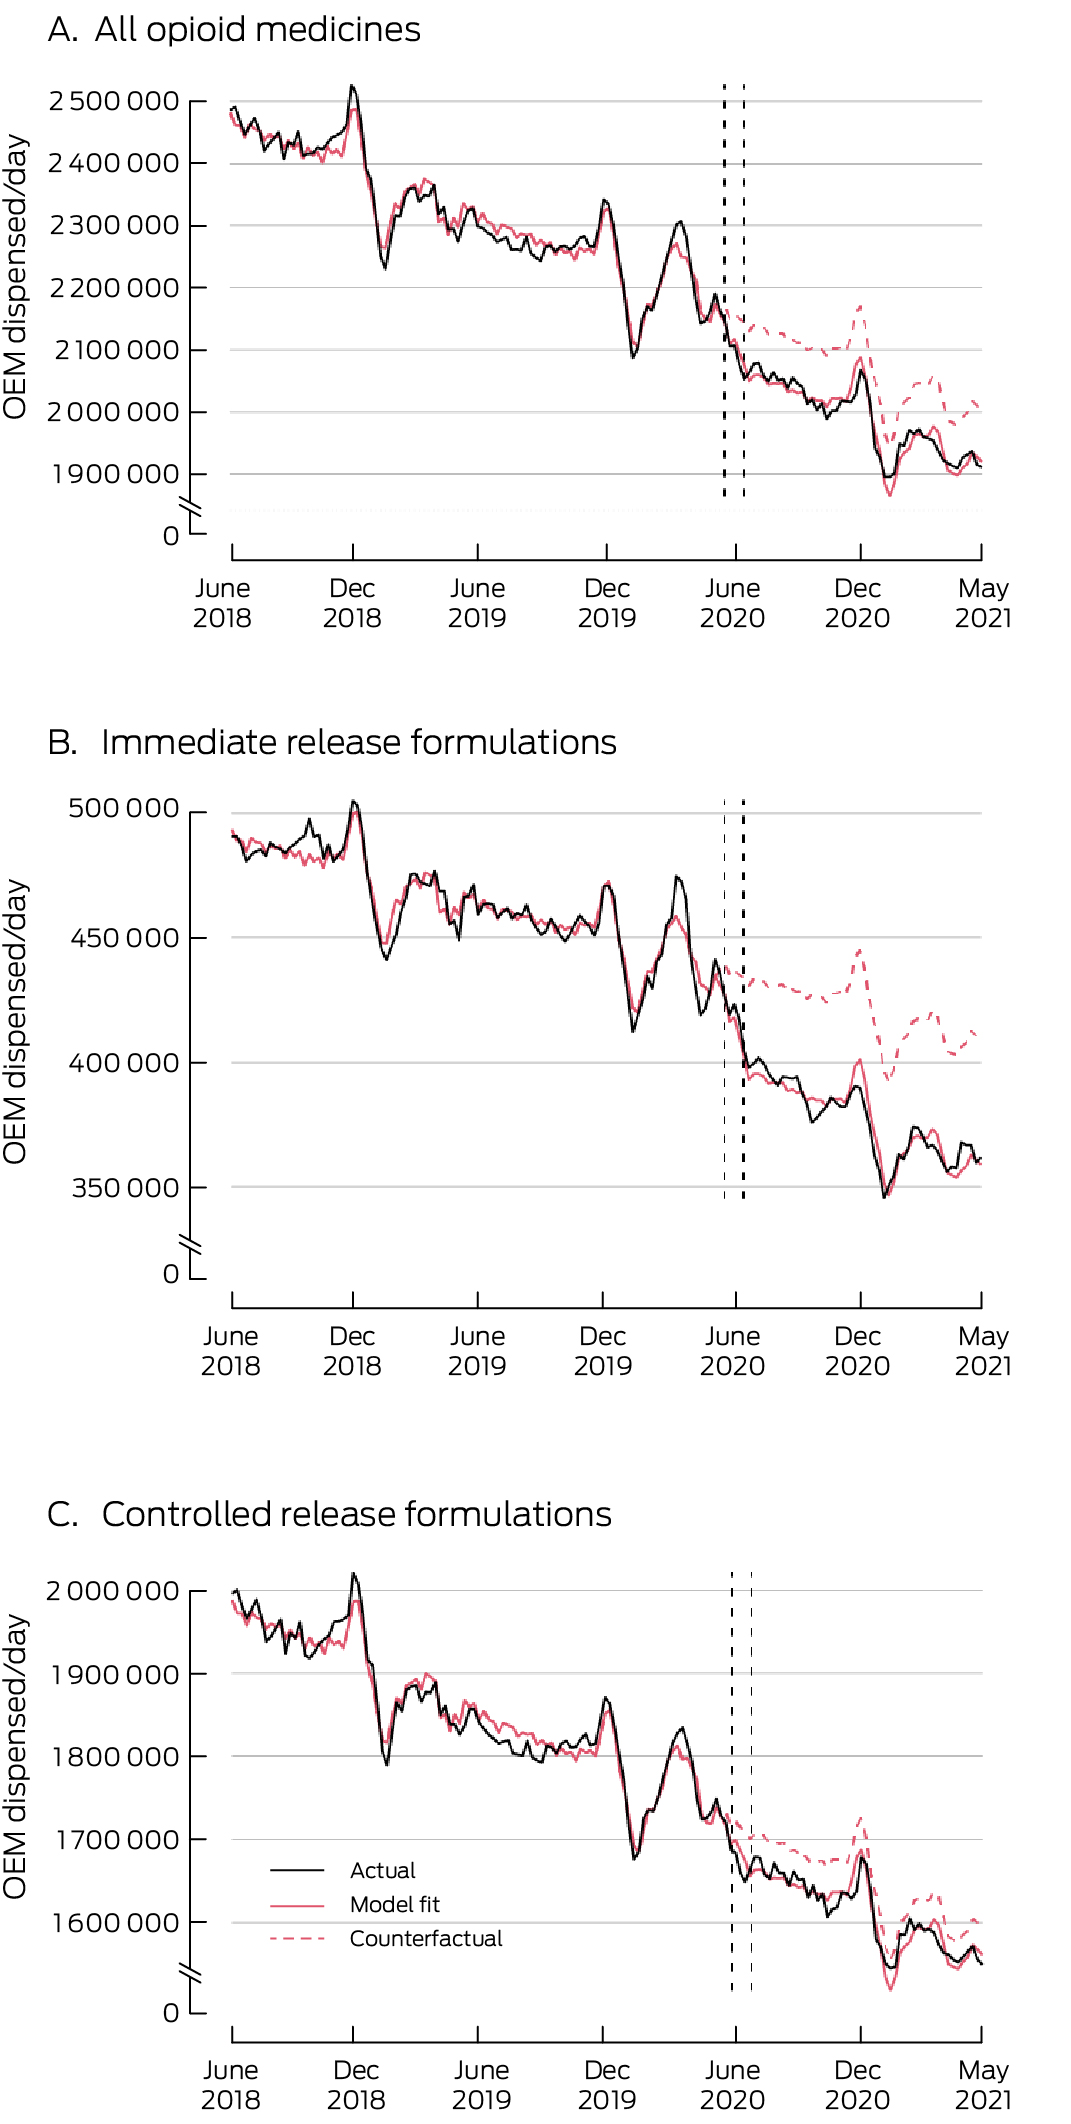
OME = oral morphine equivalent (in milligrams).* To enhance readability, graphs depict three‐week rolling means of dispensed medicines, based on 10% PBS sample dataset. Vertical lines indicate the week that the new prescribing restrictions and half‐pack sizes were introduced. PBS 10% sample dispensing data are offset by ±14 days to protect privacy: consequently, two vertical dashed lines (18 May 2020, 14 June 2020) are included. The counterfactual series depicts the expected values of the series had the PBS changes not been implemented.
Box 3 – Total sales of opioid medicines to community pharmacies, Australia, 2018–21: estimated changes associated with new Pharmaceutical Benefits Schedule (PBS) prescribing rules (1 June 2020 – 6 June 2021 v 28 May 2018 – 31 May 2020)*
|
Opioid medicine |
Estimated mean difference: OME (mg)/day (95% CI) |
Proportion |
Change in dispensing rate trend: OME (mg)/day/day (95% CI) |
||||||||||||
|
|
|||||||||||||||
|
All opioids |
–223 621 (–1 997 518 to 1 550 277) |
–0.9% |
–717 (–7005 to 5571) |
||||||||||||
|
All immediate release (IR) formulations |
–197 660 (–803 718 to 408 397) |
–3.4% |
–224 (–2382 to 1935) |
||||||||||||
|
All controlled release (CR) formulations |
–25 960 (–1 256 573 to 1 204 652) |
–0.1% |
–494 (–4864 to 3877) |
||||||||||||
|
Buprenorphine IR |
2400 (–162 to 4963) |
6.1% |
3 (–6 to 12) |
||||||||||||
|
Buprenorphine CR |
23 464 (–123 336 to 170 263) |
1.2% |
245 (–289 to 779) |
||||||||||||
|
Codeine IR |
–17 615 (–28 695 to –6534) |
–30.9% |
42 (1 to 83) |
||||||||||||
|
Codeine/paracetamol IR |
–120 854 (–473 423 to 231 715) |
–6.1% |
–269 (–1541 to 1001) |
||||||||||||
|
Fentanyl IR |
–4245 (–7314 to –1176) |
–12.0% |
(8 to 30) |
||||||||||||
|
Fentanyl CR |
13 264 (–95 837 to 122 366) |
0.8% |
395 (2 to 789) |
||||||||||||
|
Hydromorphone IR |
26 465 (10 100 to 42 831) |
12.5% |
–126 (–185 to –68) |
||||||||||||
|
Hydromorphone CR |
12 732 (–5272 to 30 735) |
4.0% |
63 (–2 to 129) |
||||||||||||
|
Methadone† |
83 660 (–57 394 to 224 714) |
3.8% |
–166 (–674 to 341) |
||||||||||||
|
Morphine IR |
7535 (–18 090 to 33 159) |
2.1% |
–4 (–96 to 88) |
||||||||||||
|
Morphine CR |
18 518 (–34 490 to 71 525) |
1.9% |
83 (–108 to 275) |
||||||||||||
|
Oxycodone IR |
–51 250 (–160 793 to 58 293) |
–2.9% |
226 (–164 to 618) |
||||||||||||
|
Oxycodone CR |
3657 (–108 966 to 116 279) |
0.2% |
190 (–216 to 596) |
||||||||||||
|
Oxycodone/naloxone |
50 931 (–116 904 to 218 766) |
1.5% |
111 (–485 to 709) |
||||||||||||
|
Tapentadol IR |
43 396 (5680 to 81 111) |
9.4% |
137 (3 to 271) |
||||||||||||
|
Tapentadol CR |
17 914 (–185 019 to 220 846) |
0.4% |
–613 (–1326 to 99) |
||||||||||||
|
Tramadol IR |
–83 493 (–214 728 to 47 741) |
–9.8% |
–251 (–721 to 217) |
||||||||||||
|
Tramadol CR |
–250 099 (–697 022 to 196 824) |
–7.4% |
–803 (–2402 to 795) |
||||||||||||
|
|
|||||||||||||||
|
CI = confidence interval; OME = oral morphine equivalent milligrams. * Estimated difference between the two periods in mean OME (in milligrams) sold per day, and difference in change in sales rate, after adjusting for the pre‐intervention trend and seasonal effects, based on IQVIA monthly sales data. † PBS‐listed methadone formulations are not controlled release formulations, but they are regulated in the same fashion as controlled release opioid medicines. For our analysis, we classified methadone as a controlled release opioid medicine. |
|||||||||||||||
Box 4 – Total sales of opioid medicines to community pharmacies, Australia, 2018–21: changes associated with new Pharmaceutical Benefits Schedule (PBS) prescribing rules (1 June 2020), by formulation type*
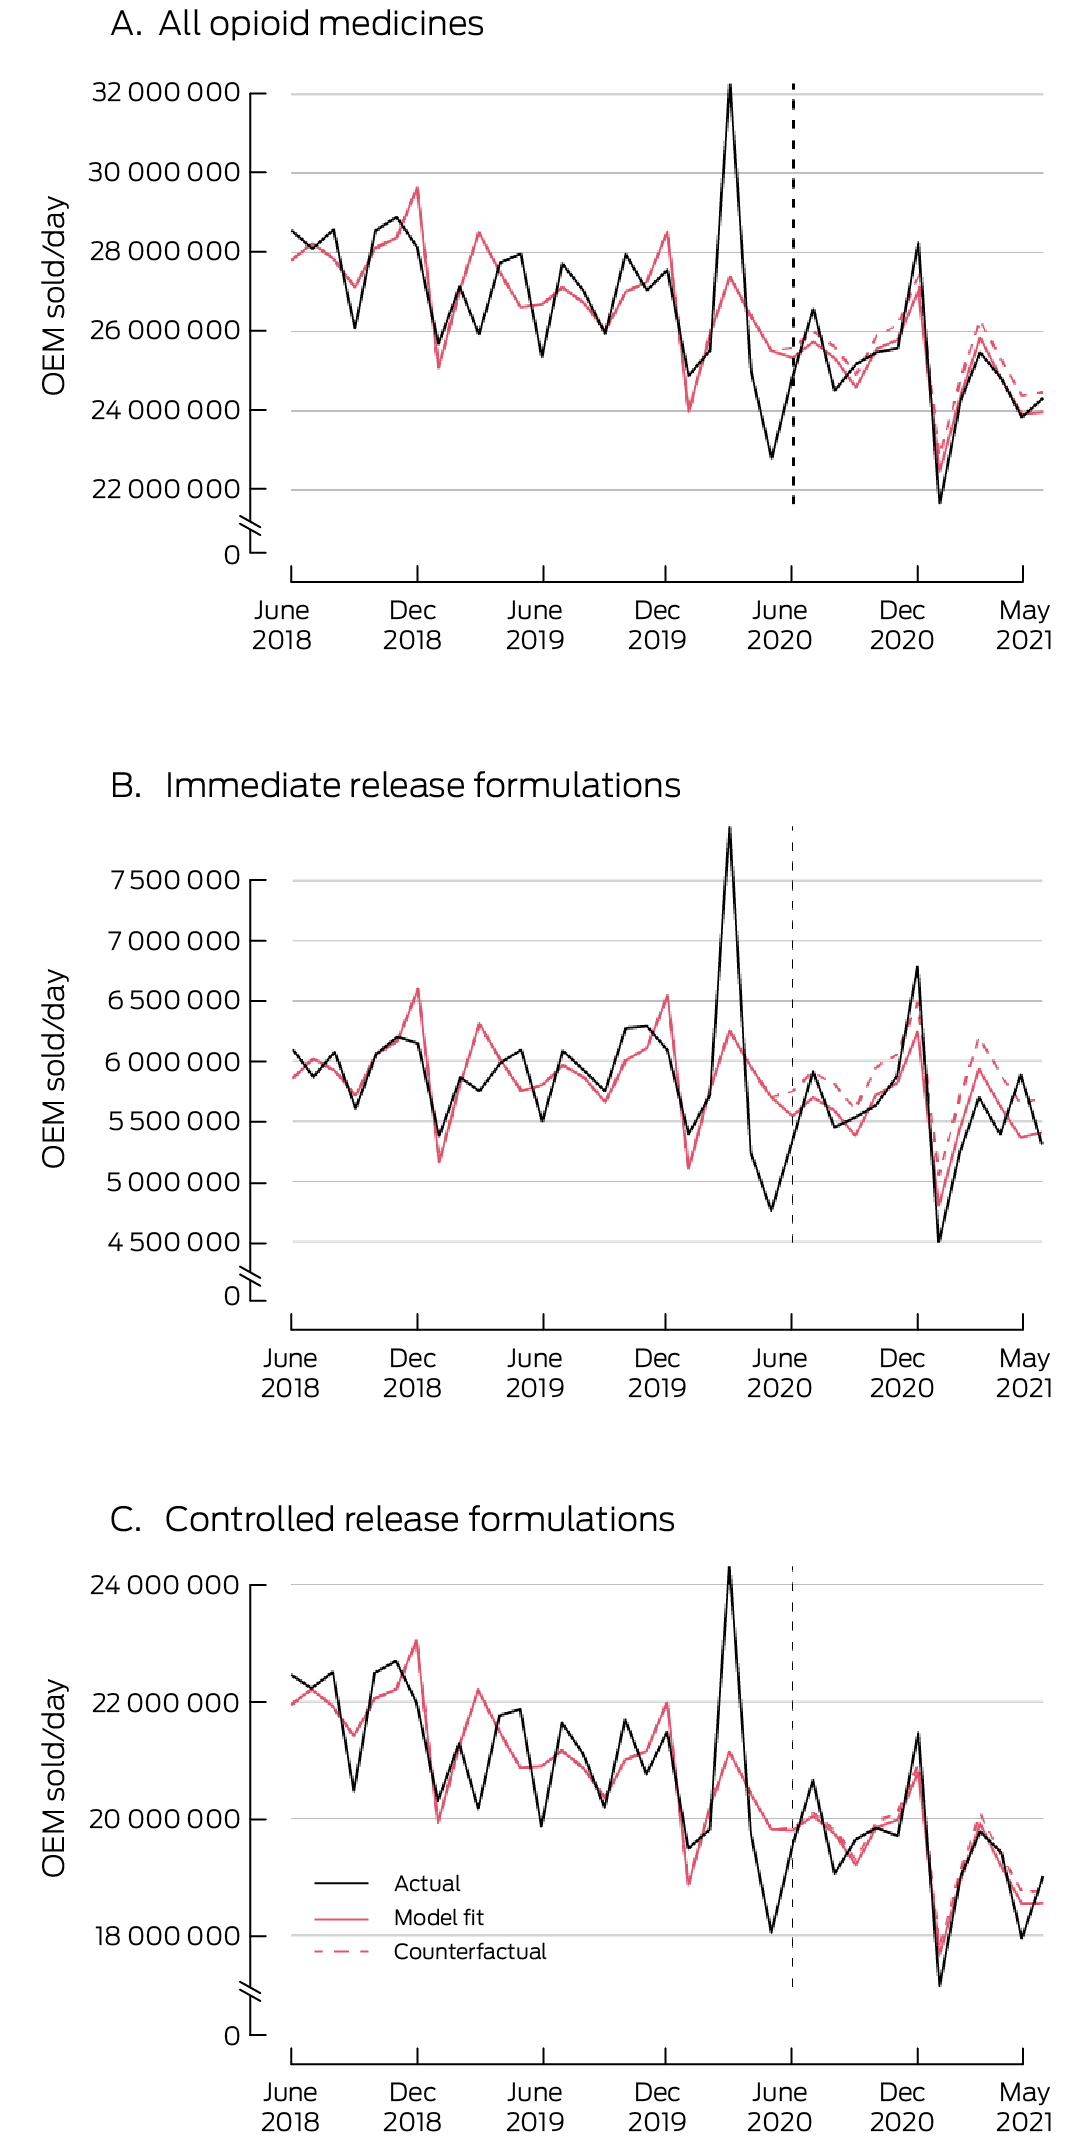
OME = oral morphine equivalent (in milligrams).* To enhance readability, graphs depict three‐week rolling means of medicine sales, based on IQVIA monthly data. Vertical lines indicate the week that the new prescribing restrictions and half‐pack sizes were introduced. The counterfactual series depicts the expected values of the series had the PBS changes not been implemented.
Box 5 – Pharmaceutical Benefits Schedule (PBS)‐subsidised dispensing of opioid medicines, Australia, 2018–21, as proportions of total sales: estimated changes associated with new PBS prescribing rules, 1 June 2020
|
|
PBS‐subsidised proportion of opioid medicines* (95% CI) |
|
|||||||||||||
|
Opioid medicine |
Prior to 1 June 2020 |
Change from 1 June 2020: percentage points |
Change from 1 June 2020: proportion |
Change in proportion: percentage points/day (95% CI) |
|||||||||||
|
|
|||||||||||||||
|
Buprenorphine CR |
90.1% (86.7–93.4%) |
0.2 (–5.4 to 5.8) |
0.2% |
–0.01 (–0.03 to 0.01) |
|||||||||||
|
Codeine IR |
40.9% (37.2–44.5%) |
1.3 (–5.2 to 7.8) |
3.2% |
–0.02 (–0.05 to 0.00) |
|||||||||||
|
Codeine/paracetamol IR |
71.2% (65.1–77.3%) |
–3.1 (–13.4 to 7.3) |
–4.3% |
–0.02 (–0.06 to 0.02) |
|||||||||||
|
Fentanyl CR |
93.1% (90.1–96.1%) |
2.8 (–2.3 to 7.9) |
3.0% |
–0.01 (–0.02 to 0.01) |
|||||||||||
|
Hydromorphone IR† |
121.4% (112.7–130.1%) |
11.1 (–3.9 to 26.1) |
9.1% |
–0.01 (–0.02 to 0.00) |
|||||||||||
|
Hydromorphone CR† |
111.9% (106.9–116.8%) |
–3.1 (–11.7 to 5.6) |
–2.7% |
0 (–0.03 to 0.03) |
|||||||||||
|
Methadone‡ |
31.5% (30.2–32.7%) |
0.1 (–2.0 to 2.3) |
0.5% |
–0.01 (–0.01 to 0.00) |
|||||||||||
|
Morphine IR |
92.1% (88.4–95.8%) |
4.4 (–1.7 to 10.5) |
4.8% |
–0.01 (–0.04 to 0.08) |
|||||||||||
|
Morphine CR |
94.2% (91.4–97.0%) |
–1.7 (–6.6 to 3.1) |
–1.8% |
0.01 (–0.01 to 0.03) |
|||||||||||
|
Oxycodone IR |
90.9% (88.0–93.8%) |
3.1 (–1.7 to 8.0) |
3.5% |
0 (–0.02 to 0.02) |
|||||||||||
|
Oxycodone CR |
93.7% (90.6–96.8%) |
1.1 (–3.8 to 6.1) |
1.2% |
0 (–0.02 to 0.02) |
|||||||||||
|
Oxycodone/naloxone |
94.9% (92.6–97.1%) |
–2.0 (–5.7 to 1.7) |
–2.1% |
–0.01 (–0.02 to 0.01) |
|||||||||||
|
Tapentadol |
92.9% (90.7–95.0%) |
–2.6 (–6.0 to 0.8) |
–2.8% |
0 (–0.01 to 0.01) |
|||||||||||
|
Tramadol IR |
83.4% (77.3–89.4%) |
–14.9 (–24.7 to –5.0) |
–17.8% |
0.01 (–0.03 to 0.04) |
|||||||||||
|
Tramadol CR |
88.6% (82.3–95.0%) |
0.6 (–9.6 to 10.8) |
0.7% |
–0.02 (–0.05 to 0.02) |
|||||||||||
|
|
|||||||||||||||
|
CI = confidence interval; CR = controlled release; IR = immediate release. * Based on oral morphine equivalent (in milligrams) dispensing and sales (model intercept). † Proportions for hydromorphone are greater than 100% as sales of this medicine are not fully captured in IQVIA data. ‡ PBS‐listed methadone formulations are not controlled release formulations, but they are regulated in the same fashion as controlled release opioid medicines. For our analysis, we classified methadone as a controlled release opioid medicine. |
|||||||||||||||
Box 6 – Pharmaceutical Benefits Schedule (PBS)‐subsidised dispensing of opioid medicines, Australia, 2018–21: proportion accounted for by repeat dispensing of prescriptions
|
|
Mean proportion |
|
|||||||||||||
|
Opioid medicine |
Before 1 June 2020 |
After 1 June 2020 |
Odds ratio (95% CI) |
||||||||||||
|
|
|||||||||||||||
|
All opioids |
7.3% |
1.2% |
0.16 (0.16–0.17) |
||||||||||||
|
All immediate release (IR) formulations |
8.2% |
0.7% |
0.08 (0.07–0.08) |
||||||||||||
|
All controlled release (CR) formulations |
6.2% |
1.9% |
0.30 (0.29–0.31) |
||||||||||||
|
Buprenorphine CR |
2.8% |
2.2% |
0.78 (0.73–0.84) |
||||||||||||
|
Codeine IR |
1.6% |
0.7% |
0.45 (0.23–0.80) |
||||||||||||
|
Codeine/paracetamol IR |
10.0% |
1.0% |
0.09 (0.09–0.10) |
||||||||||||
|
Fentanyl CR |
2.1% |
1.9% |
0.91 (0.77–1.07) |
||||||||||||
|
Hydromorphone IR |
0.9% |
0.5% |
0.59 (0.29–1.07) |
||||||||||||
|
Hydromorphone CR |
2.9% |
2.5% |
0.84 (0.63–1.11) |
||||||||||||
|
Methadone* |
6.2% |
4.5% |
0.72 (0.58–0.89) |
||||||||||||
|
Morphine IR |
0.6% |
0.3% |
0.49 (0.29–0.77) |
||||||||||||
|
Morphine CR |
2.8% |
2.0% |
0.73 (0.61–0.86) |
||||||||||||
|
Oxycodone IR |
0.4% |
0.3% |
0.84 (0.74–0.95) |
||||||||||||
|
Oxycodone CR |
1.9% |
1.6% |
0.81 (0.69–0.94) |
||||||||||||
|
Oxycodone/naloxone |
1.2% |
1.3% |
1.06 (0.98–1.15) |
||||||||||||
|
Tapentadol |
1.4% |
1.5% |
1.04 (0.95–1.15) |
||||||||||||
|
Tramadol IR |
19.8% |
0.5% |
0.02 (0.02–0.02) |
||||||||||||
|
Tramadol CR |
26.2% |
3.3% |
0.10 (0.09–0.10) |
||||||||||||
|
|
|||||||||||||||
|
CI = confidence interval. * PBS‐listed methadone formulations are not controlled release formulations, but they are regulated in the same fashion as controlled release opioid medicines. For our analysis, we classified methadone as a controlled release opioid medicine. |
|||||||||||||||
Received 5 May 2023, accepted 12 September 2023
- Forrest C Koch1
- Jake Olivier1,2
- Jonathan Brett1
- Nicholas A Buckley3
- Natasa Gisev4
- Sallie Pearson1
- Benjamin Daniels1
- 1 University of New South Wales, Sydney, NSW
- 2 Transport and Road Safety Research Centre, University of New South Wales, Sydney, NSW
- 3 The University of Sydney, Sydney, NSW
- 4 National Drug and Alcohol Research Centre, University of New South Wales, Sydney, NSW
Open access:
Open access publishing facilitated by University of New South Wales, as part of the Wiley – University of New South Wales agreement via the Council of Australian University Librarians.
*
* Equal senior authors.
See Editorial (Nielsen)
This investigation was supported by the National Health and Medical Research Council (NHMRC) Centre of Research Excellence in Medicines Intelligence (1196900). Benjamin Daniels holds a Cancer Institute NSW Early Career Fellowship (ECF1381). Jonathan Brett and Nicholas Buckley are supported by NHMRC Investigator grants (1196560, 2007726). We paid for access to IQVIA data. None of the funders had any role in the study. We acknowledge Services Australia for providing the PBS data, and IQVIA for providing the national sales data we analysed. We acknowledge the contribution of Kendal Chidwick (National Drug and Alcohol Research Centre, UNSW) for reviewing and providing feedback on our manuscript.
Sallie Pearson is a member of the Drug Utilisation Sub‐Committee of the Pharmaceutical Benefits Advisory Committee. The views expressed in this paper do not represent those of the Committee.
- 1. Richards GC, Aronson JK, Mahtani KR, Heneghan C. Global, regional, and national consumption of controlled opioids: a cross‐sectional study of 214 countries and non‐metropolitan territories. Br J Pain 2022; 16: 34‐40.
- 2. Ventafridda V, Saita L, Ripamonti C, De Conno F. WHO guidelines for the use of analgesics in cancer pain. Int J Tissue React 1985; 7: 93‐96.
- 3. Vowles KE, McEntee ML, Julnes PS, et al. Rates of opioid misuse, abuse, and addiction in chronic pain: a systematic review and data synthesis. Pain 2015; 156: 569‐576.
- 4. Degenhardt L, Charlson F, Mathers B, et al. The global epidemiology and burden of opioid dependence: results from the global burden of disease 2010 study. Addiction 2014; 109: 1320‐1333.
- 5. Levy N, Lord LJ, Lobo DN. UK recommendations on opioid stewardship. BMJ 2021; 372: m4901.
- 6. Medicines and Healthcare products Regulatory Agency. UK regulator strengthens opioid warnings [media release]. 23 Sept 2020. https://www.gov.uk/government/news/uk‐regulator‐strengthens‐opioid‐warnings (viewed May 2023).
- 7. Dave CV, Patorno E, Franklin JM, et al. Impact of state laws restricting opioid duration on characteristics of new opioid prescriptions. J Gen Inter Med 2019; 34: 2339‐2341.
- 8. Hackman HH, Young LD, Galanto D, et al. Opioid days’ supply limits: an interrupted time‐series analysis of opioid prescribing before and following a Massachusetts law. Am J Drug Alcohol Abuse 2021; 47: 350‐359.
- 9. Hincapie‐Castillo JM, Goodin A, Possinger MC, et al. Changes in opioid use after Florida's restriction law for acute pain prescriptions. JAMA Netw Open 2020; 3: e200234.
- 10. McMichael B, Michaels R, Lowy J, et al. Translation of legislation: effect analysis of Michigan opioid law on clinical practice. Ann Thorac Surg 2022; 114: 2016‐2022.
- 11. Reid DBC, Patel SA, Shah KN, et al. Opioid‐limiting legislation associated with decreased 30‐day opioid utilization following anterior cervical decompression and fusion. Spine J 2020; 20: 69‐77.
- 12. van den Brink W, Pierce M, van Amsterdam J. What lessons from Europe's experience could be applied in the United States in response to the opioid addiction and overdose crisis? Addiction 2022; 117: 1197‐1198.
- 13. Campbell G, Nielsen S, Larance B, et al. Pharmaceutical opioid use and dependence among people living with chronic pain: associations observed within the Pain and Opioids in Treatment (POINT) Cohort. Pain Med 2015; 16: 1745‐1758.
- 14. Chrzanowska A, Man N, Sutherland R, et al. Trends in overdose and other drug‐induced deaths in Australia, 1997–2020. Sydney: National Drug and Alcohol Research Centre, UNSW Sydney; 2022. https://ndarc.med.unsw.edu.au/resource‐analytics/trends‐drug‐induced‐deaths‐australia‐1997‐2020 (viewed Feb 2024).
- 15. NPS MedicineWise. Opioids: new and amended PBS listings. Reviewed 1 July 2020. https://www.nps.org.au/radar/articles/opioids‐new‐and‐amended‐pbs‐listings (viewed May 2023).
- 16. Therapeutic Goods Administration. Addressing prescription opioid use and misuse in Australia: regulatory impact self‐assessment report. 18 Sept 2019. https://www.tga.gov.au/resources/publication/publications/addressing‐prescription‐opioid‐use‐and‐misuse‐australia (viewed May 2023).
- 17. Mellish L, Karanges EA, Litchfield MJ, et al. The Australian Pharmaceutical Benefits Scheme data collection: a practical guide for researchers. BMC Res Notes 2015; 8: 634.
- 18. Schaffer AL, Cairns R, Brown JA, et al. Changes in sales of analgesics to pharmacies after codeine was rescheduled as a prescription only medicine. Med J Aust 2020; 212: 321‐327. https://www.mja.com.au/journal/2020/212/7/changes‐sales‐analgesics‐pharmacies‐after‐codeine‐was‐rescheduled‐prescription
- 19. Nielsen S, Degenhardt L, Hoban B, Gisev N. A synthesis of oral morphine equivalents (OME) for opioid utilisation studies. Pharmacoepidemiol Drug Saf 2016; 25: 733‐737.
- 20. Busingye D, Daniels B, Brett J, et al. Patterns of real‐world opioid prescribing in Australian general practice (2013–18). Aust J Prim Health 2021; 27: 416‐424.
- 21. Humphreys K, Shover CL, Andrews CM, et al. Responding to the opioid crisis in North America and beyond: recommendations of the Stanford–Lancet Commission. Lancet 2022; 399: 555‐604.
- 22. Kalkman GA, Kramers C, van den Brink W, Schellekens AFA. The North American opioid crisis: a European perspective. Lancet 2022; 400: 1404.
- 23. Mian M, Sreedharan S, Giles S. Increased dispensing of prescription medications in Australia early in the COVID‐19 pandemic. Med J Aust 2021; 214: 428‐429. https://www.mja.com.au/journal/2021/214/9/increased‐dispensing‐prescription‐medications‐australia‐early‐covid‐19‐pandemic
- 24. Storen R, Corrigan N. COVID‐19: a chronology of state and territory government announcements (up until 30 June 2020). Parliamentary Library, 22 Oct 2022. https://www.aph.gov.au/About_Parliament/Parliamentary_Departments/Parliamentary_Library/pubs/rp/rp2021/Chronologies/COVID‐19StateTerritoryGovernmentAnnouncements (viewed May 2023).
Abstract
Objectives: To evaluate the impact of the tightened Pharmaceutical Benefits Scheme (PBS) prescribing rules for immediate release (IR) and controlled release (CR) opioid medicines (1 June 2020), which also eliminated repeat dispensing without authorisation for codeine/paracetamol and tramadol IR and introduced half‐pack size item codes for IR formulations.
Design, setting: Population‐based interrupted time series analysis of PBS dispensing data claims for a 10% sample of PBS‐eligible residents and IQVIA national opioid medicine sales data (PBS‐subsidised and private prescriptions), 28 May 2018 – 6 June 2021.
Main outcome measures: Mean amount of PBS‐subsidised opioid medicines dispensed per day and mean overall amount sold per day — each expressed as oral morphine equivalent milligrams (OME) — overall, by formulation type (IR, CR), and by specific formulation.
Results: During the twelve months following the PBS changes, daily PBS‐subsidised opioid medicine dispensing was 81 565 OME lower (95% CI, –106 146 to –56 984 OME) than the mean daily level for 2018–20, a decline of 3.8% after adjusting for the pre‐intervention trend; the relative reduction was greater for IR (8.4%) than CR formulations (2.6%). Total daily sales of all, IR formulation, and CR formulation opioid medicines did not change significantly after the PBS changes. Repeat dispensing of prescriptions comprised 7.4% of PBS‐subsidised opioid dispensing before 1 June 2020, and 1.3% after the changes. Half‐pack sizes comprised 8.4% of PBS‐subsidised IR opioid medicine dispensing and 2.8% of all opioid medicines sold in the twelve months after the PBS changes.
Conclusions: The introduction of new PBS rules for subsidised opioid medicines was followed by a decline in PBS‐subsidised dispensing. Some people may have bypassed the new restrictions by switching to private prescriptions, but our findings suggest that opioid medicine use in Australia declined as a result of the new restrictions.