


The known: Implantable cardioverter–defibrillators (ICDs) can avert sudden cardiac death in people who have experienced sudden cardiac arrest or sustained ventricular arrhythmia (secondary prevention) or in people otherwise at high risk of sudden cardiac death (primary prevention).
The new: In New South Wales, insertion of first ICDs was increasing before the COVID‐19 pandemic. First insertion rates are highest for men aged 70 years or older. Device‐related adverse effects led to hospital re‐admission of 12.1% of people within twelve months of receiving their first ICDs.
The implications: Better stewardship of ICD use would be appropriate. ICDs should be offered only to people for whom the potential benefit (prevention of sudden cardiac death) outweighs the potential harm (device‐related adverse events).
Implantable cardioverter–defibrillators (ICDs) are used to manage life‐threatening ventricular arrhythmias, either by providing anti‐tachycardia pacing sequences or shock therapy. Randomised clinical trial evidence supports ICD use for secondary prevention of sudden cardiac death in people who have survived sudden cardiac arrests or other malignant sustained ventricular arrhythmias.1,2 They may also be useful for primary prevention in people who have not experienced sustained ventricular events;3 however, the relevant trials for this indication were conducted more than seventeen years ago, and their outcomes do not reflect subsequent advances in treatment.4,5 The eligibility criteria for ICD placement is a left ventricular ejection fraction (LVEF) of 35% or less despite optimal medical therapy and New York Heart Association (NYHA) functional class II or III heart failure.6,7
Increasing use of ICDs in Australia over the past two decades means that many people are living with the devices.4 Analyses of administrative data can provide insights into their longer term performance, but most studies have been limited by modest sample sizes and highly selected study populations. Few population‐based studies have examined the use of ICDs and subsequent health outcomes.8,9
We therefore explored the epidemiology of ICD use in New South Wales by using linked administrative data to determine the annual numbers of first ICD insertions performed in New South Wales hospitals during 2005–2020. We also examined health outcomes for people who first received ICDs during this period.
Methods
In our population‐based retrospective cohort study, we analysed data from linked administrative health datasets to determine the annual number of first ICD insertions in NSW hospitals during 1 January 2005 – 31 December 2020, as well as health outcomes for the people who received first ICDs during this period. We linked data from four sources:
- The NSW Admitted Patient Data Collection (APDC) collates information on all admitted patient services provided in NSW public and private hospitals, public psychiatric hospitals, public multipurpose services, and private day procedure centres. Medical procedures and interventions in public and private hospitals are coded according to the Australian Classification of Health Interventions (ACHI)10 (Supporting Information, table 1).
- The NSW Emergency Department Data Collection (EDDC) includes information on presentations to all NSW public hospital emergency departments.
- Two data sources provide information on deaths in NSW: Registry of Births, Deaths and Marriages death registrations, and Cause of Death Unit Record Files in the Australian Coordinating Registry, which also includes Australian Bureau of Statistics death registration data from before 2006.
The NSW Centre for Health Record Linkage (CheReL; https://www.cherel.org.au) undertook data linkage. The CheReL, managed by the NSW Ministry of Health, maintains a linkage system for health‐related data subject to ethical, legal, privacy, and confidentiality requirements. The CHeReL keeps a master linkage key of continuously updated links between most NSW Health datasets. Identifying information such as name, address, date of birth, and gender from each dataset is included in the master linkage key, and probabilistic record linkage applied. CHeReL reported that the false positive match rate for this project was five per 1000 records (0.5%). CHeReL provided the authors de‐identified files that included only project‐specific personal identification codes and data for pre‐specified study variables.
Study population
The study population comprised all people who received first ICDs in NSW during 1 January 2005 – 31 December 2020. We initially identified people for whom at least one public or private hospital admission with an ACHI code for ICD insertion during 1 January 2001 – 31 December 2020 was recorded in the APDC; we then selected those for whom an ICD insertion during 1 January 2005 – 31 December 2020 was recorded, but not during the four years preceding this insertion.
We identified other medical conditions for each person from the principal diagnosis procedure codes and discharge codes (up to fifty) in their hospital admission records for ICD insertions and for admissions during the five years preceding this admission (International Statistical Classification of Diseases, ninth or tenth revisions, Australian modification codes: Supporting Information, tables 2, 3). The indication for ICD insertion was based on the diagnosis in the ICD insertion hospital admission record (from highest to lowest medical priority): cardiac arrest, ventricular tachycardia, ventricular fibrillation and flutter, heart failure, and other related conditions. We defined postcode‐level socio‐economic status of residence according to the Index of Relative Socio‐economic Disadvantage (IRSD).11
Outcomes
The short term outcomes we examined were annual numbers of first ICD insertions, and re‐admissions to hospital and emergency department presentations within 30 days, 90 days, 365 days of ICD insertion. The long term outcomes we examined were all‐cause and disease‐specific mortality. We tabulated the reasons (principal diagnoses) for hospital re‐admissions and emergency department visits; we extracted all diagnosis codes, and one author with clinical training (KB) categorised these codes. Survival time was calculated from date of discharge from hospital after ICD insertion.
Data analysis
We report descriptive statistics for total numbers of ICD procedures (by ACHI code), emergency department visits (by International Classification of Diseases and Systematized Nomenclature of Medicine – Clinical Terms code) and hospitalisations (by International Classification of Diseases code), as well as for annual number of ICD procedures (insertions, replacements, adjustments, removal; by ACHI code). We included only the first ICD insertion for an individual. We summarise patient characteristics by time period (2005–2010, 2011–2015, 2016–2020) as descriptive statistics. Insertion rates were based on the NSW adult resident population for each year of the study period (Australian Bureau of Statistics);12 age‐standardised rates were based on the 2001 Australian standardised population.13 We depict the influence on long term survival of sex, age, hospital type, indication for ICD insertion, time period, and socio‐economic status quintile in Kaplan–Meier curves. We examined the influence of hospital type, hypertension, diabetes, acute myocardial infarction, smoking status, socio‐economic status quintile, and indication for ICD insertion in fitted Cox regression models; we report hazard ratios adjusted for age and sex. All analyses were performed in R 4.3.2 (R Foundation for Statistical Computing).
Ethics approval
The NSW Population and Health Service Research Ethics Committee approved the study (HREC 2019/ETH01639). Access to the datasets and reporting of analyses based on these was granted by the respective data custodians.
Results
Of 16 867 people who underwent first ICD insertions in NSW during 1 January 2005 – 31 December 2020, 14 951 people had one insertion, 1846 two insertions, and 70 people three or more insertions. A total of 89 people (0.5%) died during hospitalisations for first ICD insertions (Supporting Information, figure 1).
The overall first ICD insertion rate during 2005–2020 was 18.5 per 100 000 population. The number of first ICD insertions increased from 791 in 2005 to 1256 in 2016, before declining sharply in 2020 (first year of the coronavirus disease 2019 [COVID‐19] pandemic); the first ICD insertion crude rate increased from 15.5 in 2005 to 18.9 per 100 000 population in 2010, after which the rate was fairly stable until 2019 (Supporting Information, figure 2).
The first ICD insertion rate was higher for men than women in all years (Supporting Information, figure 3) and in all age groups; the difference was particularly marked in older age groups (Box 1). The insertion rate was highest for men aged 70–79 years in all years, peaking at 139.8 per 100 000 population in 2015; the rate for men aged 80 years or older increased from 66.7 in 2005 to 99.2 per 100 000 population in 2019 (Box 1).
The proportion of women among those who received first ICDs increased from 20.5% in 2005–2010 to 22.7% in 2015–2020, the proportion of ICDs inserted for primary prevention (ie, not after cardiac arrest or ventricular arrhythmia) increased from 44.2% to 49.9%, and the proportion of cases in which heart failure was the indication rose from 19.9% to 24.8%. The proportions of people with histories of stroke, acute myocardial infarction, or heart failure did not change markedly between the two periods. The proportion of insertions undertaken in public hospitals rose from 55.3% to 60.8%; the proportions by socio‐economic status quintile did not change substantially. The median length of hospital stay for first ICD insertion did not change; however, 8.2% of people had stays of more than 30 days during 2005–2010, but only 5.2% during 2016–2020 (Box 2).
Hospital re‐admissions and emergency department visits
Among the 16 778 people discharged from hospital alive after first ICD insertions (median follow‐up: 5.1 years; interquartile range, 2.3–8.5 years), the cumulative proportions who subsequently presented to emergency departments were 11.9% at one month, 22.4% at three months, and 54.4% at twelve months. The most frequent reasons for presentations were cardiac arrhythmias (1236 people, 7.4%), heart failure (1108 people, 6.6%), and device‐related problems (434 people, 2.6%) (Supporting Information, table 4).
The cumulative proportions of people re‐admitted to hospital were 17.0% at one month, 31.6% at three months, and 56.0% at twelve months (Box 3). The proportions of people aged 65 years or older who were re‐admitted were larger than for people under 65 years of age (twelve months: men, 60.5% v 49.0%; women, 59.9% v 51.6%) (Supporting Information, tables 5, 6). The cumulative numbers of people re‐admitted for device‐related events were 645 (3.8%) at 30 days, 1307 (7.7%) at 90 days, and 2045 (12.1%) at 365 days (Box 3). Eight of the 2045 patients re‐admitted within 365 days because of device‐related complications or disorders died during the re‐admission (median length of stay, one day; interquartile range, 0–4 days). The ICD was removed or replaced from 182 people (8.9%) re‐admitted with device‐related problems. Other causes of re‐admission within 365 days, not related to the device, included cardiac arrhythmias (1944 people, 11.5%) and heart failure (1780 people, 10.6%) (Box 3).
Mortality
A total of 5624 people who received initial ICDs during 2005–2020 (33.3%) died during follow‐up (6.7 deaths per 100 person‐years). The survival rate was 98.9% at 30 days, 94.4% at one year, 76.5% at five years, and 54.2% at ten years after discharge from the ICD insertion admission. Survival rates after first ICD insertion for secondary prevention (cardiac arrest, ventricular fibrillation, ventricular tachycardia) were 75.3% at five years and 52.9% at ten years; for primary prevention (any other indication) the rates were 77.3% at five years and 55.6% at ten years; for primary prevention in people who had experienced heart failure they were 68.9% at five years and 43.2% at ten years.
By the end of the study period, 1039 women (28.4%) and 4585 men (34.7%) who had received first ICDs had died; cardiovascular disease was the most frequent cause of death for both women (478, 13.1%) and men (2143, 16.2%) (Supporting Information, table 7). Cumulative mortality increased with age, and was higher for men than women, following insertions in public hospitals than those undertaken in private hospitals, and following insertions for which the indication was primary prevention after heart failure or secondary prevention following cardiac arrest than when the indication was ventricular tachycardia or fibrillation, or “other”. Mortality was lower during 2016–2020 (up to four years after insertion) than in the two earlier periods, and was similar across socio‐economic disadvantage levels in unadjusted analyses (Box 4). After adjusting for sex and age, mortality risk was higher among people residing in areas in the four quintiles of greatest disadvantage than among those in the quintile of least disadvantage, following insertions undertaken in public hospitals, and among people who had hypertension, diabetes, or acute myocardial infarction, or who smoked; it was also higher with all four major indications for ICD insertion than for “other” indications (Box 5).
Discussion
Our population‐based analysis of linked administrative data found that the annual number of first insertions of ICDs steadily increased in NSW during 2005–2016. Most ICD recipients were men, especially in older age groups, and the rise in annual number was most marked for men aged 80 years or older. Substantial proportions of first ICD insertions were followed by emergency department visits (54.4% of recipients) or re‐admissions to hospital (56.0% of recipients) during the twelve months after discharge from hospital. Five‐ and ten‐year survival rates after first ICD insertions were lower when the aim was primary prevention in people who had experienced heart failure (68.9% and 43.2% respectively) rather than secondary prevention (75.3% and 52.9%). Five‐year mortality was lower following first insertions during 2016–2020 (20.7%) than those during 2005–2015 (24.8%). The leading cause of death during follow‐up was cardiovascular disease, particularly ischaemic heart disease, cardiomyopathy, and heart failure.
Our finding that 7.7% of our cohort were re‐admitted to hospital within three months because of ICD device‐related events is consistent with the 90‐day post‐discharge complication rate of 7.2% reported by a 2019 Australian and New Zealand study.15 In a regional area of Australia, the 30‐day re‐admission rate for older people (median age, 80 years) after incident heart failure was about 15%;16 in our study, 18.3% of people aged 65 years or older were re‐admitted to hospital within 30 days of ICD insertion admissions (Supporting Information, tables 5, 6). Device‐related complications probably explain the higher rate we found.
The first ICD insertion rate of 20 per 100 000 population in 2019 (Supporting Information, figure 2) was higher than reported for New Zealand (2014–2017: 11.9 per 100 000 population)17 and most European Society of Cardiology countries (2016: mean, 10 per 100 000 population across 56 countries; range, 0.2 [Algeria] to 33.4 [Germany] per 100 000 population).18 The increases over time we report in the number of first ICDs inserted, both overall and for primary prevention, have also been reported in other countries.18 The sharp decline in the insertion rate in 2020 reflects health service disruptions caused by the COVID‐19 pandemic. Australia and New Zealand Cardiac Implantable Electronic Device Survey data indicate that the 2021 insertion rate was similar to that before the pandemic,19 suggesting that the decline quickly ended. The effects of delayed or not undertaken ICD insertions early in the pandemic are unknown.
The difference in first ICD insertion rates for men and women may reflect their differing risk profiles, but possibly also suboptimal treatment for women.20 Women are often under‐represented in randomised clinical trials; evaluating the risk–benefit balance of ICD therapy for women requires further study.21
Detailed chart reviews for 82 people (41 with ischaemic, 40 with non‐ischaemic cardiomyopathy) who had received ICDs in Townsville as primary prevention during 2008–2015 yielded a 5‐year survival rate of 69.5%,22 similar to the 76.5% we report. Sixty‐seven of the Queensland patients had no sustained ventricular arrhythmias that activated their devices, fifteen received appropriate shocks, and eleven had received inappropriate shocks; it was deemed that three sudden deaths from cardiac disease had been prevented by the ICDs.
We found that the number of ICDs inserted for primary prevention in older people with other major medical conditions has increased. The EU‐CERT‐ICD multicentre cohort study (2247 participants) found no survival benefit for people aged 75 years or older who received ICDs.23 This finding raises questions about the appropriateness of the growing use of ICDs for primary prevention in older NSW people; for many, the low probability of meaningful survival benefit may be outweighed by that of device‐related harms.
Implications for clinicians and policy makers
Given the increasing use of ICDs for primary prevention, including in people aged 80 years or older, clearer guidance regarding their appropriate use is needed. The potential benefits for preventing sudden cardiac death need to be balanced against the possible harms of the insertion procedure and of inappropriate shocks after insertion. The expense of ICDs also makes more selective use necessary; in 2013–14, the mean cost of the insertion procedure was about $22 000, and $47 000 should complications arise.8
Interventions that prevent adverse effects could be beneficial for people with ICDs. Further, the substantial number of emergency department presentations and hospital re‐admissions with arrhythmias, including ventricular arrhythmias, during the twelve months after ICD insertion requires further investigation, given that the primary purpose of the device is to manage sustained ventricular arrhythmias. The ventricular tachycardia (VT) rate required to activate the ICD may sometimes be set too high, rendering it less sensitive to clinically significant changes; medications that reduce heart rate also reduce the VT rate. Some people, including those with end‐stage heart failure or severe metabolic disorders, may have refractory ventricular arrhythmias; others may experience “VT storms”; ie, the device is activated by each VT episode, but the arrhythmia quickly returns.
Limitations
Our large population‐based study comprehensively assessed ICD use in NSW hospitals during 2005–2020, including about 33% of all insertions in Australia during this period.19 However, administrative data are not collected for research purposes. Further, the classification of diagnosis and procedure codes (eg, whether events were device‐related events) was to some extent subjective. We could not investigate whether or how often inserted ICDs were activated, appropriately or inappropriately, nor how people were managed after re‐admission to hospital, as this information was not included in the analysed datasets. Consequently, and also because our study design did not include a control group, we could not evaluate the benefits and harms of ICD use. Finally, we may have underestimated the frequency of complications, as the NSW hospital dataset would not include information on the later outcomes of people who moved interstate after the insertion. As we used national datasets to estimate mortality, our mortality estimates are not subject to this problem.
Conclusion
The clinical criteria for deciding which older people need ICDs, especially among those with heart failure, are imprecise. Prognostic and predictive factors beyond reduced left ventricular function need to be identified and risk prediction tools developed to guide clinical practice,24,25 preferably in high quality prospective, population‐based cohort studies.
Box 1 – Implantable cardioverter–defibrillator first insertion rates, New South Wales, 2005–2020 by sex and age*
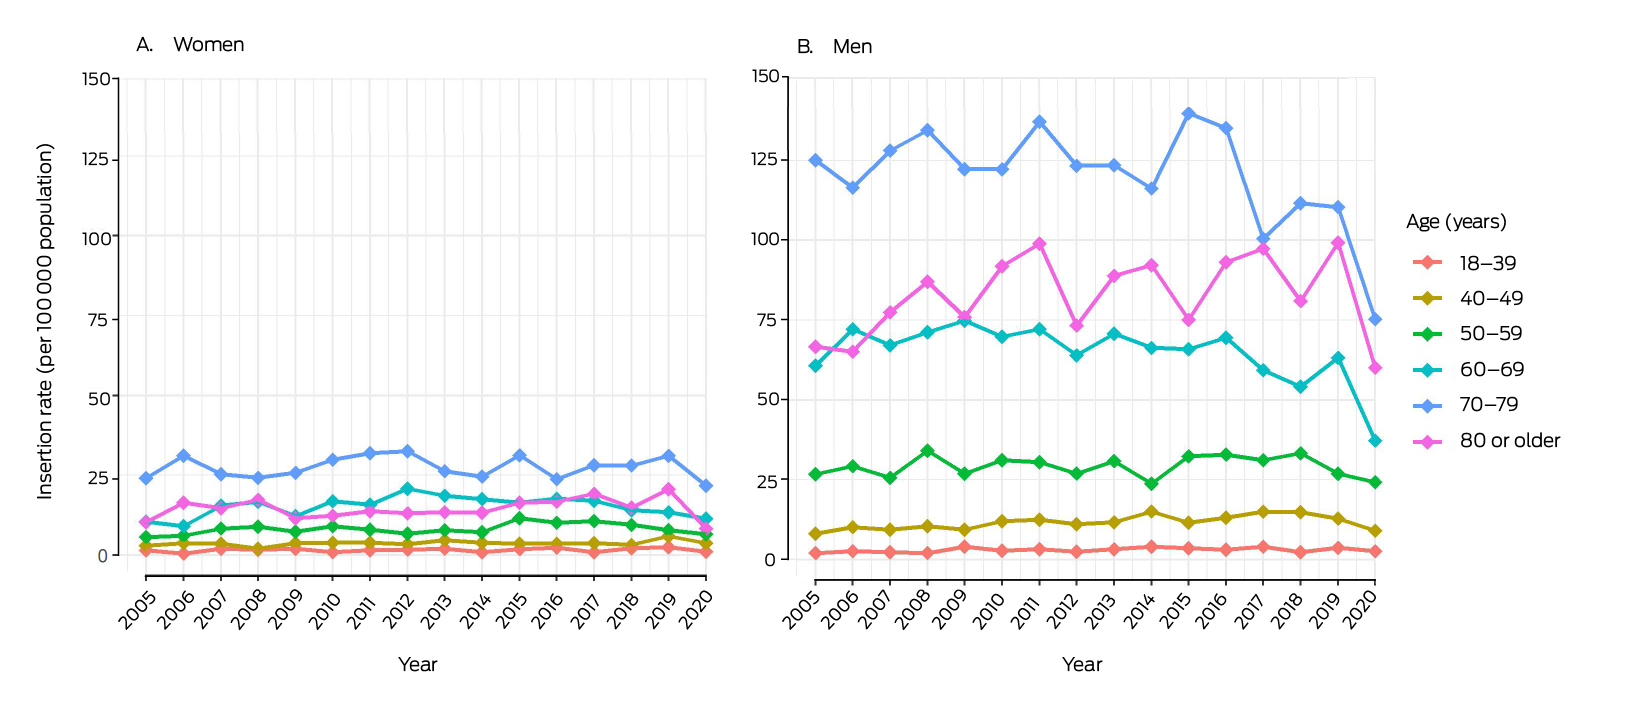
* The denominators for rates are the number of people by age–sex group resident in New South Wales for each year (Australian Bureau of Statistics).12
Box 2 – Characteristics of people who received first implantable cardioverter–defibrillators in New South Wales during 2005–2020, by time period
|
Characteristic |
2005–2010 |
2011–2015 |
2016–2020 |
2005–2020 |
|||||||||||
|
|
|||||||||||||||
|
Number of insertions |
5574 |
5597 |
5696 |
16 867 |
|||||||||||
|
Insertion rate (per 100 000 population) |
|
|
|
|
|||||||||||
|
Crude |
17.6 |
20.9 |
18.4 |
18.5 |
|||||||||||
|
Age‐standardised |
17.2 |
18.3 |
16.8 |
17.4 |
|||||||||||
|
Sex |
|
|
|
|
|||||||||||
|
Women |
1143 (20.5%) |
1218 (21.8%) |
1292 (22.7%) |
3653 (21.7%) |
|||||||||||
|
Men |
4431 (79.5%) |
4379 (78.2%) |
4404 (77.3%) |
13 214 (78.3%) |
|||||||||||
|
Age (years), mean (SD) |
65.6 (13.1) |
65.7 (13.4) |
65.8 (13.9) |
65.7 (13.5) |
|||||||||||
|
18–39 |
271 (4.9%) |
286 (5.1%) |
309 (5.4%) |
866 (5.1%) |
|||||||||||
|
40–49 |
393 (7.1%) |
409 (7.3%) |
438 (7.7%) |
1240 (7.4%) |
|||||||||||
|
50–59 |
948 (17%) |
875 (15.6%) |
933 (16.4%) |
2756 (16.3%) |
|||||||||||
|
60–69 |
1562 (28%) |
1609 (28.7%) |
1458 (25.6%) |
4629 (27.4%) |
|||||||||||
|
70–79 |
1800 (32.3%) |
1773 (31.7%) |
1812 (31.8%) |
5385 (31.9%) |
|||||||||||
|
80 or older |
600 (10.8%) |
645 (11.5%) |
746 (13.1%) |
1991 (11.8%) |
|||||||||||
|
Hospital type |
|
|
|
|
|||||||||||
|
Private |
2491 (44.7%) |
2337 (41.8%) |
2230 (39.2%) |
7058 (41.8%) |
|||||||||||
|
Public |
3083 (55.3%) |
3260 (58.2%) |
3466 (60.8%) |
9809 (58.2%) |
|||||||||||
|
Medical history |
|
|
|
|
|||||||||||
|
Hypertension |
3419 (61.3%) |
2887 (51.6%) |
1603 (28.1%) |
7909 (46.9%) |
|||||||||||
|
Stroke |
259 (4.6%) |
286 (5.1%) |
271 (4.8%) |
816 (4.8%) |
|||||||||||
|
Acute myocardial infarction |
1478 (26.5%) |
1299 (23.2%) |
1423 (25.0%) |
4200 (24.9%) |
|||||||||||
|
Heart failure |
2281 (40.9%) |
2412 (43.1%) |
2379 (41.8%) |
7072 (41.9%) |
|||||||||||
|
Diabetes |
1393 (25%) |
1308 (23.4%) |
1619 (28.4%) |
4320 (25.6%) |
|||||||||||
|
Smoker |
3369 (60.4%) |
3362 (60.1%) |
3311 (58.1%) |
10 042(59.5%) |
|||||||||||
|
Prevention type |
|
|
|
|
|||||||||||
|
Primary prevention |
2464 (44.2%) |
2825 (50.5%) |
2845 (49.9%) |
8134 (45.3%) |
|||||||||||
|
Secondary prevention |
3110 (55.8%) |
2772 (49.5%) |
2851 (50.1%) |
8733 (54.7%) |
|||||||||||
|
Treatment indication |
|
|
|
|
|||||||||||
|
Cardiac arrest |
526 (9.4%) |
526 (9.4%) |
538 (9.4%) |
1590 (9.4%) |
|||||||||||
|
Ventricular tachycardia |
2199 (39.5%) |
1874 (33.5%) |
1934 (34%) |
6007 (35.6%) |
|||||||||||
|
Ventricular fibrillation and flutter |
372 (6.7%) |
344 (6.1%) |
303 (5.3%) |
1019 (6%) |
|||||||||||
|
Heart failure |
1109 (19.9%) |
1334 (23.8%) |
1413 (24.8%) |
3856 (22.9%) |
|||||||||||
|
Other |
1368 (24.5%) |
1519 (27.1%) |
1508 (26.5%) |
4395 (26.1%) |
|||||||||||
|
Length of stay (days), median (IQR) |
5 (1–13) |
4 (1–11) |
4 (1–11) |
4 (1–12) |
|||||||||||
|
1 |
1583 (28.4%) |
2003 (35.8%) |
2011 (35.3%) |
5597 (33.2%) |
|||||||||||
|
2–6 |
1547 (27.8%) |
1376 (24.6%) |
1391 (24.4%) |
4314 (25.6%) |
|||||||||||
|
7–13 |
1122 (20.1%) |
1070 (19.1%) |
1126 (19.8%) |
3318 (19.7%) |
|||||||||||
|
14–30 |
865 (15.5%) |
699 (12.5%) |
869 (15.3%) |
2433 (14.4%) |
|||||||||||
|
More than 30 |
457 (8.2%) |
449 (8%) |
299 (5.2%) |
1205 (7.1%) |
|||||||||||
|
Socio‐economic disadvantage (quartile)* |
|
|
|
|
|||||||||||
|
1 (most disadvantaged) |
845 (15.5%) |
851 (15.5%) |
794 (14.2%) |
2490 (15.1%) |
|||||||||||
|
2 |
950 (17.4%) |
1116 (20.3%) |
1050 (18.8%) |
3116 (18.8%) |
|||||||||||
|
3 |
1315 (24.1%) |
1199 (21.8%) |
1308 (23.4%) |
3822 (23.1%) |
|||||||||||
|
4 |
1192 (21.9%) |
1186 (21.6%) |
1328 (23.7%) |
3706 (22.4%) |
|||||||||||
|
5 (most advantaged) |
1146 (21.0%) |
1139 (20.7%) |
1114 (19.9%) |
3399 (20.6%) |
|||||||||||
|
|
|||||||||||||||
|
IQR = interquartile range; SD = standard deviation. * Index of Relative Socio‐Economic Disadvantage (IRSD) scores for Statistical Local Areas (2011) level 4:14 quartile 1 (most disadvantaged): 927.0 or less; quartile 2: 927.1–965.8; quartile 3: 965.9–1001.8; quartile 4: 1001.9–1056.0; quartile 5 (least disadvantaged): greater than 1056.0. IRSD data were not available for 334 participants. |
|||||||||||||||
Box 3 – People who received first implantable cardioverter–defibrillators in New South Wales during 2005–2020 and were subsequently re‐admitted to hospital*
|
|
Time from discharge after insertion of implantable cardioverter–defibrillator |
||||||||||||||
|
Re‐admission reason† |
30 days |
90 days |
365 days |
||||||||||||
|
|
|||||||||||||||
|
All causes |
2871 (17.0%) |
5324 (31.6%) |
9433 (56.0%) |
||||||||||||
|
Device‡ |
645 (3.8%) |
1307 (7.7%) |
2045 (12.1%) |
||||||||||||
|
Device‐related complication/disorder |
588 (3.5%) |
1224 (7.3%) |
1882 (11.2%) |
||||||||||||
|
Device surgery‐related |
57 (0.3%) |
83 (0.5%) |
163 (1.0%) |
||||||||||||
|
Heart failure |
413 (2.5%) |
858 (5.1%) |
1780 (10.6%) |
||||||||||||
|
Cardiac arrhythmias§ |
430 (2.6%) |
923 (5.5%) |
1944 (11.5%) |
||||||||||||
|
Cardiac arrest |
10 (0.1%) |
16 (0.1%) |
40 (0.2%) |
||||||||||||
|
Ventricular fibrillation |
18 (0.1%) |
30 (0.2%) |
75 (0.4%) |
||||||||||||
|
Ventricular tachycardia |
122 (0.7%) |
259 (1.5%) |
564 (3.3%) |
||||||||||||
|
Atrial fibrillation |
156 (0.9%) |
377 (2.3%) |
737 (4.4%) |
||||||||||||
|
Supraventricular tachycardia |
11 (0.1%) |
27 (0.2%) |
69 (0.4%) |
||||||||||||
|
Not specified |
113 (0.7%) |
214 (1.3%) |
459 (2.7%) |
||||||||||||
|
Ischaemic heart disease |
161 (1.0%) |
345 (2.0%) |
816 (4.8%) |
||||||||||||
|
Chest pain |
159 (0.9%) |
300 (1.8%) |
714 (4.2%) |
||||||||||||
|
Cardiomyopathy |
74 (0.4%) |
185 (1.1%) |
423 (2.5%) |
||||||||||||
|
Septicaemia |
53 (0.3%) |
100 (0.6%) |
238 (1.4%) |
||||||||||||
|
Cerebrovascular diseases |
33 (0.2%) |
63 (0.4%) |
167 (1.0%) |
||||||||||||
|
Other cardiovascular disease |
19 (0.1%) |
40 (0.2%) |
116 (0.7%) |
||||||||||||
|
|
|||||||||||||||
|
* For the 16 778 people discharged from hospital alive after first insertions of implantable cardioverter‐defibrillators. Re‐admissions by sex are reported in the Supporting Information, tables 5 and 6. † Multiple diagnoses possible, but each specific diagnosis counted only once per person. ‡ We used a hierarchical approach to counting device‐related re‐admissions, such that only one was counted per person: device‐related complication/disorder, device surgery‐related. § We used a hierarchical approach to counting specific types of cardiac arrhythmia, such that only one was counted per person: cardiac arrest, ventricular fibrillation, ventricular tachycardia, atrial fibrillation, supraventricular tachycardia, not specified. |
|||||||||||||||
Box 4 – Cumulative all‐cause mortality for 16 867 people who received first implantable cardioverter–defibrillators in New South Wales during 2005–2020, by characteristic
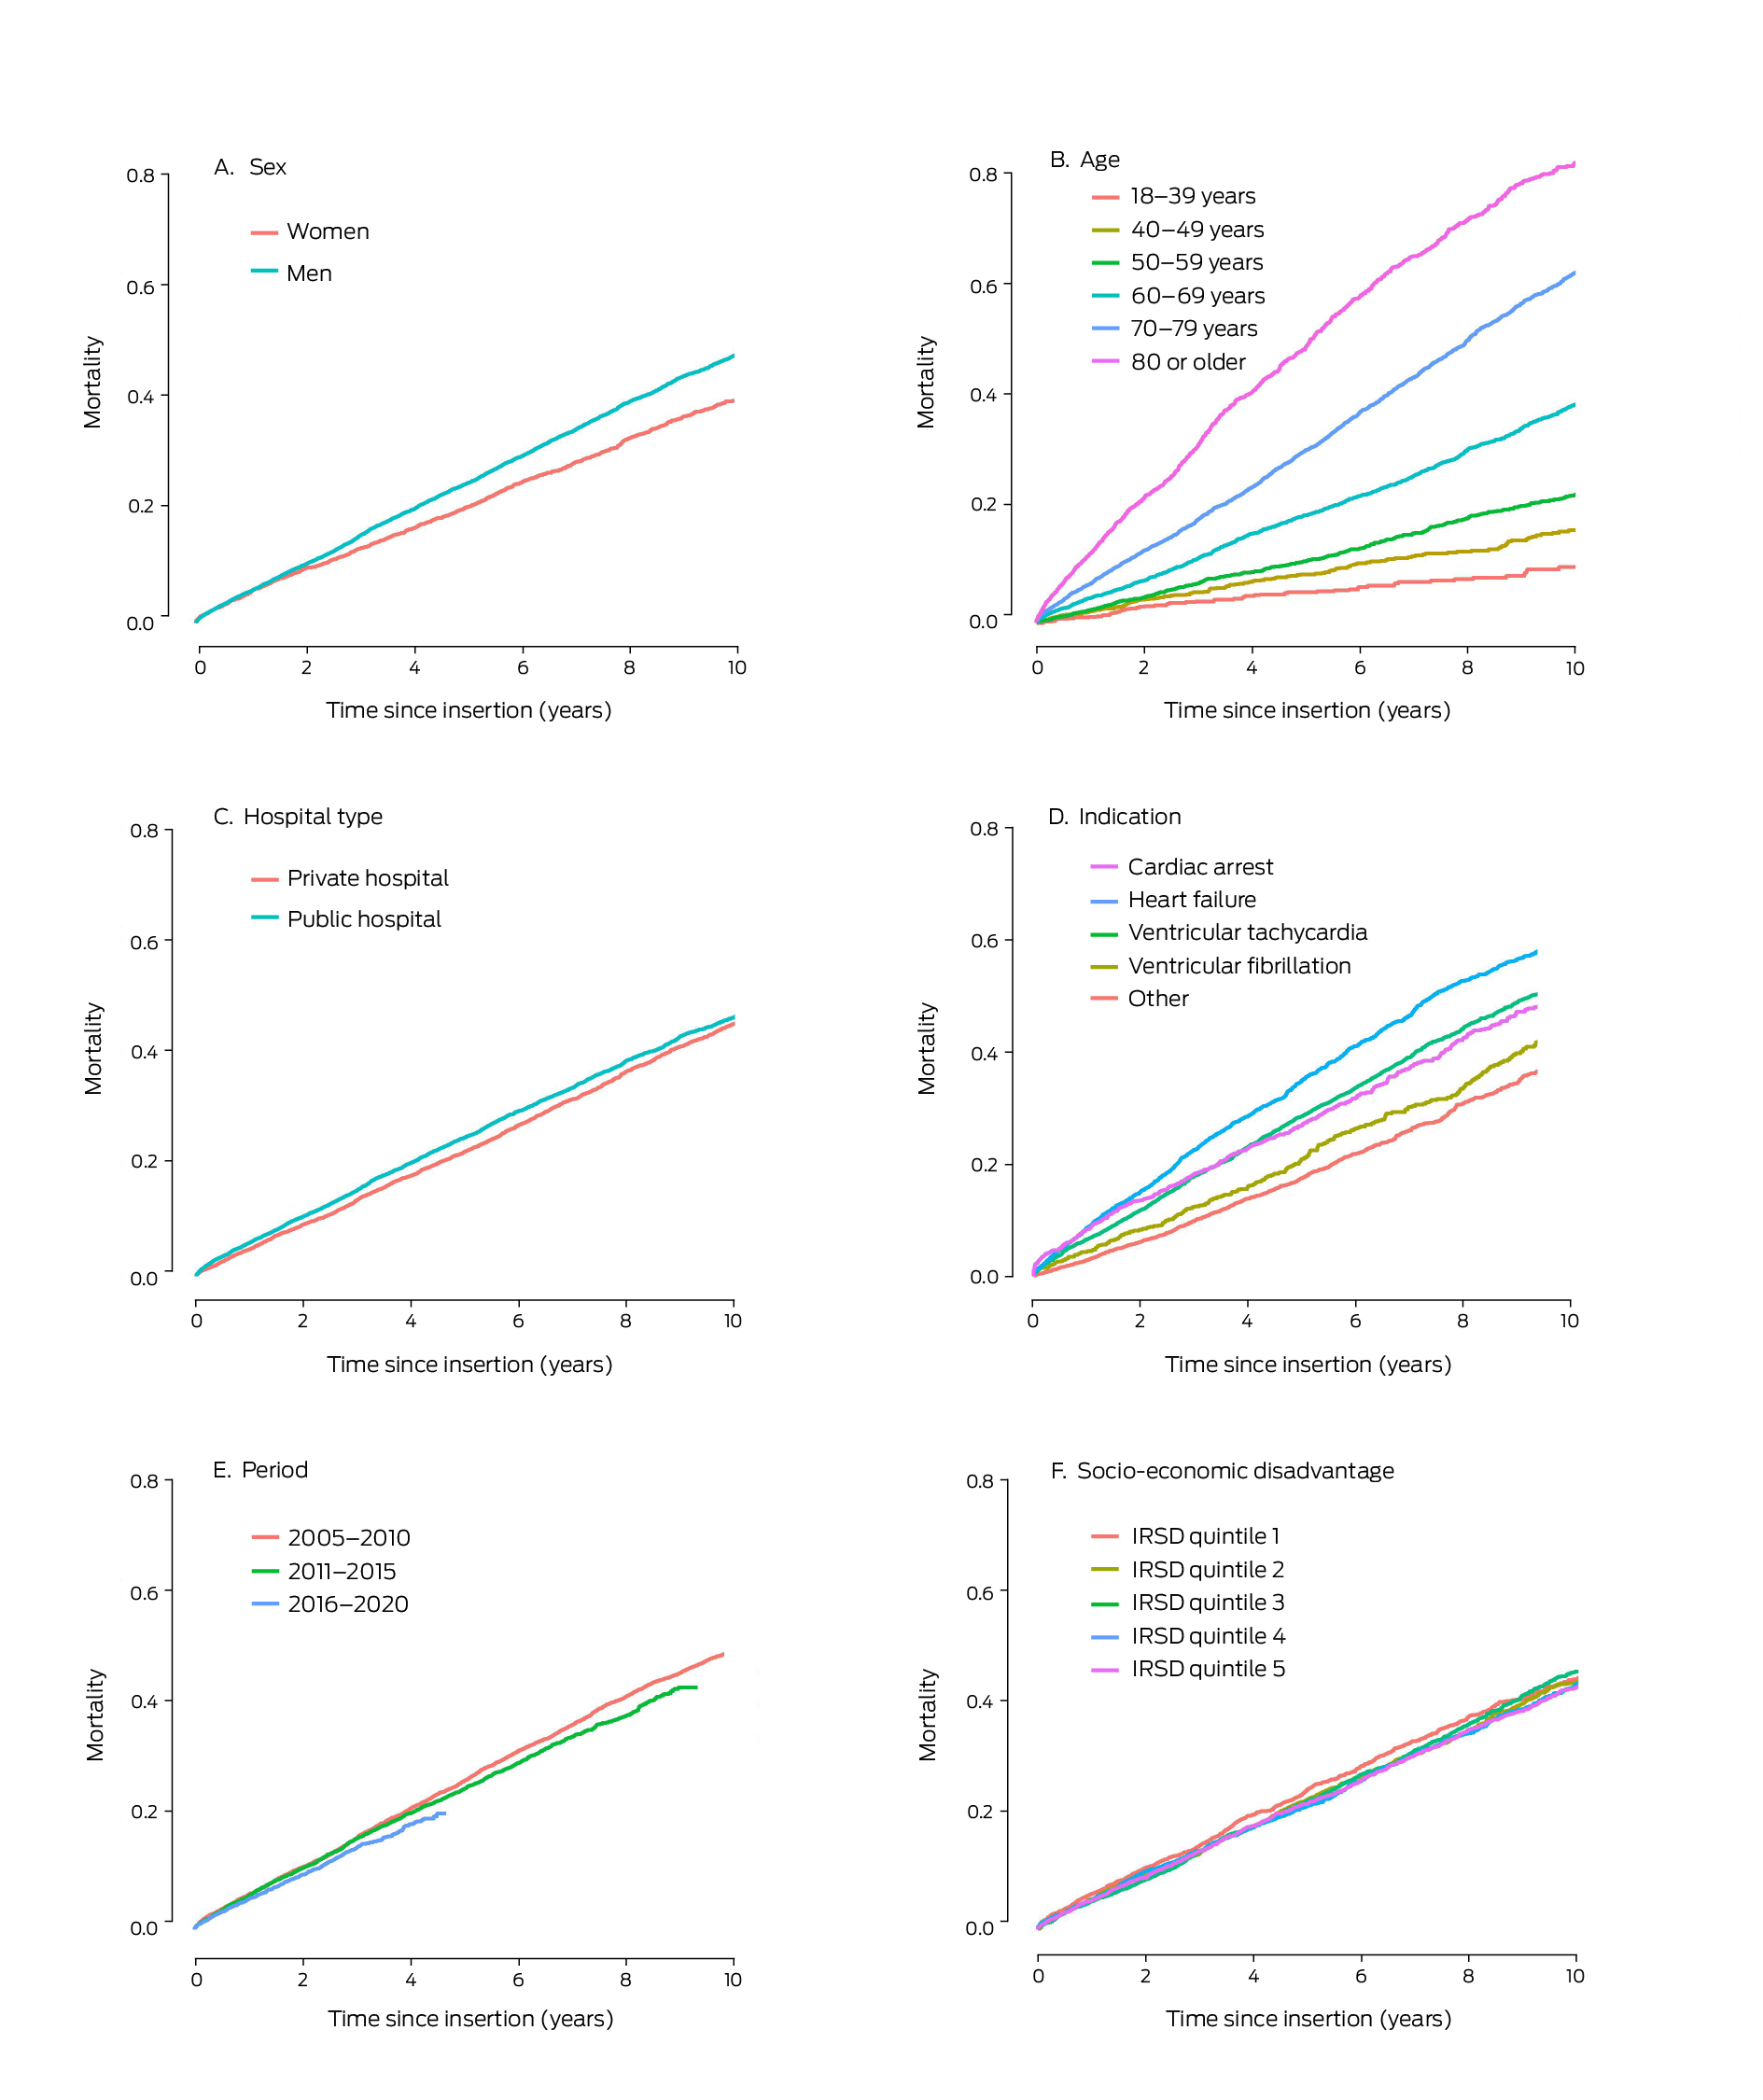
IRSD = Index of Relative Socio‐Economic Disadvantage. IRSD data were unavailable for 334 people.
Box 5 – Influence of selected factors on mortality risk for 16 867 people who received first implantable cardioverter–defibrillators in New South Wales during 2005–2020: Cox regression analysis
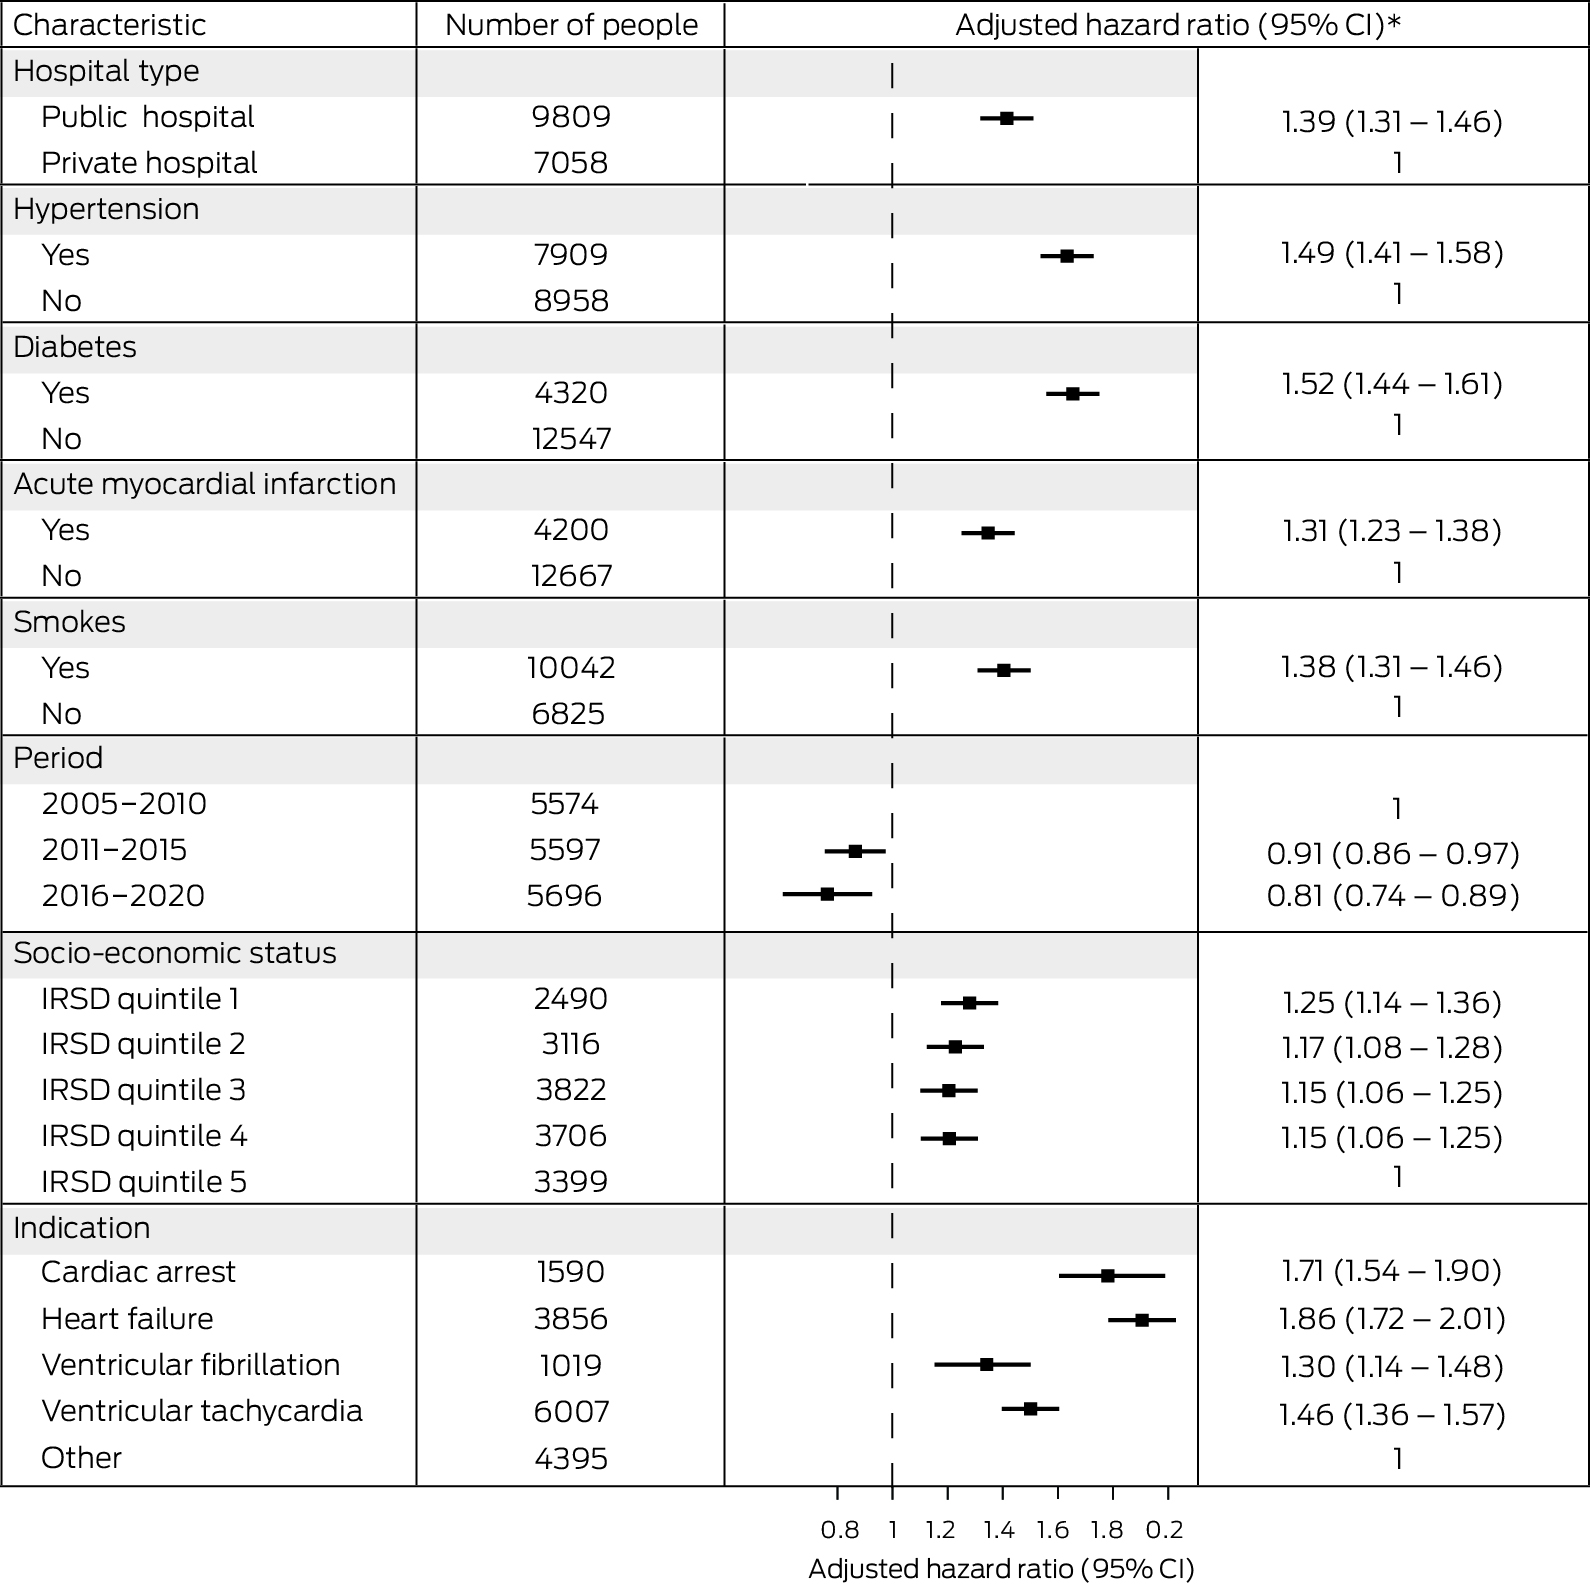
* Adjusted for age and sex.CI = confidence interval; IRSD = Index of Relative Socio‐Economic Disadvantage. IRSD data were unavailable for 334 people.
Received 11 August 2023, accepted 11 December 2023
- Lin Zhu1
- Andrew Hayen2
- Bianca Blanch1
- Nathan Engstrom3,4
- Jenny A Doust5
- Christopher Semsarian6
- Katy JL Bell1
- 1 The University of Sydney, Sydney, NSW
- 2 University of Technology Sydney, Sydney, NSW
- 3 James Cook University, Townsville, QLD
- 4 Townsville Hospital and Health Service, Townsville, QLD
- 5 The University of Queensland, Brisbane, QLD
- 6 Agnes Ginges Centre for Molecular Cardiology, Centenary Institute, University of Sydney, Sydney, NSW
Open access:
Open access publishing facilitated by The University of Sydney, as part of the Wiley – The University of Sydney agreement via the Council of Australian University Librarians.
Data sharing:
The study protocol is available on request to the corresponding author. Access to the data and analysis files is permitted only with the explicit permission of the approving human research ethics committees and the data custodians. Analysis of linked data is currently authorised at only one location.
Christopher Semsarian is supported by a National Health and Medical Research Council (NHMRC) Investigator Grant (2016822) and a NSW Health Cardiovascular Disease Clinician Scientist Grant. Katy Bell is supported by an NHMRC Investigator Grant (1174523). The funding source played no role in the study design, data collection, analysis or interpretation, reporting, or publication.
We thank the New South Wales Ministry of Health, the Centre for Health Record Linkage, the Cancer Institute NSW, and other data custodians for reviewing the project protocol, approving the project, and providing the requested data. The Cause of Death Unit Record File was provided by the Australian Coordinating Registry on behalf of the NSW Registry of Births, Deaths and Marriages, the NSW Coroner, and the National Coronial Information System.
No relevant disclosures.
- 1. Connolly S, Hallstrom AP, Cappato R, et al. Meta‐analysis of the implantable cardioverter defibrillator secondary prevention trials. Eur Heart J 2000; 21: 2071‐2078.
- 2. Epstein AE, DiMarco JP, Ellenbogen KA, et al; Writing Committee to Revise the ACC/AHA/NASPE 2002 guideline update for implantation of cardiac pacemakers and antiarrhythmia devices. ACC/AHA/HRS 2008 guidelines for device‐based therapy of cardiac rhythm abnormalities: a report of the American College of Cardiology/American Heart Association Task Force on Practice Guidelines. J Am Coll Cardiol 2008; 51: e1‐e62.
- 3. Ezekowitz JA, Armstrong PW, McAlister FA. Implantable cardioverter defibrillators in primary and secondary prevention. Ann Intern Med 2003; 138: 445‐452.
- 4. Bradshaw PJ, Stobie P, Briffa T, Hobbs MST. Use and long‐term outcomes of implantable cardioverter‐defibrillators, 1990 to 2009. Am Heart J 2013; 165: 816‐822.
- 5. Wong B, McDonald K, Keane D. Time to rechallenge primary prevention ICD guidelines. ESC Heart Fail 2022; 9: 3694‐3697.
- 6. Engstrom N, Dobson G, Ng K, Letson H. Fragmented QRS is associated with ventricular arrhythmias in heart failure patients: A systematic review and meta‐analysis. Ann Noninvasive Electrocardiol 2022; 27: e12910.
- 7. NHFA CSANZ Heart Failure Guidelines Working Group; Atherton JJ, Sindone A, De Pasquale CG, et al. National Heart Foundation of Australia and Cardiac Society of Australia and New Zealand: guidelines for the prevention, detection, and management of heart failure in Australia 2018. Heart Lung Circ 2018; 27: 1123‐1208.
- 8. Blanch B, Lago LP, Sy R, et al. Implantable cardioverter–defibrillator therapy in Australia, 2002–2015. Med J Aust 2018; 209: 123‐129. https://www.mja.com.au/journal/2018/209/3/implantable‐cardioverter‐defibrillator‐therapy‐australia‐2002‐2015
- 9. Bansal N, Szpiro A, Reynolds K, et al. Long‐term outcomes associated with implantable cardioverter defibrillator in adults with chronic kidney disease. JAMA Intern Med 2018; 178: 390‐398.
- 10. National Centre for Classification in Health. Australian classification of health interventions ACHI (11th edition). Sydney: Independent Hospital Pricing Authority, 2019.
- 11. Australian Bureau of Statistics. Index of Relative Socio‐economic Disadvantage (IRSD). In: Socio‐Economic Indexes for Areas (SEIFA), Australia, 2021. 27 Apr 2023. https://www.abs.gov.au/statistics/people/people‐and‐communities/socio‐economic‐indexes‐areas‐seifa‐australia/2021#index‐of‐relative‐socio‐economic‐disadvantage‐irsd‐ (viewed Jan 2024).
- 12. Australian Bureau of Statistics. National, state and territory population. Reference period March 2023. 14 Sept 2023. https://www.abs.gov.au/statistics/people/population/national‐state‐and‐territory‐population/latest‐release (viewed Oct 2023).
- 13. Australian Bureau of Statistics. Which population to use for age standardisation? In: Australian demographic statistics, Mar 2013 (3101.0). 26 Sept 2013. https://www.abs.gov.au/ausstats/abs@.nsf/Lookup/3101.0Feature+Article1Mar%202013 (viewed Jan 2024).
- 14. Australian Bureau of Statistics. Australian standard geographical classification (ASGC), 2011. Updated 21 Mar 2023. https://www.abs.gov.au/ausstats/abs@.nsf/PrimaryMainFeatures/1216.0.15.001?OpenDocument (viewed Jan 2024).
- 15. Ranasinghe I, Labrosciano C, Horton D, et al. Institutional variation in quality of cardiovascular implantable electronic device implantation. Ann Intern Med 2019; 171: 309‐317.
- 16. Al‐Omary MS, Majeed T, Al‐Khalil H, et al. Patient characteristics, short‐term and long‐term outcomes after incident heart failure admissions in a regional Australian setting. Open Heart 2022; 9: e001897.
- 17. Foo FS, Lee M, Looi K, et al; ANZACS‐QI investigators. Implantable cardioverter defibrillator and cardiac resynchronization therapy use in New Zealand (ANZACS‐QI 33). J Arrhythm 2020; 36: 153‐163.
- 18. Raatikainen MJP, Arnar DO, Merkely B, et al. A decade of information on the use of cardiac implantable electronic devices and interventional electrophysiological procedures in the European Society of Cardiology countries: 2017 report from the European Heart Rhythm Association. Europace 2017; 19 (Suppl 2): ii1‐ii90.
- 19. Mond HG, Crozier I, Sloman JG. The Australian and New Zealand cardiac implantable electronic device survey, calendar year 2021: 50‐year anniversary. Heart Lung Circ 2023; 32: 261‐268.
- 20. Rau Steuernagel C, Lam CSP, Greenhalgh T. Countering sex and gender bias in cardiovascular research requires more than equal recruitment and sex disaggregated analyses. BMJ 2023; 382: e075031.
- 21. Vogel B, Acevedo M, Appelman Y, et al. The Lancet women and cardiovascular disease Commission: reducing the global burden by 2030. Lancet 2021; 397: 2385‐2438.
- 22. Engstrom N, Dobson GP, Ng K, Letson HL. Primary prevention implantable cardiac defibrillators: a Townsville district perspective. Front Cardiovasc Med 2020; 7: 577248.
- 23. Zabel M, Willems R, Lubinski A, et al; EU‐CERT‐ICD Study Investigators. Clinical effectiveness of primary prevention implantable cardioverter‐defibrillators: results of the EU‐CERT‐ICD controlled multicentre cohort study. Eur Heart J 2020; 41: 3437‐3447.
- 24. Wolff RF, Moons KGM, Riley RD, et al; PROBAST Group. PROBAST: a tool to assess the risk of bias and applicability of prediction model studies. Ann Intern Med 2019; 170: 51‐58.
- 25. Collins GS, Reitsma JB, Altman DG, Moons KGM. Transparent Reporting of a multivariable prediction model for Individual Prognosis or Diagnosis (TRIPOD): the TRIPOD statement. Ann Intern Med 2015; 162: 55‐63.
Abstract
Objectives: To determine the annual numbers of first ICD insertions in New South Wales during 2005–2020; to examine health outcomes for people who first received ICDs during this period.
Study design: Retrospective cohort study; analysis of linked administrative health data.
Setting, participants: All first insertions of ICDs in NSW, 2005–2020.
Main outcome measures: Annual numbers of first ICD insertions, and of emergency department presentations and hospital re‐admissions 30 days, 90 days, 365 days after first ICD insertions; all‐cause and disease‐specific mortality (to ten years after ICD insertion).
Results: During 2005–2020, ICDs were first inserted into 16 867 people (18.5 per 100 000 population); their mean age was 65.7 years (standard deviation, 13.5 years; 7376 aged 70 years or older, 43.7%), 13 214 were men (78.3%). The annual number of insertions increased from 791 in 2005 to 1256 in 2016; the first ICD insertion rate increased from 15.5 in 2005 to 18.9 per 100 000 population in 2010, after which the rate was stable until 2019 (19.8 per 100 000 population). Of the 16 778 people discharged alive from hospital after first ICD insertions, 54.4% presented to emergency departments within twelve months, including 1236 with cardiac arrhythmias (7.4%) and 434 with device‐related problems (2.6%); 56% were re‐admitted to hospital, including 1944 with cardiac arrhythmias (11.5%) and 2045 with device‐related problems (12.1%). A total of 5624 people who received first ICDs during 2005–2020 (33.3%) died during follow‐up (6.7 deaths per 100 person‐years); the survival rate was 94.4% at one year, 76.5% at five years, and 54.2% at ten years.
Conclusions: The annual number of new ICDs inserted in NSW has increased since 2005. A substantial proportion of recipients experience device‐related problems that require re‐admission to hospital. The potential harms of ICD insertion should be considered when assessing the likelihood of preventing fatal ventricular arrhythmia.