


The known Implantable cardioverter–defibrillators (ICDs) are life-saving devices that prevent sudden cardiac death.
The new ICD procedure numbers are increasing in Australia. The highest rates are for people aged 70 or more; 90% of patients are over 35. ICD devices were removed from an average of one young, eight middle-aged and six older people each month during 2014–15. ICD-related hospitalisation procedures cost an estimated $154 555 814 in 2013–14.
The implications Further investigations are needed to determine whether increasing rates of ICD therapy reflect evidence-based management decisions, to characterise the population receiving ICDs, and to quantify patterns of care and patient outcomes.
Implantable cardioverter–defibrillators (ICDs) are life-saving devices that prevent sudden cardiac death.1 The ICD is surgically inserted under the chest wall to monitor cardiac rhythm, and, in the event of life-threatening ventricular arrhythmias, delivers an electric shock. In accordance with the results of key clinical trials,2,3 ICD therapy is recommended for patients at the greatest risk of sudden cardiac death; it is also recommended as secondary prevention for out-of-hospital cardiac arrest survivors, a patient group at clearly increased risk. Indications for ICD therapy as primary prevention are based on disease-specific guidelines that are imperfect; most sudden deaths are of patients deemed to be at low risk.4
When making decisions about recommending ICD therapy, a clinician must weigh its life-saving benefits against the potential harms, including those associated with its surgical insertion, the need for ongoing 6-monthly device interrogations (functional checking), and battery replacement every 8–10 years. Patients with ICDs are at risk of inappropriate shocks, infection, lead fracture, thrombosis, and device or lead recall, which may result in ICD removal or adjustment procedures. The psychosocial burden includes greater risk of device-related anxiety5 and post-traumatic stress after a shock.6 From a public health perspective, ICD therapy is associated with high costs after any appropriate or inappropriate shock,7 although they are yet to be quantified in Australia.
It has been reported that ICDs are both under- and overused in certain populations. For example, several studies have found only 13–40% of patients who meet guidelines for ICD therapy received it prior to a sudden cardiac event.8,9 On the other hand, a recent American study found that as many as 23% of ICD insertions are inconsistent with clinical guidelines and identified an increased risk of adverse outcomes, including in-hospital death and post-surgical infection.10
The use of ICDs has increased in many countries.11 In Australia, two studies that quantified ICD procedure numbers by analysing routinely collected health data12,13 found a marked increase in the numbers of insertion and replacement procedures over the past 20 years. No Australian studies have quantified the costs of ICD therapy or the rates of adverse procedures (including removal) and complications. We therefore quantified the number of procedures in Australia by year, patient age, and sex, and estimated age group-specific population rates and the associated costs.
Methods
Setting
Australia has a publicly funded, universal health care system that provides its citizens and permanent residents with a range of subsidised health services, including treatment in public and private hospitals. In 2014, the estimated population of Australia was 23.5 million people.14
Data source
Since July 1993, the National Hospital Morbidity Database (NHMD) has recorded diagnoses and procedures for all hospitalisations in Australia. Data for most public and private hospitals are supplied to the Australian Institute of Health and Welfare (AIHW) for inclusion in the NHMD by each Australian state and territory, including public and private acute, public and private psychiatric, and private free-standing day hospitals.15 NHMD data are aggregated and freely available.16,17
In 2012–13, 9.4 million hospital separations from public and private hospitals were reported to the NHMD.18 The NHMD defines a hospital separation as the completion of treatment for an admitted patient because of death, discharge, or transfer to another facility or care type (eg, from an acute to a rehabilitation service). A record is created at each hospital separation; if a person has several admissions for the same medical procedure, each separation has a unique NHMD record. However, NHMD records are not linked, meaning we cannot determine the total number of people in the dataset or whether an individual was hospitalised several times or underwent more than one procedure during a given period. Hospital separations are recorded by financial year (ie, 1 July – 30 June). The NHMD includes limited patient demographic information, including sex (male, female) and age at time of hospital separation by age group.
After each hospital separation, a hospital coder records all procedures and diagnoses during the hospitalisation according to the Australian Classification of Health Interventions (ACHI; since 2000).19 The diagnosis and procedure codes are combined with other variables, such as length of stay and age, to categorise separations according to the Australian refined diagnosis-related groups (AR-DRG) classification system (since 1997).20
Australian Classification of Health Interventions
The ACHI is the Australian national standard for coding medical procedures and interventions in public and private hospitals.19 Twenty procedure classification chapters are subdivided into subchapters, block numbers, and procedure numbers. The ACHI system records all procedures during a hospitalisation; one hospitalisation may include several procedure codes. We refer to ICD procedures defined by ACHI codes as “procedures”.
Australian refined diagnosis-related groups
The AR-DRG classification encompasses 23 major diagnostic categories, subdivided into medical, surgical and other groupings.20 The AR-DRG procedure code for the procedure associated with the highest average cost is recorded for each hospitalisation. We refer to ICD procedures defined by AR-DRG codes as “hospitalisations”.
Hospitalisation costs for ICD procedures
The Independent Hospital Pricing Authority determines the average cost of admitted patient episodes of care in Australian public hospitals according to AR-DRG classifications.21 States and territories submit cost data to the National Hospital Cost Data Collection annually. Those costs, aggregated from micro-costs for all health care resources consumed (including length of stay, pharmaceuticals, prosthetics and devices, pathology, imaging, medical input, nursing), inform activity-based funding of services in Australia. In 2013–14, the average cost of a hospitalisation for each ICD procedure was:
-
$46 730 for episodes grouped to ICD insertion or replacement procedures with catastrophic complication or comorbidity (AR-DRG F01A);
-
$22 191 for episodes grouped to ICD insertion or replacement procedures without catastrophic complication or comorbidity (AR-DRG F01B); and
-
$13 890 for episodes grouped to other ICD procedures (AR-DRG F02Z; ICD procedures other than insertions or replacements).21
Statistical analysis
For the period July 2002 – June 2014, we report annual descriptive statistics for the total annual number of ICD procedures (by ACHI code) and hospitalisations (by AR-DRG code) and the annual numbers of ICD procedures (insertions, replacements, adjustments, removal; by ACHI code). We also stratified the annual number of procedures by age group (0–34, 35–69, 70 or more years) and sex. We report the number of procedures associated with complications. We used Australian Bureau of Statistics population estimates (June 2014)14 to calculate the annual population and age group-specific rates of ICD procedures from 2002 to 2014 and annual numbers of hospitalisations for ICD procedures. For the 3-year period July 2011 – June 2014, we estimated the annual hospitalisation costs associated with ICD procedures according to Independent Hospital Pricing Authority costings. All analyses were conducted in Excel for Mac 2011 (Microsoft); graphs were constructed in Prism 7 for Mac (GraphPad).
Ethics approval
As we analysed aggregated, de-identified data, ethics approval was not required for this study.
Results
ICD procedures and hospitalisations
From July 2002 to June 2014, there were 39 410 ICD insertion, 16 493 replacement, 1275 adjustment and 1809 removal procedures. More than 75% of procedures were in men; more than 90% of patients were aged 35 years or more (Box 1, Box 2, Box 3, Box 4).
Between 2002–03 and 2014–15, the annual number of ICD procedures increased from 1844 to 6504 (Box 5); the population-adjusted rate increased from 7.9 to 27.7 procedures per 100 000 persons. The number of insertions increased by 216% (from 1332 to 4208), of replacements by 411% (from 393 to 2007), of adjustments by 98% (from 55 to 109), and of removals by 181% (from 64 to 180) (Box 1, Box 2, Box 3, Box 4, Box 5).
Between 2002–03 and 2014–15, the annual number of hospitalisations for an ICD procedure increased from 1837 to 6235 (Box 6). The proportion of hospitalisations associated with severe or catastrophic complications or comorbidity declined from 45% in 2002–03 to 19% in 2014–15; coding change in 2009 may have contributed to this decline (see ) (Box 6).
Demographic characteristics of patients
The procedure rates for all ICD procedure types were higher for people aged 70 years or more than for younger age groups. In 2014–15, for example, the population rate of ICD insertion was 17.9 procedures per 100 000 persons; the rate for people aged 70 years or more was 78.1 procedures per 100 000 persons (Box 1).
Only small proportions of ICD insertion (3–5%), replacement (2–5%), adjustment (2–10%) and removal (6–13%) procedures were undertaken in patients under 34 years of age. However, rates in this age group increased between 2002–03 and 2014–15: from 0.64 to 1.40 per 100 000 persons for insertions, from 0.18 to 0.63 per 100 000 persons for ICD replacements, from 0.03 to 0.05 per 100 000 persons for adjustments, and from 0.07 to 0.16 per 100 000 persons for removals (Box 1, Box 2, Box 3, Box 4).
Specific ICD procedures
The rate of ICD insertion procedures increased from 5.68 in 2002–03 to 17.9 per 100 000 persons in 2014–15. Most patients were men (77–83%); most were aged 35–69 years (53–56%) (Box 1).
The rate of ICD replacement procedures increased from 1.67 in 2002–03 to 8.55 per 100 000 persons in 2014–15. Most patients were men (75–80%); between 2002–03 and 2005–06, 47–51% were aged 35–69 years; from 2006–07, most replacements were in patients aged 70 years or more (51–54%) (Box 2).
The rate of ICD adjustment procedures increased from 0.23 in 2002–03 to 0.46 per 100 000 persons in 2014–15. Most patients were men (67–80%); most were more than 35 years old (35–69 years, 45–55%; 70 years or more, 35–50%) (Box 3).
The rate of ICD removal procedures increased from 0.27 in 2002–03 to 0.77 per 100 000 persons in 2014–15. Most patients were men (70–86%); most were aged 35–69 years (52–64%) (Box 4).
Costs
During 2011–12 to 2013–14, the estimated average cost of an ICD procedure with complications decreased from $48 296 to $46 730, and for an ICD procedure without complications from $23 177 to $22 191. The cost of “other ICD procedures” (ICD procedures other than insertions and replacements) increased from $11 493 to $13 890. The total annual costs of hospitalisations for any ICD procedure increased from $144 036 822 to $154 555 814 (7% increase), and the combined cost over 3 years was $445 644 566 (Box 7).
Discussion
The numbers and rates of all types of ICD procedures increased in Australia between 2002–03 and 2014–15. During the 3 years for which cost data were available (2011–12 to 2013–14) total ICD hospitalisation costs increased by 7%. Population procedure rates were highest in people aged 70 years or more and lowest in those under 35. It is unclear whether the overall increase in procedure rates reflected an increasing need for ICD therapy, or was a direct result of increased awareness of risk factors for sudden death. Publication of the results of the Sudden Cardiac Death in Heart Failure Trial (SCD-HeFT) in 20022 and Multicenter Automatic Defibrillator Implantation Trial II (MADIT-II) in 2005,3 as well as of several disease-specific and ICD guideline documents have probably influenced the increased use of ICDs. Our data indicate a gradual change in practice in Australia rather than a sharp increase in use.
We found that complication rates for ICD insertion and replacement procedures declined markedly from 2002–03 to 2014–15. The most notable decline was from 2009–10 to 2010–11, coinciding with a change in coding. Prior to 2009, a complication was defined as being severe or catastrophic; since 2010, only catastrophic events are recorded as complications. The declining number of complications between 2006–07 and 2009–10, prior to the coding change, may be related to growing clinician experience. Specifically, greater surgical experience has been associated with a lower complication rate;22 complication rates are lower for electrophysiologists, general cardiologists, and cardiothoracic surgeons than for general surgeons.23 The modest reduction in the average cost of ICD insertions and replacements may likewise be explained by growing competency and improvements in the device technology.
The highest rates of ICD insertion, replacement, adjustment and removal procedures are for people aged 70 years or more; we estimate that 41% of insertions were for patients in this age group. However, it is estimated that only 25% of clinical trial participants are aged 75 years or more, so there is relatively limited clinical evidence regarding benefits and harms in this population.24 ICD therapy is as clinically beneficial for older as for younger patients,25 but mortality after ICD insertion is higher among older patients.26,27 Assessment of the benefit of ICD therapy for older patients must take into account their relative risks of death from sudden cardiac death and from other causes.28 A patient-centred approach to care, including discussing the benefits and risks of ICD therapy with the patient and their family, is essential. The proportion of women among patients undergoing ICD procedures is relatively small (about 20%); the possibility that ICD therapy is underused in female patients should be investigated. Earlier studies in an older population of ICD recipients found that women were more likely to meet ICD criteria than men, but this did not apply to younger ICD recipients.29
The increased rate of ICD removal procedures was unexpected. During 2002–14, the number of ICD removals was equivalent to at least 4% of the number of insertions each year, and at least 3% of the number of insertions and replacements. In 2014–15, ICDs were removed from an average of one young, eight middle-aged, and six older patients each month (Box 4). Device deactivations, which do not require surgery, are not captured in these data. The most frequent reasons for ICD removal are post-surgical infection (clinically accepted infection rate: 1%), device malfunction, misdiagnosis of a heart condition, or lack of clinical benefit.30,31 The unexpectedly high rate of removals should be a priority for investigation.
The estimated overall cost of ICD procedures during 2011–14 was about $446 million dollars. ICD use, when evidence-based, is more cost-effective than standard care in terms of quality-adjusted life-years gained.32 We are fortunate to have an evidence-based method for preventing sudden cardiac death, and not offering this potentially life-saving therapy could be catastrophic; for some patients, there will be no second chance to revise their management plan. Ascertaining whether some procedures are unnecessary or decisions are non-evidence-based is not easy. The heterogeneity, unpredictability, and poor outcomes of patients with cardiac arrest make decisions about treatment particularly challenging.
Limitations
The NHMD relies on hospital coders entering data for principal diagnoses accurately and consistently; the standard of coding is indeed high in Australia.33 We may have underestimated the number of ICD procedures, as data collection from some facilities was not consistent across the observation period; in the online Appendix, we have listed all changes to ACHI and AR-DRG codes and edition updates during the observation period that may explain some fluctuations in procedure numbers between years. We based our cost estimates for 2011–14 on Independent Hospital Pricing Authority estimates of the average cost of hospitalisation per procedure in public hospitals. As procedures in private hospitals are generally more expensive, we may have underestimated overall hospitalisation costs. We based our population estimates on Australian population data for June 2014, and rates for early years may have been underestimated.
Conclusion
ICDs are life-saving devices that prevent sudden cardiac death. It has been reported overseas that ICDs are both under- and overused in people with cardiac disease. We found that ICD procedures, which incur significant costs to the hospital system, are becoming more frequent in Australia. Analyses of routinely collected whole-of-population and person-level data are required to further assess the positive and negative consequences of ICD therapy.
Box 1 – Implantable cardioverter–defibrillator (ICD) insertion procedures (Australian Classification of Health Intervention codes), 2002–15, by age group
|
Year |
ICD insertion procedures |
Procedures for people |
Procedures for people aged |
Procedures for people aged |
|||||||||||
|
Number |
Rate |
Men |
Number |
Rate |
Number |
Rate |
Number |
Rate |
|||||||
|
|
|||||||||||||||
|
2002–03 |
1332 |
5.68 |
1109 (83%) |
70 (5%) |
0.64 |
752 (56%) |
7.43 |
510 (38%) |
21.8 |
||||||
|
2003–04 |
1688 |
7.19 |
1395 (83%) |
80 (5%) |
0.73 |
949 (56%) |
9.37 |
629 (37%) |
26.9 |
||||||
|
2004–05 |
2577 |
11.0 |
2058 (80%) |
94 (4%) |
0.85 |
1452 (56%) |
14.3 |
1031 (40%) |
44.2 |
||||||
|
2005–06 |
2758 |
11.8 |
2224 (81%) |
118 (4%) |
1.07 |
1557 (56%) |
15.4 |
1083 (39%) |
46.4 |
||||||
|
2006–07 |
2909 |
12.4 |
2328 (80%) |
107 (4%) |
0.97 |
1628 (56%) |
16.1 |
1174 (40%) |
50.3 |
||||||
|
2007–08 |
3096 |
13.2 |
2439 (79%) |
112 (4%) |
1.02 |
1688 (55%) |
16.7 |
1296 (42%) |
55.5 |
||||||
|
2008–09 |
3383 |
14.4 |
2673 (79%) |
102 (3%) |
0.93 |
1865 (55%) |
18.4 |
1416 (42%) |
60.6 |
||||||
|
2009–10 |
3198 |
13.6 |
2550 (80%) |
135 (4%) |
1.23 |
1786 (56%) |
17.6 |
1277 (40%) |
54.7 |
||||||
|
2010–11 |
3513 |
15.0 |
2732 (78%) |
141 (4%) |
1.28 |
1927 (55%) |
19.0 |
1445 (41%) |
61.9 |
||||||
|
2011–12 |
3588 |
15.3 |
2823 (79%) |
135 (4%) |
1.23 |
1927 (54%) |
19.0 |
1526 (43%) |
65.4 |
||||||
|
2012–13 |
3510 |
15.0 |
2710 (77%) |
128 (4%) |
1.16 |
1926 (55%) |
19.0 |
1456 (41%) |
62.4 |
||||||
|
2013–14 |
3650 |
15.6 |
2861 (78%) |
174 (5%) |
1.58 |
1988 (54%) |
19.6 |
1488 (41%) |
63.7 |
||||||
|
2014–15 |
4208 |
17.9 |
3319 (79%) |
154 (4%) |
1.40 |
2230 (53%) |
22.0 |
1824 (43%) |
78.1 |
||||||
|
Total |
39 410 |
|
31 221 (79%) |
1550 (3%) |
|
21 675 (55%) |
|
16 155 (41%) |
|
||||||
|
|
|||||||||||||||
|
* Population (June 2014): 23 464 086 people.14 † Population (June 2014): 11 002 174 people.14 ‡ Population (June 2014): 10 127 051 people.14 § Population (June 2014): 2 334 861 people.14 |
|||||||||||||||
Box 2 – Implantable cardioverter–defibrillator (ICD) replacement procedures (Australian Classification of Health Intervention codes), 2002–15, by age group
|
Year |
ICD replacement procedures |
Procedures for people |
Procedures for people |
Procedures for people |
|||||||||||
|
Number |
Rate |
Men |
Number |
Rate |
Number |
Rate |
Number |
Rate |
|||||||
|
|
|||||||||||||||
|
2002–03 |
393 |
1.67 |
294 (75%) |
20 (5%) |
0.18 |
201 (51%) |
1.98 |
172 (44%) |
7.37 |
||||||
|
2003–04 |
550 |
2.34 |
431 (78%) |
21 (4%) |
0.19 |
287 (52%) |
2.83 |
242 (44%) |
10.4 |
||||||
|
2004–05 |
654 |
2.79 |
520 (80%) |
24 (4%) |
0.22 |
310 (47%) |
3.06 |
320 (49%) |
13.7 |
||||||
|
2005–06 |
738 |
3.15 |
574 (78%) |
28 (4%) |
0.25 |
370 (50%) |
3.65 |
340 (46%) |
14.6 |
||||||
|
2006–07 |
832 |
3.55 |
656 (79%) |
30 (4%) |
0.27 |
369 (44%) |
3.64 |
433 (52%) |
18.6 |
||||||
|
2007–08 |
1044 |
4.45 |
801 (77%) |
35 (3%) |
0.32 |
477 (46%) |
4.71 |
532 (51%) |
22.8 |
||||||
|
2008–09 |
1276 |
5.44 |
999 (78%) |
46 (4%) |
0.42 |
574 (45%) |
5.67 |
656 (51%) |
28.1 |
||||||
|
2009–10 |
1378 |
5.87 |
1084 (79%) |
47 (3%) |
0.43 |
616 (45%) |
6.08 |
715 (52%) |
30.6 |
||||||
|
2010–11 |
1622 |
6.91 |
1265 (78%) |
53 (3%) |
0.48 |
748 (46%) |
7.39 |
821 (51%) |
35.2 |
||||||
|
2011–12 |
1780 |
7.59 |
1413 (79%) |
58 (3%) |
0.53 |
788 (44%) |
7.78 |
934 (52%) |
40.0 |
||||||
|
2012–13 |
2090 |
8.91 |
1632 (78%) |
44 (2%) |
0.40 |
918 (44%) |
9.06 |
1128 (54%) |
48.3 |
||||||
|
2013–14 |
2129 |
9.07 |
1634 (77%) |
51 (2%) |
0.46 |
934 (44%) |
9.22 |
1144 (54%) |
49.0 |
||||||
|
2014–15 |
2007 |
8.55 |
1517 (76%) |
64 (3%) |
0.63 |
918 (46%) |
9.06 |
1025 (51%) |
43.9 |
||||||
|
Total |
16 493 |
|
12 820 (78%) |
521 (3%) |
|
7510 (46%) |
|
8462 (51%) |
|
||||||
|
|
|||||||||||||||
|
* Population (June 2014): 23 464 086 people.14 † Population (June 2014): 11 002 174 people.14 ‡ Population (June 2014): 10 127 051 people.14 § Population (June 2014): 2 334 861 people.14 |
|||||||||||||||
Box 3 – Implantable cardioverter–defibrillator (ICD) adjustment procedures (Australian Classification of Health Intervention codes), 2002–15, by age group
|
Year |
ICD adjustment procedures |
Procedures for people |
Procedures for people |
Procedures for people |
|||||||||||
|
Number |
Rate |
Men |
Number |
Rate |
Number |
Rate |
Number |
Rate |
|||||||
|
|
|||||||||||||||
|
2002–03 |
55 |
0.23 |
43 (78%) |
3 (5%) |
0.03 |
27 (49%) |
0.27 |
25 (45%) |
1.07 |
||||||
|
2003–04 |
79 |
0.34 |
59 (75%) |
2 (3%) |
0.02 |
41 (52%) |
0.40 |
36 (46%) |
1.54 |
||||||
|
2004–05 |
81 |
0.35 |
55 (68%) |
5 (6%) |
0.05 |
38 (47%) |
0.38 |
36 (44%) |
1.54 |
||||||
|
2005–06 |
91 |
0.39 |
71 (78%) |
4 (4%) |
0.04 |
43 (47%) |
0.42 |
44 (48%) |
1.88 |
||||||
|
2006–07 |
103 |
0.44 |
77 (75%) |
2 (2%) |
0.02 |
50 (49%) |
0.49 |
51 (50%) |
2.18 |
||||||
|
2007–08 |
81 |
0.35 |
59 (73%) |
6 (7%) |
0.06 |
43 (53%) |
0.42 |
32 (40%) |
1.37 |
||||||
|
2008–09 |
99 |
0.42 |
70 (71%) |
10 (10%) |
0.10 |
54 (55%) |
0.53 |
35 (35%) |
1.50 |
||||||
|
2009–10 |
119 |
0.51 |
86 (72%) |
9 (8%) |
0.09 |
56 (47%) |
0.55 |
54 (45%) |
2.31 |
||||||
|
2010–11 |
119 |
0.51 |
95 (80%) |
7 (6%) |
0.07 |
56 (47%) |
0.55 |
56 (47%) |
2.40 |
||||||
|
2011–12 |
107 |
0.46 |
86 (80%) |
5 (5%) |
0.05 |
58 (54%) |
0.57 |
44 (41%) |
1.88 |
||||||
|
2012–13 |
122 |
0.52 |
91 (75%) |
3 (2%) |
0.03 |
60 (49%) |
0.59 |
59 (48%) |
2.53 |
||||||
|
2013–14 |
110 |
0.47 |
74 (67%) |
6 (5%) |
0.06 |
52 (47%) |
0.51 |
52 (47%) |
2.23 |
||||||
|
2014–15 |
109 |
0.46 |
78 (72%) |
5 (5%) |
0.05 |
49 (45%) |
0.48 |
55 (50%) |
2.36 |
||||||
|
Total |
1275 |
|
944 (74%) |
67 (5%) |
|
627 (49%) |
|
579 (45%) |
|
||||||
|
|
|||||||||||||||
|
* Population (June 2014): 23 464 086 people.14 † Population (June 2014): 11 002 174 people.14 ‡ Population (June 2014): 10 127 051 people.14 § Population (June 2014): 2 334 861 people.14 |
|||||||||||||||
Box 4 – Implantable cardioverter–defibrillator (ICD) removal procedures (Australian Classification of Health Intervention codes), 2002–15, by age group
|
Year |
ICD removal procedures |
Procedures for people |
Procedures for people |
Procedures for people |
|||||||||||
|
Number |
Rate |
Men |
Number |
Rate |
Number |
Rate |
Number |
Rate |
|||||||
|
|
|||||||||||||||
|
2002–03 |
64 |
0.27 |
45 (70%) |
8 (13%) |
0.07 |
41 (64%) |
0.40 |
15 (23%) |
0.64 |
||||||
|
2003–04 |
77 |
0.33 |
64 (83%) |
5 (6%) |
0.05 |
49 (64%) |
0.48 |
23 (30%) |
0.99 |
||||||
|
2004–05 |
103 |
0.44 |
83 (81%) |
8 (8%) |
0.07 |
64 (62%) |
0.63 |
31 (30%) |
1.33 |
||||||
|
2005–06 |
144 |
0.61 |
116 (81%) |
8 (6%) |
0.07 |
77 (53%) |
0.76 |
59 (41%) |
2.53 |
||||||
|
2006–07 |
154 |
0.66 |
130 (84%) |
17 (11%) |
0.15 |
84 (55%) |
0.83 |
53 (34%) |
2.27 |
||||||
|
2007–08 |
168 |
0.72 |
131 (78%) |
12 (7%) |
0.11 |
104 (62%) |
1.03 |
52 (31%) |
2.23 |
||||||
|
2008–09 |
141 |
0.60 |
121 (86%) |
9 (6%) |
0.08 |
77 (55%) |
0.76 |
55 (39%) |
2.36 |
||||||
|
2009–10 |
147 |
0.63 |
124 (84%) |
9 (6%) |
0.08 |
90 (61%) |
0.89 |
48 (33%) |
2.06 |
||||||
|
2010–11 |
158 |
0.67 |
135 (85%) |
10 (6%) |
0.09 |
84 (53%) |
0.83 |
64 (41%) |
2.74 |
||||||
|
2011–12 |
151 |
0.64 |
121 (80%) |
11 (7%) |
0.10 |
87 (58%) |
0.86 |
53 (35%) |
2.27 |
||||||
|
2012–13 |
171 |
0.73 |
134 (78%) |
11 (6%) |
0.10 |
96 (56%) |
0.95 |
64 (37%) |
2.74 |
||||||
|
2013–14 |
151 |
0.64 |
120 (79%) |
12 (8%) |
0.11 |
78 (52%) |
0.77 |
61 (40%) |
2.61 |
||||||
|
2014–15 |
180 |
0.77 |
153 (85%) |
16 (9%) |
0.16 |
93 (52%) |
0.92 |
71 (39%) |
3.04 |
||||||
|
Total |
1809 |
|
1477 (82%) |
136 (8%) |
|
1024 (57%) |
|
649 (36%) |
|
||||||
|
|
|||||||||||||||
|
* Population (June 2014): 23 464 086 people.14 † Population (June 2014): 11 002 174 people.14 ‡ Population (June 2014): 10 127 051 people.14 § Population (June 2014): 2 334 861 people.14 |
|||||||||||||||
Box 5 – Numbers of implantable cardioverter–defibrillator (ICD) procedures,* 2002–15
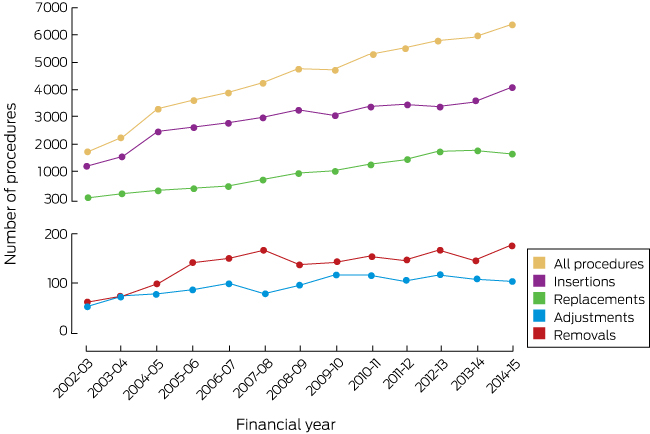
* ICD procedures defined by Australian Classification of Health Interventions procedure codes.
Box 6 – Hospitalisations for implantable cardioverter–defibrillator procedures, by outcome,* 2002–15
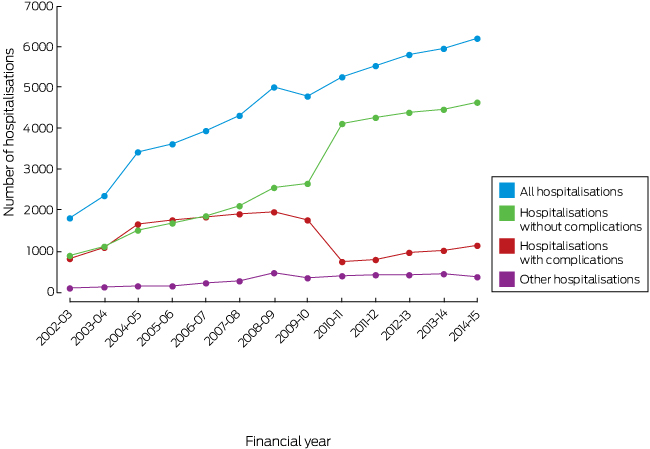
* ICD hospitalisations defined by Australian refined diagnostic-related group procedure codes.
Box 7 – Hospitalisations and associated costs for implantable cardioverter–defibrillator (ICD) procedures
|
Year |
Hospitalisations including an |
Hospitalisations including an |
Hospitalisations for other |
Total cost |
|||||||||||
|
Number |
Cost |
Number |
Cost |
Number |
Cost |
||||||||||
|
|
|||||||||||||||
|
2011–12* |
811 |
$39 168 056 |
4307 |
$99 823 339 |
439 |
$5 045 427 |
$144 036 822 |
||||||||
|
2012–13† |
982 |
$44 983 456 |
4414 |
$96 904 956 |
439 |
$5 163 518 |
$147 051 930 |
||||||||
|
2013–14‡ |
1036 |
$48 412 280 |
4494 |
$99 726 354 |
462 |
$6 417 180 |
$154 555 814 |
||||||||
|
Total |
2829 |
$132 563 792 |
13 215 |
$296 454 649 |
1340 |
$16 626 125 |
$445 644 566 |
||||||||
|
|
|||||||||||||||
|
ICD hospitalisations defined by Australian refined diagnostic-related group procedure codes; costs estimated according to Independent Hospital Pricing Authority hospitalisation costings: * Complications, $48 296; no complications, $23 177; other, $11 493 per hospitalisation. † Complications, $45 808; no complications, $21 954; other, $11 762 per hospitalisation. ‡ Complications, $46 730; no complications, $22 191; other, $13 890 per hospitalisation.21 |
|||||||||||||||
Received 30 November 2017, accepted 2 May 2018
- Bianca Blanch1
- Luise P Lago2
- Raymond Sy3
- Phillip J Harris4
- Christopher Semsarian1,3,4
- Jodie Ingles1,3,4
- 1 Agnes Ginges Centre for Molecular Cardiology, Centenary Institute, Sydney, NSW
- 2 Centre for Health Research, University of Wollongong, Wollongong, NSW
- 3 Sydney Medical School, University of Sydney, Sydney, NSW
- 4 Royal Prince Alfred Hospital, Sydney, NSW
We thank Paul Scuffham, health economist and deputy director, Menzies Health Institute Queensland, and director, Centre for Applied Health Economics, Griffith University, Queensland, for advice about costs. Christopher Semsarian holds a National Health and Medical Research Council (NHMRC) Practitioner Fellowship (1059156), Jodie Ingles a National Heart Foundation of Australia Future Leader Fellowship (100833). The investigation was partly supported by the NHMRC Centre of Research Excellence in Sustainable Health for the Wiser Healthcare collaboration (APP1104136).
No relevant disclosures.
- 1. Kitamura T, Kiyohara K, Sakai T, et al. Public-access defibrillation and out-of-hospital cardiac arrest in Japan. N Engl J Med 2016; 375: 1649-1659.
- 2. Moss AJ, Zareba W, Hall WJ, et al. Prophylactic implantation of a defibrillator in patients with myocardial infarction and reduced ejection fraction. N Engl J Med 2002; 346: 877-883.
- 3. Bardy GH, Lee KL, Mark DB, et al. Amiodarone or an implantable cardioverter–defibrillator for congestive heart failure. N Engl J Med 2005; 352: 225-237.
- 4. Goldberger JJ, AE Buxton, M Cain, et al. Risk stratification for arrhythmic sudden cardiac death. Circulation 2011; 123: 2423-2430.
- 5. Sears SF, Conti JB. Quality of life and psychological functioning of ICD patients. Heart 2002; 87: 488-493.
- 6. Ingles J, Sarina T, Kasparian N, Semsarian C. Psychological wellbeing and posttraumatic stress associated with implantable cardioverter defibrillator therapy in young adults with genetic heart disease. Int J Cardiol 2013; 168: 3779-3784.
- 7. Turakhia MP, Zweibel S, Swain AL, et al. Healthcare utilization and expenditures associated with appropriate and inappropriate implantable defibrillator shocks. Circ Cardiovasc Qual Outcomes 2017; 10: e002210.
- 8. Narayanan K, Reinier K, Uy-Evanado A, et al. Frequency and determinants of implantable cardioverter defibrillator deployment among primary prevention candidates with subsequent sudden cardiac arrest in the community. Circulation 2013; 128: 1733-1738.
- 9. Hernandez AF, Fonarow GC, Liang L, et al. Sex and racial differences in the use of implantable cardioverter–defibrillators among patients hospitalized with heart failure. JAMA 2007; 298: 1525-1532.
- 10. Al-Khatib SM, Hellkamp A, Curtis J, et al. Non-evidence-based ICD implantations in the United States. JAMA 2011; 305: 43-49.
- 11. Arribas F, Auricchio A, Boriani G, et al. Statistics on the use of cardiac electronic devices and electrophysiological procedures in 55 ESC countries: 2013 report from the European Heart Rhythm Association. Europace 2014; 16 Suppl 1: i1-i78.
- 12. Bradshaw PJ, Stobie P, Briffa T, Hobbs MS. Use and long-term outcomes of implantable cardioverter-defibrillators, 1990 to 2009. Am Heart J 2013; 165: 816-822.
- 13. Burch AW, Wong CX, Sullivan T, et al. Trends in the use of implantable cardioverter defibrillators in Australia: a 10-year nationwide study from 2000–2009. Intern Med J 2013; 43: 888-895.
- 14. Australian Bureau of Statistics. 3101.0 Australian demographic statistics, Jun 2014: population by age and sex, Australia, states and territories. Dec 2014. http://www.abs.gov.au/AUSSTATS/abs@.nsf/allprimarymainfeatures/54A5E977BB10644CCA257E1300775B9B?opendocument (viewed Nov 2016).
- 15. Australian Institute of Health and Welfare. National hospital morbidity database (NHMD). 2016. Archived: https://web.archive.org/web/20170330035923/http://www.aihw.gov.au/hospitals-data/national-hospital-morbidity-database (viewed June 2018).
- 16. Australian Institute of Health and Welfare. Hospitals: data. http://www.aihw.gov.au/reports-statistics/health-welfare-services/hospitals/data (viewed Nov 2016).
- 17. Australian Institute of Health and Welfare. Australian refined diagnosis-related groups (AR-DRG) data cubes. 2016. http://www.aihw.gov.au/hospitals-data/ar-drg-data-cubes/ (viewed Nov 2016).
- 18. Australian Institute of Health and Welfare. Australian hospital statistics 2012–13 (AIHW Cat. No. HSE 145). Canberra: AIHW, 2014.
- 19. Australian Consortium for Classification Development. The Australian Classification of Health Interventions (ACHI), tenth edition. Tabular list of interventions and alphabetic index of interventions. Adelaide: IHPA, Lane Publishing, 2016.
- 20. Australian Consortium for Classification Development. AR-DRG. 2016. https://www.accd.net.au/ArDrg.aspx (viewed Nov 2016).
- 21. Independent Hospital Pricing Authority. National hospital cost data collection, public hospitals cost report, round 18 (financial year 2013–14). Feb 2016. https://www.ihpa.gov.au/publications/australian-public-hospitals-cost-report-2013-2014-round-18 (viewed Dec 2016).
- 22. Peersman G, Laskin R, Davis J, et al. Prolonged operative time correlates with increased infection rate after total knee arthroplasty. HSS J 2006; 2: 70-72.
- 23. Curtis JP, Luebbert JJ, Wang Y, et al. Association of physician certification and outcomes among patients receiving an implantable cardioverter–defibrillator. JAMA 2009; 301: 1661-1670.
- 24. Barra S, Providência R, Paiva L, Heck P, Agarwal S. Implantable cardioverter-defibrillators in the elderly: rationale and specific age-related considerations. Europace 2014; 17: 174-186.
- 25. Ertel D, Phatak K, Makati K, et al. Predictors of early mortality in patients age 80 and older receiving implantable defibrillators. Pacing Clin Electrophysiol 2010; 33: 981-987.
- 26. Fauchier L, Marijon E, Defaye P, et al. Effect of age on survival and causes of death after primary prevention implantable cardioverter-defibrillator implantation. Am J Cardiol 2015; 115: 1415-1422.
- 27. Tsai V, Goldstein M, Hsia H, et al. Influence of age on perioperative complications among patients undergoing implantable cardioverter-defibrillators for primary prevention in the United States. Circ Cardiovasc Qual Outcomes 2011; 4: 549-556.
- 28. Krahn AD, Connolly SJ, Roberts RS, et al. Diminishing proportional risk of sudden death with advancing age: implications for prevention of sudden death. Am Heart J 2004; 147: 837-840.
- 29. Daugherty SL, Peterson PN, Wang Y, et al; National Cardiovascular Data Registry. Use of implantable cardioverter defibrillators for primary prevention in the community: do women and men equally meet trial enrollment criteria? Am Heart J 2009; 158: 224-229.
- 30. Maisel WH. Pacemaker and ICD generator reliability: meta-analysis of device registries. JAMA 2006; 295: 1929-1934.
- 31. Ackerman JP, Bartos DC, Kapplinger JD, et al. The promise and peril of precision medicine: phenotyping still matters most. Mayo Clin Proc 2016; 91: 1606-1616.
- 32. Sanders GD, Hlatky MA, Owens DK. Cost-effectiveness of the implantable cardioverter–defibrillators. N Engl J Med 2005; 353: 1471-1480.
- 33. Henderson T, Shepheard J, Sundararajan V. Quality of diagnosis and procedure coding in ICD-10 administrative data. Med Care 2006; 44: 1011-1019.
Abstract
Objectives: To quantify the number of implantable cardioverter–defibrillator (ICD) procedures in Australia by year, patient age and sex, and to estimate age group-specific population rates and the associated costs.
Design, setting: Retrospective observational study; analysis of Australian National Hospital Morbidity Database hospital procedures data.
Participants: Patients with an ICD insertion, replacement, adjustment, or removal procedure code, July 2002 – June 2015.
Main outcome measures: Number of ICD procedures by procedure year, patient age (0–34, 35–69, 70 years or more) and sex; age group-specific population procedure rates; number of procedures associated with complications.
Results: The number of ICD procedures increased from 1844 in 2002–03 to 6504 in 2014–15; more than 75% of procedures were in men. In 2014–15, the ICD insertion rate for people aged 70 years or more was 78.1 per 100 000 population, 22 per 100 000 for those aged 35–69 years, and 1.40 per 100 000 people under 35. The reported complication rate decreased from 45% in 2002–03 to 19% in 2014–15, partly because of a change in the coding of complications. The number of removals corresponded to at least 4% of the number of insertions each year. The aggregate cost of hospitalisations with an ICD procedure during 2011–14 was $445 644 566.
Conclusion: ICD procedures are becoming more frequent in Australia, particularly in people aged 70 or more. Patterns of care associated with ICD therapy, particularly patient- and hospital-related factors associated with adverse events, should be investigated to better understand and improve patient outcomes.