


The known: Access to fluoridated water and higher socio‐economic status are each strongly associated with lower prevalence of dental caries. In Australia, the proportion of the population with access to fluoridated water is lowest in Queensland.
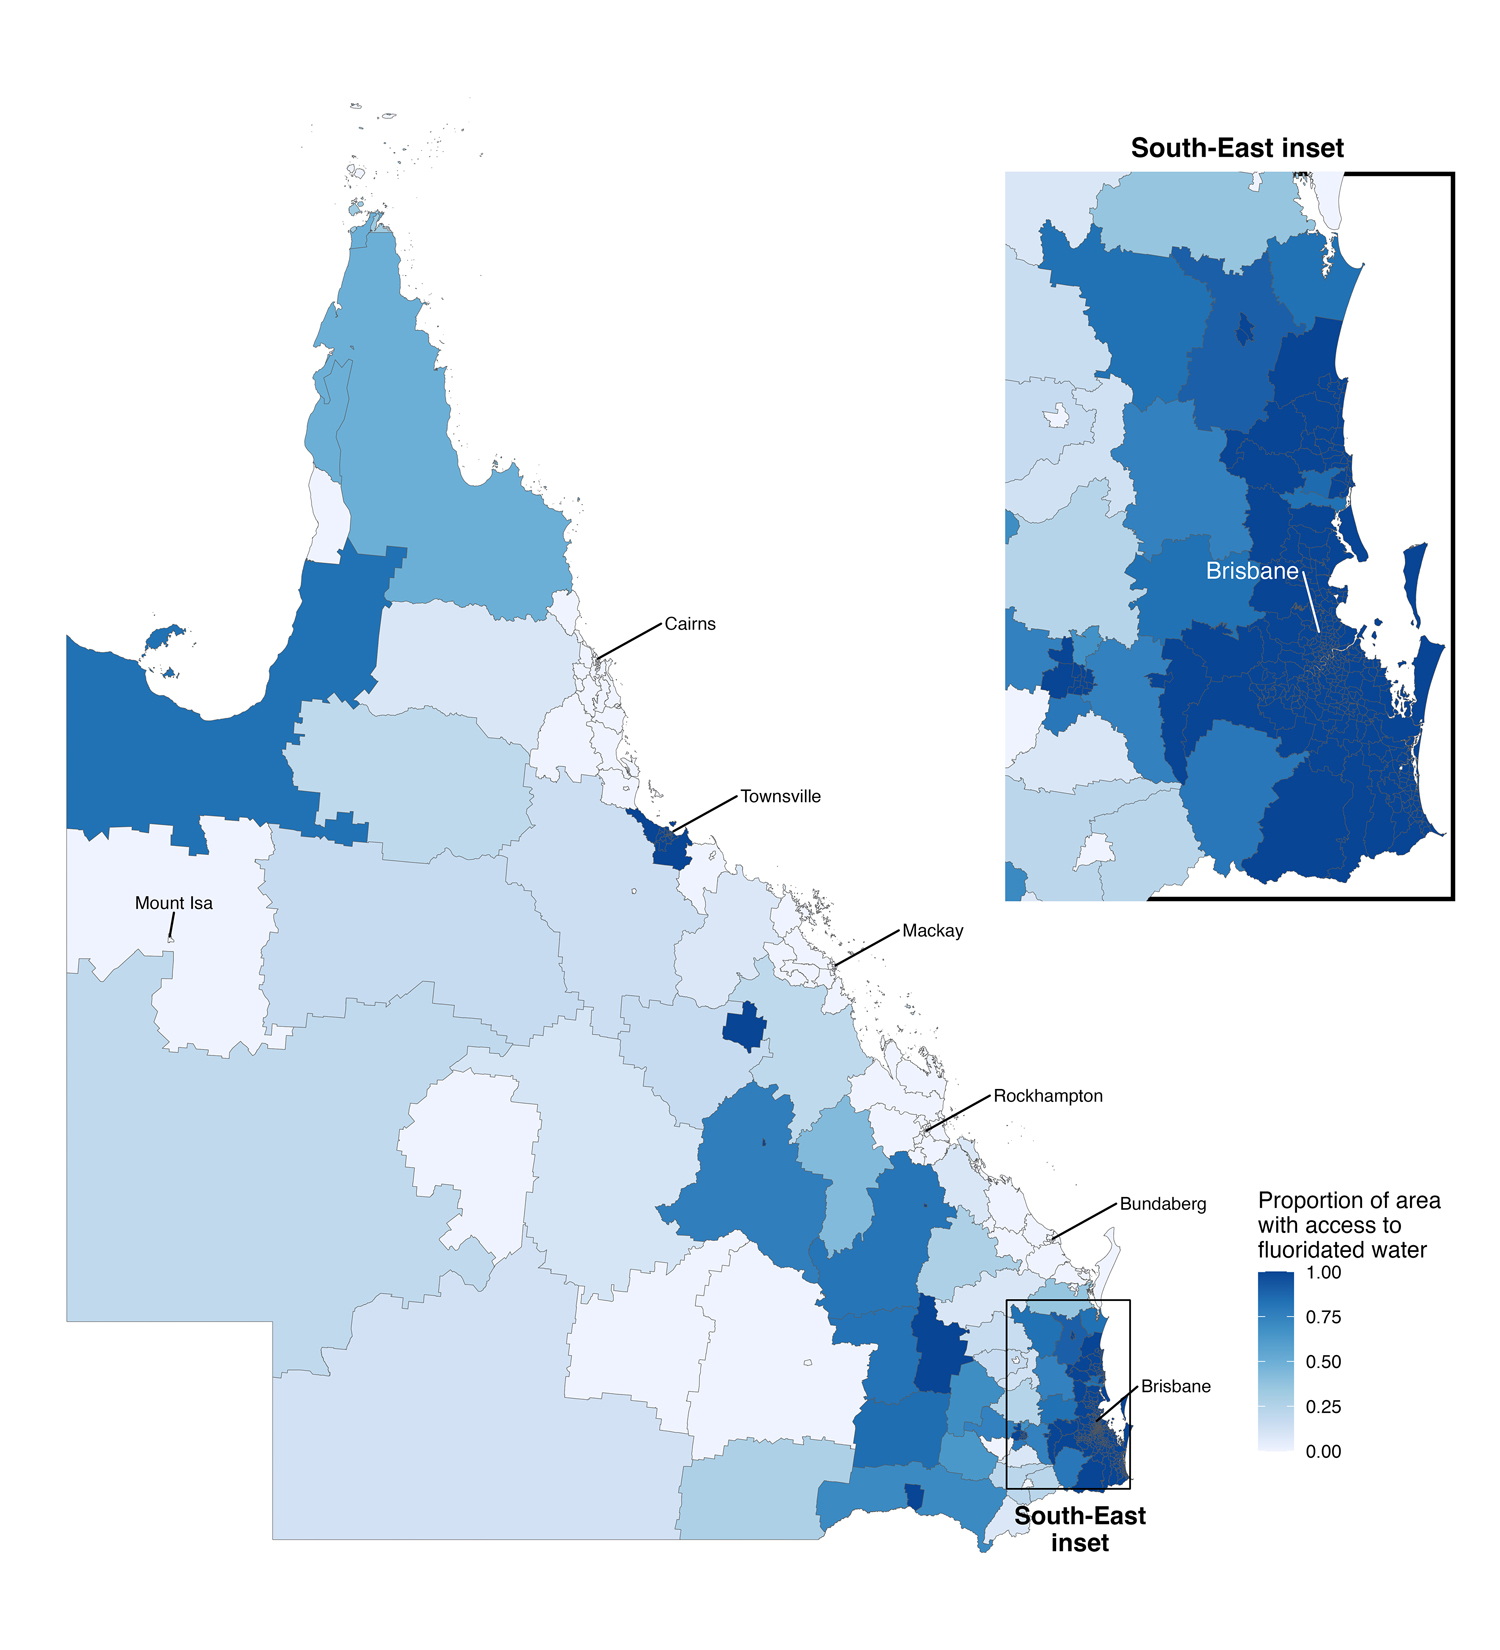
The new: Almost 80% of Queenslanders have access to fluoridated water. However, access is concentrated in the southeast of the state, and fluoridation is more likely in areas of higher socio‐economic status.
The implications: To eliminate socio‐geographic inequality in the availability of this evidence‐based health intervention, the state government should resume the responsibility for funding water fluoridation that it transferred to local councils in 2012.
Providing fluoridated drinking water is a safe and effective population‐level approach to preventing dental caries.1,2 Water fluoridation adjusts the natural fluoride level in drinking water to one that prevents tooth decay while minimising the risk of dental fluorosis, caused by excessive fluoride intake.1 A Cochrane collaboration meta‐analysis found that water fluoridation reduced the prevalence of decayed, missing, and filled teeth by 35% (primary dentition) and 26% (permanent dentition).2 Water fluoridation cost‐effectively reduces rates of dental caries and its treatment, and improves quality of life.3,4
The endorsement of water fluoridation by the World Health Organization in 1958 followed its introduction in several countries during the 1940s.5 In some countries, water fluoridation programs were sporadic or even terminated, despite evidence for its population benefit.6,7 The first water fluoridation program in Australia commenced in 1953; about 69% of Australians had access to fluoridated water in 2001,1 rising to 89% in 2010.1,8 This increase was primarily attributable to a change in Queensland government policy in 2008 that led to legislation requiring fluoridation across the state,1 increasing the proportion of Queenslanders with access to fluoridated water from fewer than 5%1 to 87% in 2012.9 In 2012, however, decisions about and the costs of water fluoridation were transferred from the state to local government.1,10 Several regional and remote local councils have subsequently discontinued fluoridation, reducing coverage in Queensland to 72%.8
The reasons for differences in access to fluoridated water in Queensland have been investigated. In a 2010 survey of knowledge and beliefs regarding fluoridated water, Queenslanders did not differ from other Australians in their support for fluoridation.11 However, knowing what works best does not necessarily lead to evidence‐based government action; both information and misinformation can drive public opinion and influence policy.12 Anti‐fluoridation websites provide superficial and less credible information than pro‐fluoridation sites.13 Community surveys suggest a modest understanding of the benefits of fluoridated water, and that people believed that decisions about fluoridation should be made by health authorities or governments rather than the community.11
Some local councils in regional and remote Queensland ended water fluoridation because of its cost and the perceived lack of benefit to councils.14 Its cost may be a burden for the councils, but Australians in regional and remote areas and Indigenous and Torres Strait Islander people have a higher burden of dental disease.15 The Australian Medical Association Queensland responded to falling coverage by advocating the re‐introduction of mandatory fluoridation by councils with financial support from the state government.16 Access to fluoridated water can reduce inequalities in oral health by benefiting people at all socio‐economic levels,17 but socio‐economically advantaged regions often have access to fluoridated water sooner and for longer.18,19
In this study, we investigated area‐level access to fluoridated drinking water in Queensland and its relationship with local socio‐economic resources.
Methods
For our ecological, geospatial data linkage study we obtained information about access to fluoridated water by postcode area from Queensland Health, and confirmed it by directly contacting the councils that regulated water services prior to March 2022. The minimum fluoride concentration for water to be deemed fluoridated for preventing dental caries is 0.5 mg/L.20 However, a small number of fluoridation plants in Queensland used lower doses, between 0.15 mg/L and less than 0.5 mg/L, and were categorised as fluoridated for this study. Fluoridation status was categorised according to type and commencement dates of water fluoridation:
- long fluoridation: areas in which it had commenced prior to 2008 and continued until March 2022;
- new fluoridation: areas in which it had commenced in 2008 or later and continued until March 2022;
- natural fluoridation: areas in which drinking water includes naturally occurring fluoride (0.3–3.0 mg/L);
- ceased: areas in which fluoridation programs had been terminated; and
- never fluoridated: areas in which water fluoridation had never been implemented.
Access to fluoridated water status was unavailable for five postcode areas (between Toowoomba and Goondiwindi; 4385, 4406, 4408, 4410, 4411).
We used Simple Features for R (sf package), a set of tools for manipulating geospatial data,21 to identify and quantify intersecting postcode areas and Statistical Areas Level 2 (SA2) using Australian Bureau of Statistics map shapefiles.22 SA2s are mutually exclusive divisions that contain 3000–25 000 people. The proportion of residents in the SA2 with access to fluoridated water was calculated from the proportion of the area that was fluoridated; population density was assumed to be uniformly distributed. Some SA2s include multiple postcodes; if fluoridation status varied within an SA2, the proportion of its area that was fluoridated was calculated using the sf package.21 An SA2 was labelled “inconsistent” if postcode fluoridation categorisation varied within the SA2.
We used two indexes from the Socio‐Economic Indexes for Areas 2021 to rank SA2s according to relative socio‐economic status.23 The Index of Relative Socio‐economic Advantage and Disadvantage (IRSAD) is a broad measure based on constructs of income, education, occupation, and dwelling characteristics; the Index of Economic Resources (IER) is a measure of economic advantage based on income, housing‐related factors, and unemployment.24 IRSAD was chosen as a measure of socio‐economic status that quantifies both advantage and disadvantage, the IER because it is indicative of regional capacity for funding and maintaining a water fluoridation program. Higher ranking on either index (Queensland‐based) indicates higher socio‐economic status. Fluoridation status by SA2 was linked with IRSAD, IER, and Australian Bureau of Statistics population and area data.23
Statistical analysis
The proportion of an SA2 with access to fluoridated water was calculated from the areas of the included postcodes categorised as long, new, or natural fluoridation areas. The largest postcode by area in an SA2 was used to categorise the SA2 as fluoridated (long, new, or natural) or not fluoridated (ceased or never). SA2s that included postcodes of differing fluoridation status were labelled “inconsistent” or “indeterminate”, but were included in the main analysis. The number of SA2 regions and their population by fluoridation status are reported as numbers and proportions. The distribution of SA2 proportions with access to fluoridated water and IER or IRSAD rank are depicted in bivariate maps by SA2 region. The distributions of IER and IRSAD ranks by fluoridation status are depicted in raincloud plots.
The associations of IRSAD and IER ranks with fluoridation status (fluoridated, not fluoridated) were examined in binary logistic models; we report odds ratios (ORs) with 95% confidence intervals (95% CIs). Both socio‐economic status indexes were scaled by dividing ranks by 100; the OR compares the odds of fluoridation associated with an increase of 100 rank positions. The probability of fluoridation is reported as estimated marginal means with 95% CIs at ranks 100 to 500 for each index. Adjusted ORs (aORs) and probabilities were estimated in logistic models adjusted for SA2 population, logarithm area, and population density. Estimated probabilities of fluoridation at each rank are at the mean values of the three covariates.
In sensitivity analyses, we excluded regions with inconsistent fluoridation status or populations less than 1000 from logistic regression analyses.
Statistical visualisation and analysis were undertaken in R 4.1.2 (R Foundation for Statistical Computing).
Ethics approval
Our study was exempted from formal ethics review by the University of Queensland Research Ethics and Integrity committee (2022/HE001108).
Results
We estimated that 4 050 168 of 5 100 260 people (79.4%) and 397 of 546 SA2 regions (72.7%) in Queensland have access to fluoridated water (Box 1). Ninety‐six SA2 regions (17.6%) had commenced and then ceased water fluoridation; 53 SA2 regions (9.7%) had never implemented water fluoridation. Access to fluoridated water is concentrated in southeastern Queensland (Box 2). Access to fluoridated water by IRSAD and IER rank groups by SA2 is depicted in Box 3 and Box 4. Almost 75% of SA2s classified as fluoridated have higher IRSAD ranks than 75% of non‐fluoridated SA2s; more than 50% of fluoridated SA2s have higher IER ranks than 75% of non‐fluoridated SA2s (Box 5).
After adjusting for SA2 population, log area, and population density, the likelihood of access to fluoridated water almost doubled for each 100‐rank increase in IRSAD (aOR, 1.93; 95% CI, 1.59–2.36) or IER (aOR, 1.77; 95% CI, 1.50–2.11) (Box 6).
The sensitivity analyses excluded 88 SA2s (16%) with inconsistent fluoridation status or populations of fewer than 1000 residents. For the 458 included SA2s, the likelihood of access to fluoridated water more than doubled for each 100‐rank increase in IRSAD (aOR, 2.39; 95% CI, 1.85–3.17) or IER (aOR, 2.05; 95% CI, 1.64–2.61).
Discussion
In the first geospatial analysis of the geographic distribution of fluoridated water access and socio‐economic status in Queensland, we found a strong association between SA2‐level socio‐economic status and access to fluoridated water. Queensland residents living in lower socio‐economic status areas may consequently be at greater risk of dental caries because they do not have access to this evidence‐based population health intervention. The proportion of the population with access to fluoridated water is lower in Queensland than in all other Australian states and territories.8 Our findings highlight the socio‐economic differences that can exacerbate social gradients of dental health.25
Water fluoridation cost‐effectively reduces the prevalence of dental caries by 25–40%.3 The benefits of fluoridated drinking water are most pronounced in areas of lower socio‐economic status, where people are at greater risk of dental caries and less likely to have access to other forms of oral health care. Economic evaluations in Australia have found that an estimated $7–18 in dental treatment costs are saved for each dollar invested in water fluoridation.1,4 Ensuring access to water fluoridation for all Queenslanders is important, particularly for those in rural and remote areas, where dental services are more limited. Poor access to dental care in regional areas leads to general medical practitioners having to manage avoidable dental pain and infections in their patients.26
State government policy has influenced the uneven access to fluoridated water in Queensland. The 2012 decision to remove the statewide requirement for water fluoridation shifted decisions regarding fluoridation, as well as its costs, to local councils. However, the state government is responsible for funding health services, including public dental services. The financial burden of water fluoridation is now borne by local governments, but the state health system benefits from improved oral health and consequently reduced demand for public dental services. The financial resources of local governments are limited, and the loss of state funding for water fluoridation made it economically unsustainable in less well resourced parts of Queensland. Many regional and rural local governments therefore ended or never commenced water fluoridation programs.
Community water fluoridation is one of the most effective public health interventions for preventing dental caries. Unlike high risk strategies that focus on individual treatment, fluoridation is a radical primary prevention intervention that benefits an entire population. Further, it can be widely implemented with minimal need to change individual behaviour, unlike interventions for other non‐communicable diseases, such as diabetes, that require modification of major risk factors, such as diet and smoking.
Water fluoridation reduces inequalities in oral health for people from lower socio‐economic areas.25 As access to fluoridated water in Queensland is influenced by area‐level socio‐economic status, reducing population‐level disparities in oral health requires state government support for water fluoridation. Mortality from non‐communicable diseases is higher among people in socio‐economically disadvantaged areas,1 and residents of poorer Queensland regions are further disadvantaged by their lack of access to fluoridated water.
Limitations
As we analysed ecological rather than individual‐level data, the associations we identified can inform public policy but may not apply to individuals. Further, the accuracy of our estimates of the proportion of the population with access to fluoridated water relied on the matching of postcodes to SA2s. However, our sensitivity analysis of the association between socio‐economic status and fluoridated water access, in which inconsistent fluoridation status SA2s were excluded, confirmed the direction of the association in our main analysis. Further, the estimated population proportion with access to fluoridated water (79.4%) is similar to other reported estimates (2016: 76%), and expected given our assumption of total water coverage within a SA2.1
Conclusion
We investigated the association between area‐level socio‐economic status and fluoridated water access in Queensland. We found that areas of greater socio‐economic disadvantage and with fewer economic resources are less likely to have access to fluoridated water, with consequences for oral health. The Queensland government should revise its water fluoridation policy and support local councils, especially in regional areas, to implement water fluoridation. The alternative is to accept poorer access to fluoridated water in poorer areas of Queensland, where the burden of oral disease is already high.
Box 1 – Fluoridation status by Statistical Areas level 2 (SA2), Queensland, 2021
|
SA2 fluoridation status |
SA2s* |
Estimated number of residents |
|||||||||||||
|
|
|||||||||||||||
|
Total number |
546 |
5 100 260 |
|||||||||||||
|
Fluoridated |
397 (72.7%) |
4 050 168 (79.4%) |
|||||||||||||
|
Long fluoridation |
27 (4.9%) |
196 948 (3.9%) |
|||||||||||||
|
New fluoridation |
369 (67.6%) |
3 848 299 (75.5%) |
|||||||||||||
|
Natural fluoridation |
1 (0.2%) |
4921 (0.1%) |
|||||||||||||
|
Not fluoridated |
149 (27.3%) |
1 050 092 (20.6%) |
|||||||||||||
|
Ceased fluoridation |
96 (17.6%) |
686 469 (13.5%) |
|||||||||||||
|
Never fluoridated |
53 (9.7%) |
363 623 (7.1%) |
|||||||||||||
|
Inconsistent |
66 (12.1%) |
474 555 (9.3%) |
|||||||||||||
|
Indeterminate |
6 (1.1%) |
44 369 (1.0%) |
|||||||||||||
|
|
|||||||||||||||
|
* Seventeen Queensland SA2s have no recorded population (industrial or nature reserves; eg, Brisbane Port–Lytton, Brisbane Airport, Lamb Range, Meridian Plains–Little Mountain (North); eleven were classified as fluoridated (one long, ten new), six as unfluoridated (two ceased, four never). These SA2s were excluded from the analysis of the relationship between socio‐economic status and access to water fluoridation. |
|||||||||||||||
Box 3 – Access to fluoridated water in Queensland and Index of Relative Socio‐economic Advantage and Disadvantage (IRSAD) rank: bivariate map by statistical area level 2 (SA2)*
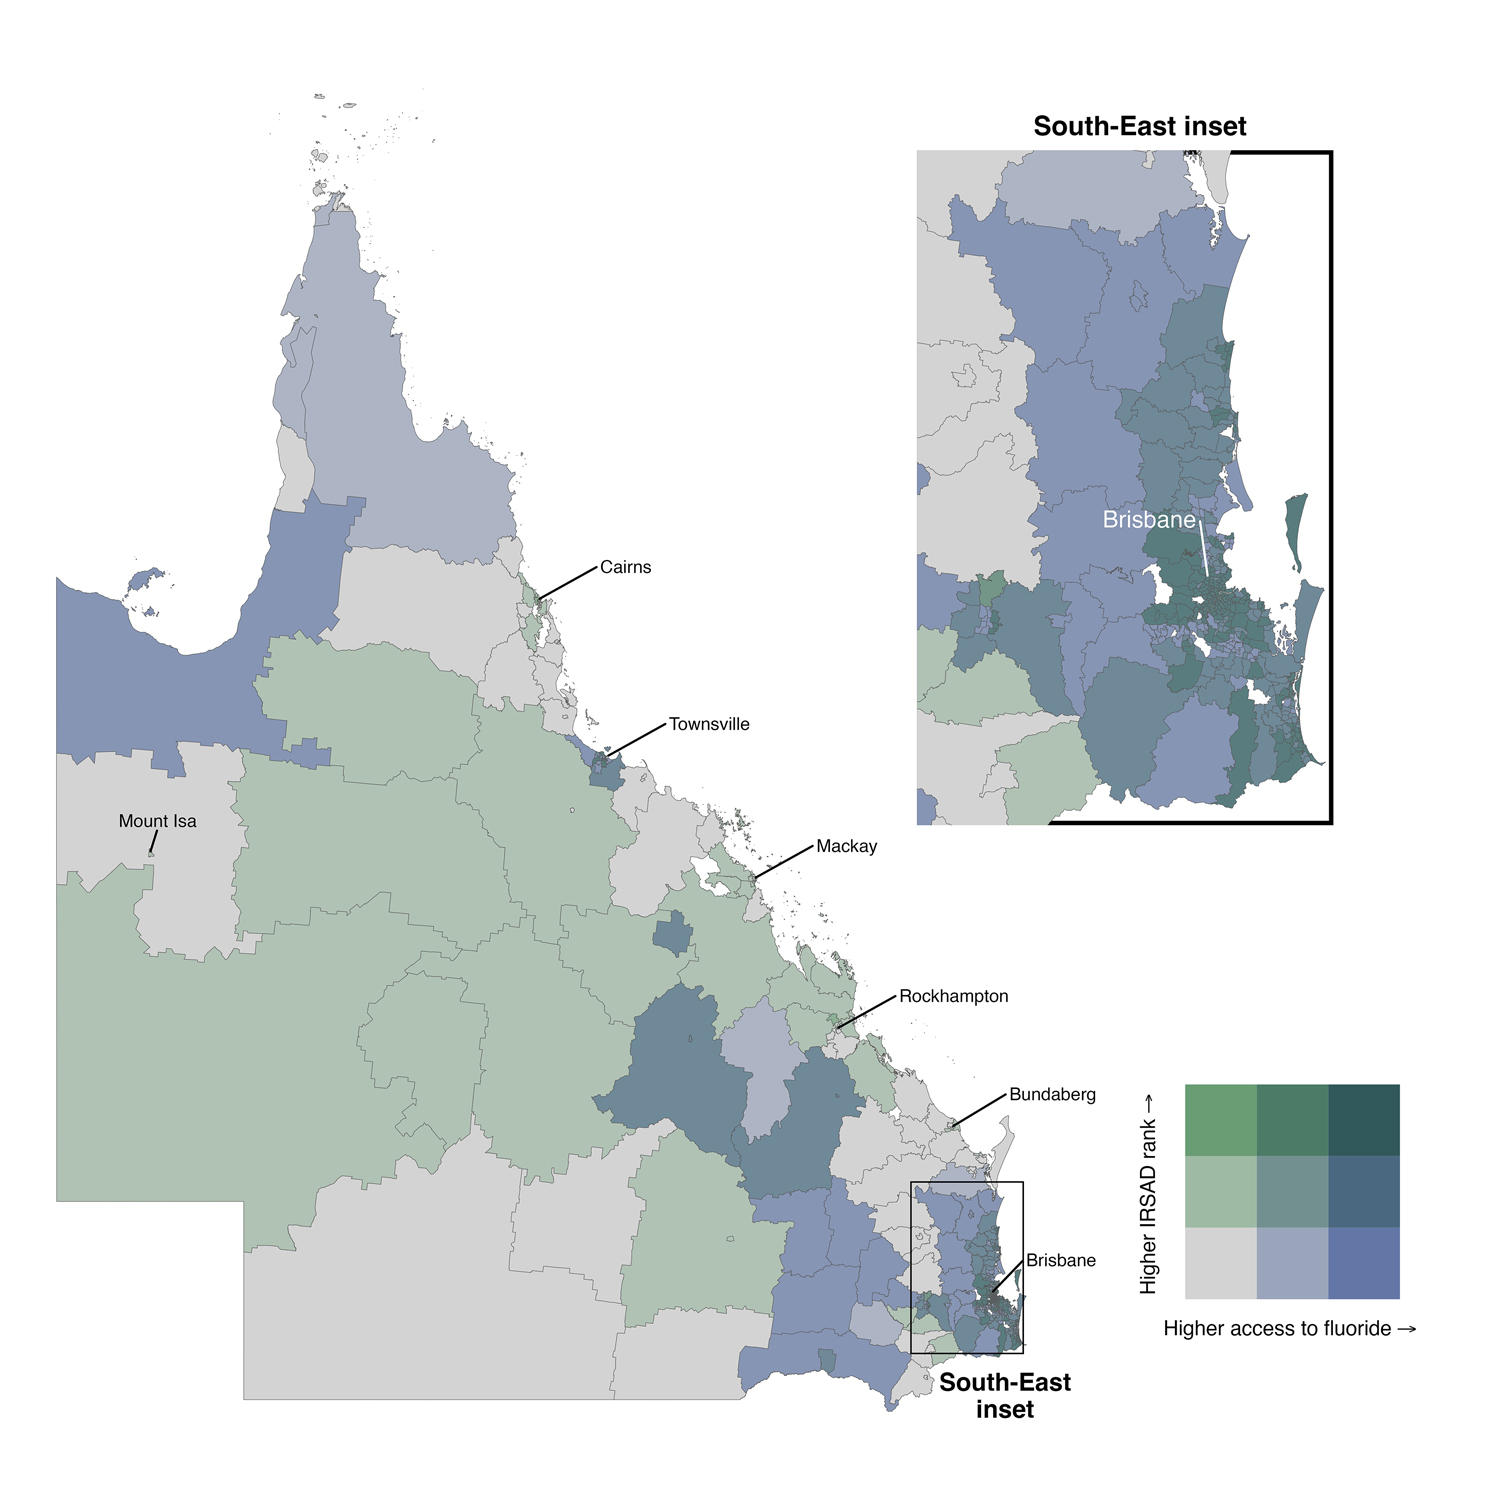
* Access to fluoridation was calculated as 0–100% of a region; the bivariate graph applies cut points of 0, 33%, and 66% access to fluoridated water. The 529 inhabited SA2 regions were also divided into three equal groups, with cut points at ranks 1, 176, and 352. Seventeen SA2 regions without inhabitants or IRSAD ranking (white) were excluded from this analysis.
Box 4 – Access to fluoridated water in Queensland and Index of Economic Resources (IER) rank: bivariate map by statistical area level 2 (SA2)*
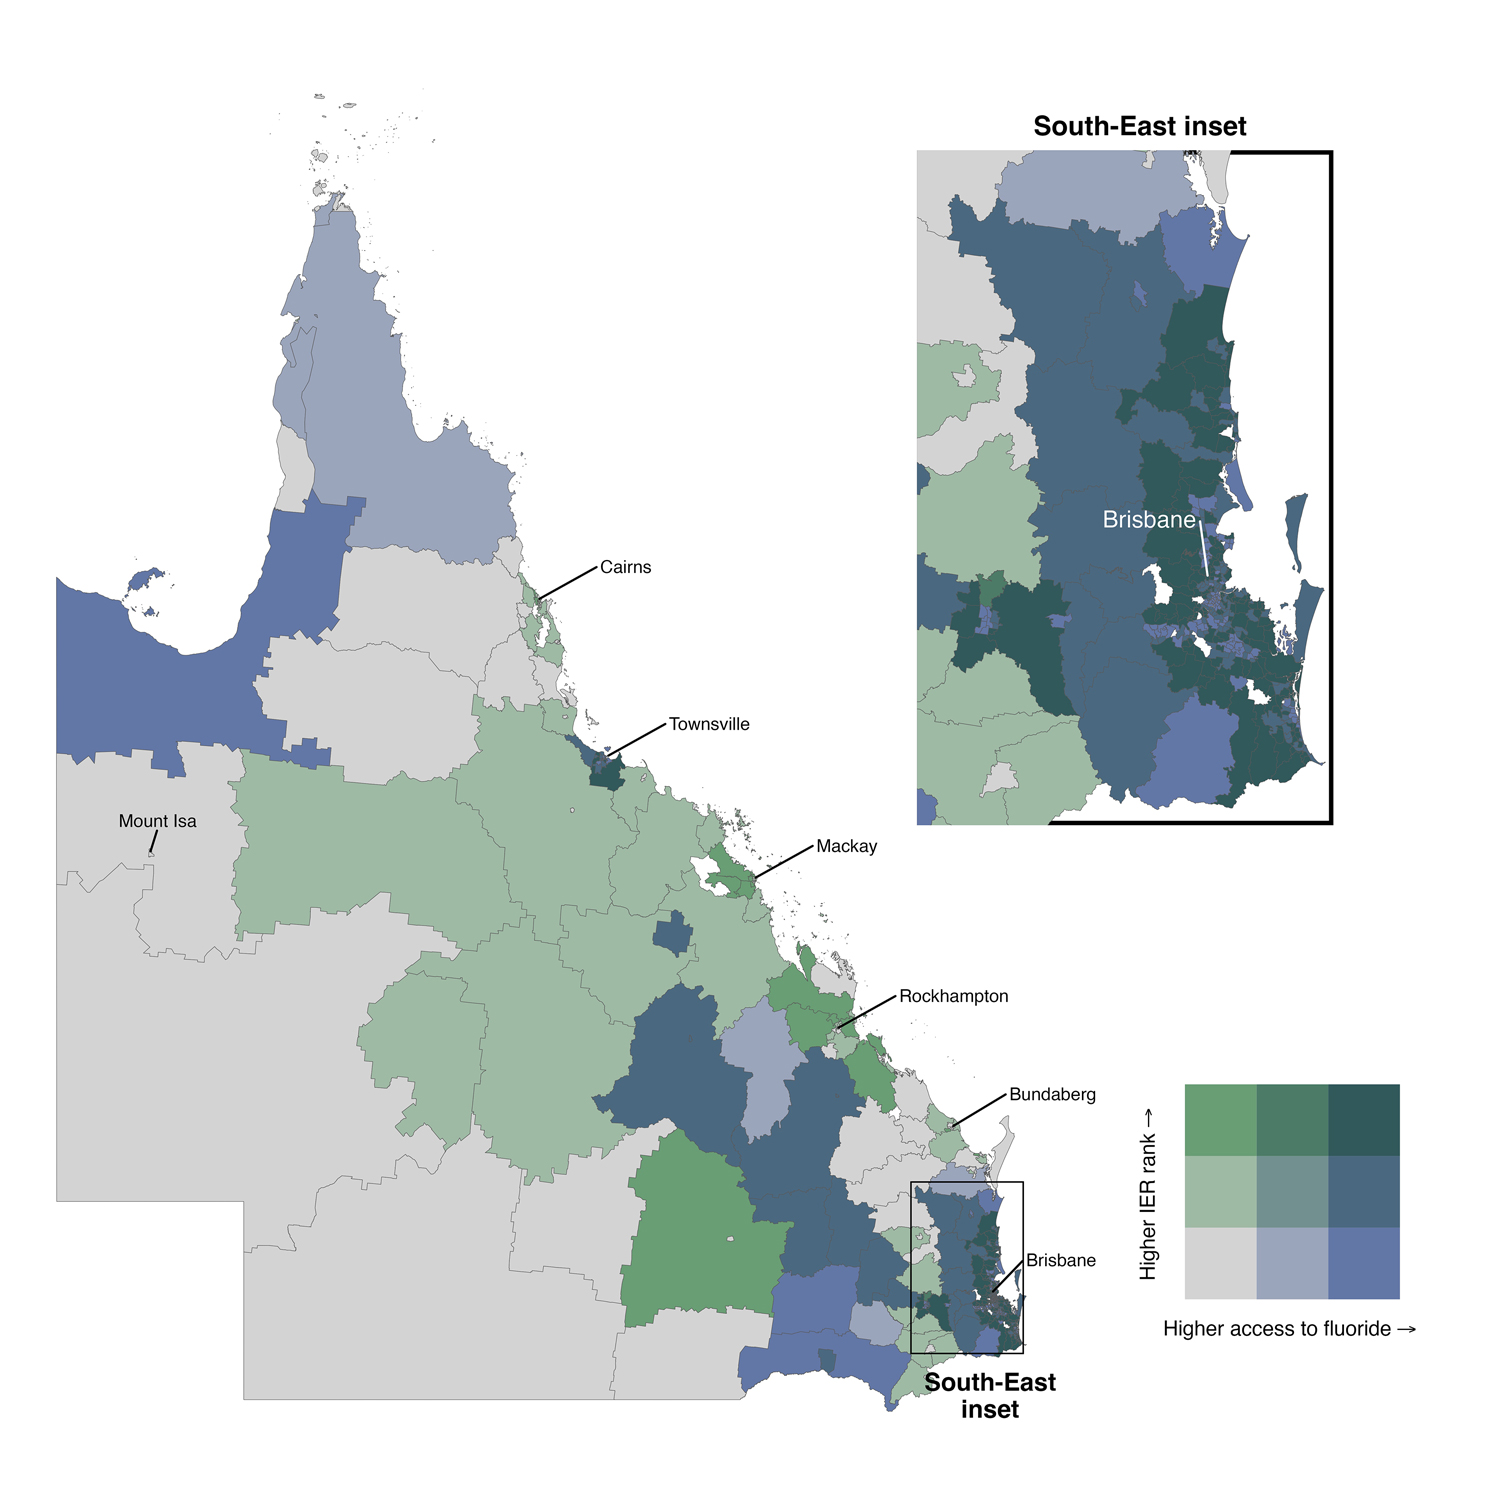
* Access to fluoridation was calculated as 0–100% of a region; the bivariate graph applies cut points of 0, 33%, and 66% access to fluoridated water. The 529 inhabited SA2 regions were also divided into three equal groups, with cut points at ranks 1, 176, and 352. Seventeen SA2 regions without inhabitants or IER ranking (white) were excluded from this analysis.
Box 5 – Access to fluoridated water and socio‐economic status in Queensland, by statistical area level 2 (SA2): rainfall plots*
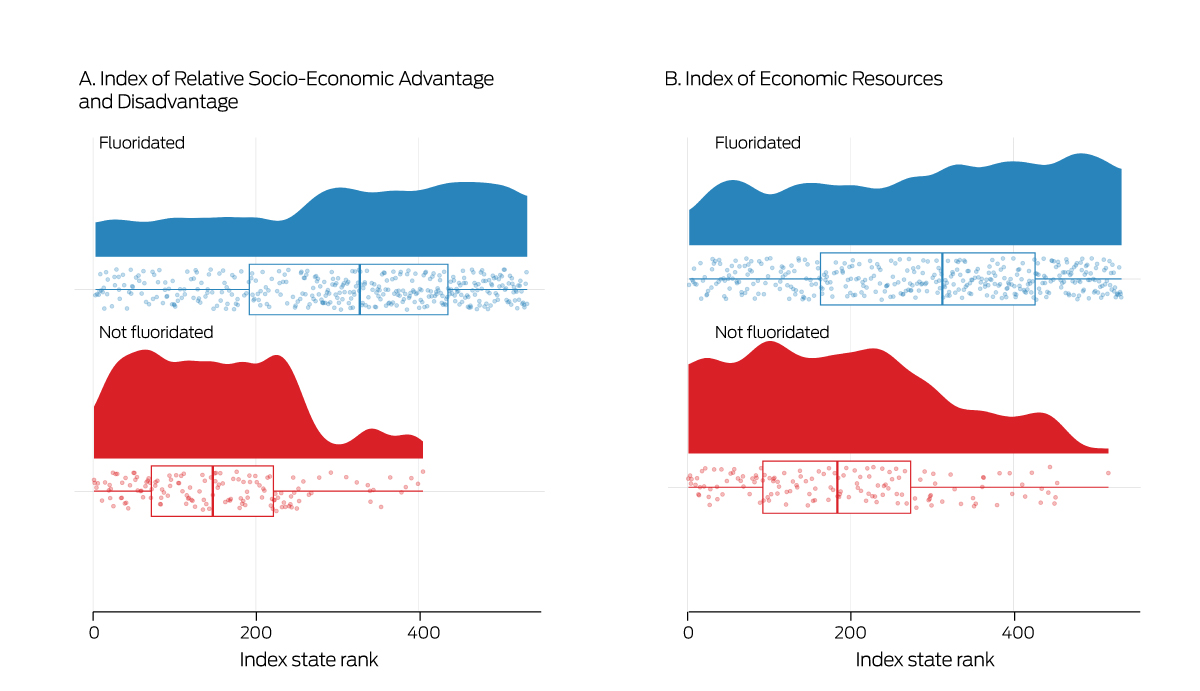
* The rainfall plots (solid graphs) depict the relationship between access to fluoridated water by SA2 and Index of Relative Socio‐Economic Advantage and Disadvantage or Index Economic Resources ranking. The raincloud plot is a histogram for the index stratified by fluoridation status. Each individual SA2 is indicated by a raindrop, the overlayed boxes mark the interquartile range of values, with the median included as the internal line, and whiskers indicate the data range.
Box 6 – Access to fluoridated water by Statistical Area level 2 (SA2) socio‐economic status: logistic regression analyses
|
Model |
Odds ratio (95% CI) |
Adjusted odds ratio* (95% CI) |
|||||||||||||
|
|
|||||||||||||||
|
Index of Relative Advantage and Disadvantage (per 100 ranks) |
2.20 (1.87–2.61) |
1.93 (1.59–2.36) |
|||||||||||||
|
Pr(100) |
0.50 (0.43–0.56) |
0.66 (0.47–0.81) |
|||||||||||||
|
Pr(200) |
0.69 (0.64–0.73) |
0.79 (0.63–0.89) |
|||||||||||||
|
Pr(300) |
0.83 (0.78–0.86) |
0.88 (0.76–0.95) |
|||||||||||||
|
Pr(400) |
0.91 (0.88–0.94) |
0.93 (0.85–0.97) |
|||||||||||||
|
Pr(500) |
0.96 (0.93–0.98) |
0.96 (0.90–0.99) |
|||||||||||||
|
Index of Economic Resources (per 100 ranks) |
1.59 (1.39–1.84) |
1.77 (1.50–2.11) |
|||||||||||||
|
Pr(100) |
0.58 (0.52–0.64) |
0.65 (0.46–0.81) |
|||||||||||||
|
Pr(200) |
0.69 (0.65–0.73) |
0.77 (0.60–0.88) |
|||||||||||||
|
Pr(300) |
0.78 (0.74–0.82) |
0.85 (0.72–0.93) |
|||||||||||||
|
Pr(400) |
0.85 (0.80–0.89) |
0.91 (0.81–0.96) |
|||||||||||||
|
Pr(500) |
0.90 (0.85–0.93) |
0.95 (0.87–0.98) |
|||||||||||||
|
|
|||||||||||||||
|
CI = confidence interval Pr(rank) = probability of access to fluoridated water at the index rank. * Adjusted for SA2 population, log(area), and population density. Probability estimates are provided for population = 9641, area = 3263 km, population density = 1104 persons per km2. |
|||||||||||||||
Received 16 February 2023, accepted 15 September 2023
- Christopher T Sexton1
- Diep H Ha1
- Thu Le1
- Ratilal Lalloo1
- Pauline Ford1
- Loc G Do1
- Nicole Stormon1,2
- 1 The University of Queensland, Brisbane, QLD
- 2 Metro North Hospital and Health Service, Queensland Health, Brisbane, QLD
We acknowledge Queensland Health for providing access to the water fluoridation data for this article.
No relevant disclosures.
- 1. National Health and Medical Research Council. Water fluoridation: dental and other human health outcomes (NHMRC ref. EH43). July 2017. https://www.nhmrc.gov.au/file/2861/download?token=ATb5PO0f (viewed June 2023).
- 2. Iheozor‐Ejiofor Z, Worthington HV, Walsh T, et al. Water fluoridation for the prevention of dental caries. Cochrane Database Syst Rev 2015; CD010856.
- 3. Mariño R, Zaror C. Economic evaluations in water‐fluoridation: a scoping review. BMC Oral Health 2020; 20: 115.
- 4. Cobiac LJ, Vos T. Cost‐effectiveness of extending the coverage of water supply fluoridation for the prevention of dental caries in Australia. Community Dent Oral Epidemiol 2012; 40: 369‐376.
- 5. Whelton HP, Spencer AJ, Do LG, Rugg‐Gunn AJ. Fluoride revolution and dental caries: evolution of policies for global use. J Dent Res 2019; 98: 837‐846.
- 6. Kunzel W, Fischer T, Lorenz R, Brühmann S. Decline of caries prevalence after the cessation of water fluoridation in the former East Germany. Community Dent Oral Epidemiol 2000; 28: 382‐389.
- 7. McLaren L, Patterson S, Thawer S, et al. Exploring the short‐term impact of community water fluoridation cessation on children's dental caries: a natural experiment in Alberta, Canada. Public Health 2017; 146: 56‐64.
- 8. Stormon N, Lalloo R. Monitoring the extent of water fluoridation coverage in Australia. Health Promot J Austr 2020; 31: 169‐171.
- 9. Akers HF, Foley MA. Fluoridation advocacy in Queensland: a long and winding road. Int Dent J 2012; 62: 262‐269.
- 10. Queensland Parliament. South East Queensland Water (Restructuring) and Other Legislation Amendment Act 2012 (Act No. 39 of 2012). https://documents.parliament.qld.gov.au/bills/2012/2584/12AC039‐4aa2.pdf (viewed Aug 2023).
- 11. Akers HF, Armfield JM. Australian opinions on water fluoridation: do Queenslanders believe differently? J Investig Clin Dent 2010; 1: 65‐73.
- 12. Head B. Evidence‐based policy: principles and requirements. In: Australian Productivity Commission. Strengthening evidence‐based policy in the Australian Federation. Canberra, 17–18 August 2009. Volume 1: Proceedings. Canberra: Productivity Commission, 2010; pp. 13‐26. https://www.pc.gov.au/research/supporting/strengthening‐evidence/roundtable‐proceedings‐volume1.pdf (viewed June 2023).
- 13. Frangos Z, Steffens M, Leask J. Water fluoridation and the quality of information available online. Int Dent J 2018; 68: 253‐261.
- 14. AAP. Qld council's fluoride removal “misguided”. SBS News (Australia), 28 Sept 2016. https://www.sbs.com.au/news/qld‐council‐s‐fluoride‐removal‐misguided (viewed June 2023).
- 15. Johnson NW, Lalloo R, Kroon J, et al. Effectiveness of water fluoridation in caries reduction in a remote Indigenous community in Far North Queensland. Aust Dent J 2014; 59: 366‐371.
- 16. Australian Medical Association Queensland. New laws point to state government for action on fluoride [media release]. 18 July 2019. https://qld.ama.com.au/sites/default/files/QLD/PDFs/MediaStatements/AMAQueensland_MEDIA%20RELEASE_New‐laws‐point‐to‐State‐Government‐for‐action‐on‐fluoride.pdf (viewed June 2023).
- 17. Kim HN, Kim JH, Kim SY, Kim JB. Associations of community water fluoridation with caries prevalence and oral health inequality in children. Int J Environ Res Public Health 2017; 14: 631.
- 18. Gabardo MC, da Silva WJ, Moyses ST, Moyses SJ. Water fluoridation as a marker for sociodental inequalities. Community Dent Oral Epidemiol 2008; 36: 103‐107.
- 19. Gabardo MCL, da Silva WJ, Olandoski M, et al. Inequalities in public water supply fluoridation in Brazil: an ecological study. BMC Oral Health 2008; 8: 9.
- 20. World Health Organization. Guidelines for drinking‐water quality. Fourth edition, incorporating the first addendum. Geneva: World Health Organization, 2017. https://www.who.int/publications/i/item/9789241549950 (viewed Dec 2023).
- 21. Pebesma EJ. Simple Features for R: standardized support for spatial vector data. R Journal 2018; 10: 439‐446.
- 22. Australian Bureau of Statistics. Digital boundary files: Australian Statistical Geography Standard (ASGS) edition 3, reference period July 2021 – June 2026. Statistical Areas Level 2, 2021, shapefile. 20 July 2021. https://www.abs.gov.au/statistics/standards/australian‐statistical‐geography‐standard‐asgs‐edition‐3/jul2021‐jun2026/access‐and‐downloads/digital‐boundary‐files (viewed June 2023).
- 23. Australian Bureau of Statistics. Socio‐Economic Indexes for Australia (SEIFA), 2021. Statistical Area Level 2 (SA2) Index of Relative Socio‐economic Advantage and Disadvantage, 2021. 27 Apr 2023. https://www.abs.gov.au/statistics/people/people‐and‐communities/socio‐economic‐indexes‐areas‐seifa‐australia/2021/Statistical%20Area%20Level%202%2C%20Indexes%2C%20SEIFA%202021.xlsx (viewed June 2023).
- 24. Australian Bureau of Statistics. Socio‐Economic Indexes for Australia (SEIFA), Australia. Reference period 2021. 27 Apr 2023. https://www.abs.gov.au/statistics/people/people‐and‐communities/socio‐economic‐indexes‐areas‐seifa‐australia/latest‐release (viewed June 2023).
- 25. Spencer AJ, Do LG, Ha DH. Contemporary evidence on the effectiveness of water fluoridation in the prevention of childhood caries. Community Dent Oral Epidemiol 2018; 46: 407‐415.
- 26. Barnett T, Hoang H, Stuart J, Crocombe L. “Sorry, I'm not a dentist”: perspectives of rural GPs on oral health in the bush. Med J Aust 2016; 204: 26. https://www.mja.com.au/journal/2016/204/1/sorry‐im‐not‐dentist‐perspectives‐rural‐gps‐oral‐health‐bush
Abstract
Objectives: To investigate the relationship between access to fluoridated drinking water and area‐level socio‐economic status in Queensland.
Study design: Ecological, geospatial data linkage study.
Setting: Queensland, by statistical area level 2 (SA2), 2021.
Main outcome measures: Proportion of SA2s and of residents with access to fluoridated drinking water (natural or supplemented); relationship at SA2 level between access to fluoridated water and socio‐economic status (Index of Relative Socio‐economic Advantage and Disadvantage, IRSAD; Index of Economic Resources, IER).
Results: In 2021, an estimated 4 050 168 people (79.4% of the population) and 397 SA2 regions (72.7%) in Queensland had access to fluoridated water. Access was concentrated in the southeastern corner of the state. After adjusting for SA2 population, log area, and population density, the likelihood of access to fluoridated drinking water almost doubled for each 100‐rank increase in IRSAD (adjusted odds ratio [aOR], 1.93; 95% confidence interval [CI], 1.59–2.36) or IER (aOR, 1.77; 95% CI, 1.50–2.11).
Conclusions: The 2012 decision to devolve responsibility for water fluoridation decisions and funding from the Queensland government to local councils means that residents in lower socio‐economic areas are less likely to have access to fluoridated water than those in more advantaged areas, exacerbating their already greater risk of dental disease. Queensland water fluoridation policy should be revised so that all residents can benefit from this evidence‐based public health intervention for reducing the prevalence of dental caries.