


The known: The benefits of spinal decompression and fusion for people with degenerative conditions are dubious, but procedure rates in high income countries have risen substantially in recent decades.
The new: Rates of privately funded spinal fusion and decompression procedures have increased much more rapidly in New South Wales than those of procedures that are publicly funded or covered by workers’ compensation.
The implications: Differences in procedure rates suggest that too many privately funded or too few publicly funded spinal procedures are undertaken. The influence of financial considerations, access to specialist care, and patient and surgeon preferences should be investigated.
Degenerative spinal disorders and the associated chronic back and leg pain are common health problems.1,2 Their prevalence increases with age,2 and people may choose surgery if non‐surgical management has not provided relief.2,3,4 Although the benefits of spinal decompression and fusion for people with degenerative conditions are debated,3,4 use of these procedures in high income countries has risen substantially in recent decades, but there are significant variations in their use within and between countries.3,5,6,7,8,9 Factors such as population ageing, overuse of diagnostic imaging, and greater expectations about the outcomes achievable with advanced technology may explain the increase in surgery volumes.3,4 However, consensus about the indications for spinal surgery is limited, as is high quality evidence regarding its clinical effectiveness.3,10
Private health insurance does not cover all non‐surgical treatments for degenerative spine conditions, but can facilitate timely access to surgery as a private patient.3 In Australia, the rate of privately funded spinal fusions increased by 167% during 1997–2006 (from 7.7 to 20.5 per 100 000 population), while the publicly funded rate increased by only 2% (from 5.1 to 5.2 per 100 000 population).9 During 2012–18, 83% of spine procedures were performed in the private sector (as were about two‐thirds of hip and knee replacement procedures),3 suggesting that financial considerations are important and that access to surgical interventions may consequently be inequitable.3,4,9
In Australia, workers’ compensation provides health insurance for people who sustain workplace‐related injuries.11 A study of workers’ compensation claims in New South Wales during 2010–18 reported spinal surgery rates of 15–29 per 100 000 covered workers per year; they declined during 2011–15 before rising again.1 The study did not compare procedure rates for insured workers with those for publicly and privately funded patients.
The Medical Services Advisory Committee recommended in 2011 that artificial disc replacement be publicly subsidised in Australia.12 Little is known about the uptake of this procedure since this time.
Given the doubtful evidence for the benefit of many spinal procedures, financial incentives may be important for decisions regarding spinal surgery. We therefore investigated the rates of spinal fusion, decompression, and disc replacement procedures for degenerative spinal conditions in Australia during 2001–20 by funding type (public, private, workers’ compensation).
Methods
We undertook a retrospective observational (cross‐sectional) study, analysing NSW hospitals admissions data for 1 July 2001 – 30 June 2020, extracted from the NSW Admitted Patient Data Collection (APDC), for all adults who underwent elective procedures for degenerative spinal conditions (, table 1). The APDC includes a record for each separation from a public or private hospital, including information on the demographic characteristics of the patient, diagnoses, procedures, external causes of injuries, urgency of admission, payment at discharge, referral, and discharge status. Diagnoses were coded according to the International Classification of Diseases, tenth revision, Australian modification (ICD‐10‐AM);13 procedures were coded according to Australian Classification of Health Interventions.14 We report our study in accordance with the Strengthening the Reporting of Observational Studies in Epidemiology guidelines.15
Inclusion and exclusion criteria
We classified procedures using a hierarchical definition: any procedure involving fusion (fusion with or without disc replacement, with or without decompression) was classified as a fusion procedure; a disc replacement procedure with or without decompression was classified as a disc replacement; and decompression alone (decompression without fusion or disc replacement) was classified as a decompression procedure. To include only elective procedures for adults with degenerative spine disorders, we excluded procedures for people under 18 years of age, emergency admissions, procedures for spinal fracture, trauma, tumour, lesion, or congenital deformities, revisions of scoliosis or kyphosis surgery, and revision or removal of spinal fixation or intervertebral disc prostheses (, table 2).
Under the National Health Reform Agreement,16 Australian citizens and eligible residents can select public or private care on admission to hospital. A public patient in a public hospital receives cost‐free treatment (public funding). When available, a patient can receive private care in a public or private hospital, with costs covered by private health insurance, the patient, and the Medicare rebate (private funding). Hospital treatment for work‐related conditions is covered by workers’ compensation insurance. We classified procedure funding as public funding, private funding, or workers’ compensation according to funding status at hospital discharge as recorded in the APDC, without regard to hospital type. Funding for the small number of procedures paid by the Department of Veterans’ Affairs were classified as private funding. We excluded procedures covered by insurance schemes other than workers’ compensation (eg, vehicle accident insurance).
Statistical analyses
All analyses were undertaken in SAS 9.4. We summarise patient characteristics as numbers and proportions or as means with standard deviations (SDs). We calculated procedure rates with 95% confidence intervals (CIs) with respect to the appropriate NSW adult population, by funding scheme and financial year. The number of people covered by workers’ compensation was supplied by the State Insurance Regulatory Agency. The numbers with private health insurance (hospital treatment coverage) were derived from membership data published by the Australian Prudential Regulation Authority.17 As some public patients have private health insurance, we calculated both lower and upper bound rates for publicly funded procedures. For lower bound rates, we included all NSW adults18 (ie, all people eligible for public sector surgery); for upper bound rates, we included only those without private hospital health insurance cover (ie, we subtracted the number with private health insurance from the total adult population number).
To compare rates by funding scheme, age‐ and sex‐adjusted procedure rates were directly standardised to the NSW population using 2016 national census data18 (, table 3). When comparing workers’ compensation rates with those of the other two groups, we restricted the analysis to procedures for people of working age (18–64 years). We estimated annual incidence rate ratios (IRRs) with 95% CIs in generalised linear models (PROC GENMOD, Poisson distribution, log‐link function, log of the denominator as an offset term, α = 0.05). Standardised rates and IRR estimates were not calculated for disc replacement procedures because of their small numbers.
Ethics approval
The human research ethics committees of NSW Population and Health Services Research (HREC/18/CIPHS/56), the Aboriginal Health and Medical Research Council of NSW (1503/19), and the Australian Institute of Health and Welfare (EO2018/2/431) approved the study.
Results
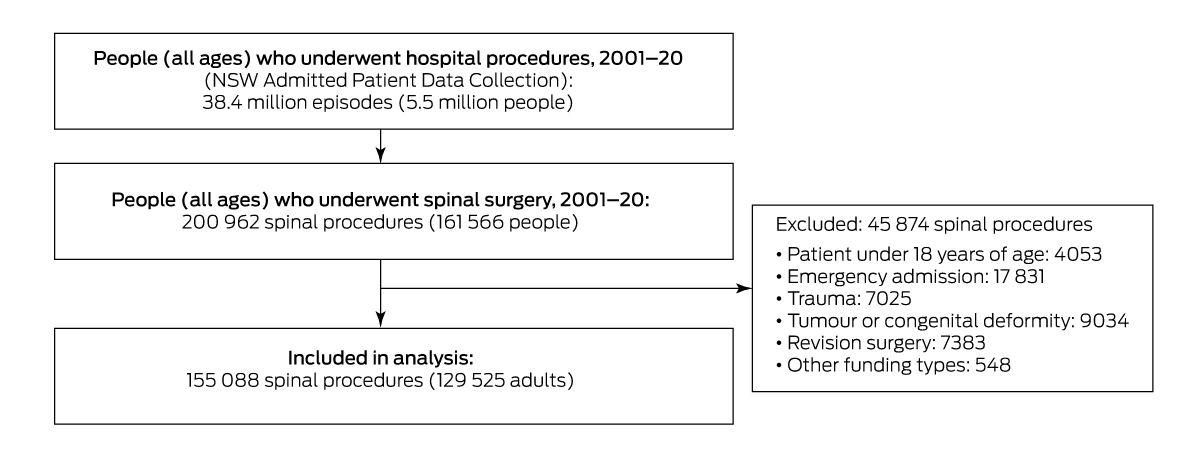
During 1 July 2001 – 30 June 2020, 200 962 spinal procedures were performed in 161 566 people in NSW, of which 155 088 procedures in 129 525 adults were eligible for our analysis: 53 606 fusion (including 40 380 with decompression [75.3%]), 100 225 decompression, and 1257 disc replacement procedures. In total, 65.9% of procedures were privately funded, 22.8% were publicly funded, and 11.1% were funded by workers’ compensation (Box 1, Box 2).
The mean age of people who underwent fusion procedures was 59.1 years (SD, 14.8 years), for decompression procedures 57.4 years (SD, 16.3 years), and for disc replacements 43.3 years (SD, 9.7 years); 48.1% of fusion procedures, 56.9% of decompressions, and 55.6% of disc replacements were undertaken in men (Box 2).
The mean age of people who underwent procedures funded by workers’ compensation was 46.2 years (SD, 11.1 years), for privately funded procedures 59.8 years (SD, 15.8 years), and for publicly funded procedures 58.2 years (SD, 15.6 years).
Procedure rates (crude)
The privately funded fusion procedure rate increased from 26.6 per 100 000 in 2001–02 to 109.5 per 100 000 insured adults in 2019–20 (per year: IRR, 1.06; 95% CI, 1.05–1.07), and the workers’ compensation procedure rate from 6.1 to 15.8 per 100 000 covered adults (IRR, 1.04; 95% CI, 1.01–1.06). The lower bound for the publicly funded procedure rate increased from 5.6 to 12.4 per 100 000 people (IRR, 1.03; 95% CI, 1.01–1.06), the upper bound rate from 10.5 to 22.1 per 100 000 people (IRR, 1.03; 95% CI, 1.01–1.05) (Box 3). The privately funded fusion procedure rate was highest for people aged 65 years or more (176 [95% CI, 173.8–179.2] per 100 000 insured persons; (Supporting Information, table 6).
The privately funded decompression procedure rate increased from 93.4 per 100 000 people in 2001–02 to 175.9 per 100 000 insured adults in 2014–15, then declined to 153.6 per 100 000 people in 2019–20 (per year: IRR, 1.02; 95% CI, 1.01–1.03). The workers’ compensation rate declined from 19.7 to 16.7 per 100 000 covered adults (IRR, 0.98; 95% CI, 0.96–0.99). There was no significant change in the lower (from 19.0 to 22.4 per 100 000 people; IRR, 1.00; 95% CI, 0.98–1.01) or upper bound rates (35.4 to 39.8 per 100 000 people; IRR, 1.00; 95% CI, 0.98–1.01) for publicly funded procedures (Box 3). The privately funded decompression procedure rate was highest for people aged 65 years or more (288.9 [95% CI, 285.5–292.4] per 100 000 insured persons; (Supporting Information, table 6).
The privately funded disc replacement procedure rate increased from 6.2 per million in 2010–11 to 38.4 per million insured adults in 2019–20, but did not markedly change for the other two funding groups during this period (Box 3).
Procedure rates (age‐ and sex‐adjusted)
The age‐ and sex‐adjusted rates for privately and publicly funded fusion and decompression procedures were similar to the crude rates (, figure 1, table 8).
The adjusted fusion and decompression procedure rates for people of working age (18–64 years) funded by workers’ compensation lay between the lower and upper bounds for the adjusted publicly funded procedure rate. The adjusted privately funded fusion procedure rates were higher than for procedures funded by workers’ compensation in both 2001–02 (20.1 v 5.8 per 100 000 people) and 2019–20 (64.3 v 16.3 per 100 000 people), as were the adjusted decompression rates (2001–02: 68.0 v 19.1 per 100 000 people; 2019–20: 104.8 v 16.7 per 100 000 people) (Box 4).
Discussion
During 2001–20, rates of privately funded spinal fusion, decompression, and (from 2010–11) disc replacement procedures increased substantially in NSW, whereas changes for procedures that were publicly funded or covered by workers’ compensation were smaller. The greatest rise was in privately funded fusion procedures, the rate of which increased throughout the study period; the decompression procedure rate peaked in 2014–15.
Unlike many similar studies, we included surgery for all spinal regions, not just the lumbar spine; however, about 70% of fusions and 88% of decompressions undertaken in Australia during 2010–2018 were lumbar procedures.1 Our findings are consistent with reports that spinal surgery rates have increased over the past two decades, particularly lumbar fusions and procedures for people over 65 years of age.5,6,7,8,9,21 In the United States, the lumbar fusion rate rose during 2004–2015 from 60.4 to 79.8 per 100 000 population (privately insured, uninsured, and government‐subsidised patients),6 and from 30 to 110 per 100 000 among Medicare beneficiaries (people aged 65 years or more without health insurance) during 1992–2003.21 Reported rates were lower and increases smaller in countries with universal health care systems than in the United States. In Finland, the lumbar fusion rate increased from 9 to 30 per 100 000 population during 1997–2018;7 in Norway, it rose from 13.6 to 21 per 100 000 population during 1997–2013, and the lumbar decompression rate increased from 64.3 to 88.9 per 100 000;5 in the United Kingdom, the lumbar surgery rate increased from 24.5 to 48.8 per 100 000 population during 1999–2013.8
The privately funded decompression rate declined while the privately funded fusion rate increased during 2015–20. Studies of lumbar spinal stenosis surgery have found similar patterns. United States studies found declining decompression rates and increased rates of complex spinal fusion during 2002–2009.22,23 An Australian study found a small increase in the use of decompression and a fourfold increase in the use of complex fusion during 2003–2013.24 Our finding of a decline in the rate of decompressions covered by workers’ compensation is consistent with an earlier study.1 The decline in the spinal fusion rate for this group might be partially explained by the 2018 reform of the Medicare spinal surgery billing schedule (ie, sixty new MBS items with new rules to ensure claiming consistency and reduce billing ambiguity).25
Spinal surgery rates are rising despite the lack of evidence that spinal fusion is an effective treatment for degenerative conditions.26,27 The costs of the procedures are high, as are the risks of complications. The increases in privately funded fusion (312%) and decompression rates (64%) in NSW during 2001–20 are unlikely to be explained by the increased uptake of private health insurance during this period (25% increase).17 While the rising fusion rate may be related to changes in the conditions treated and the availability of less invasive methods, these factors would not explain differences in change by funding type. The differences in publicly and privately funded procedure rates in NSW suggest that practice is determined by the preferences of the patient and the surgeon rather than by evidence of effectiveness. The adjusted rates of fusion and decompression procedures covered by workers’ compensation were similar to those for publicly funded procedures, but the people in the two groups may have different health profiles; further, people covered by workers’ compensation can also be treated in the public and private hospital systems.
Limitations
Although diagnoses were recorded in the data sources, we could not identify specific indications for procedures or the spinal regions in which surgery was undertaken (cervical, thoracic, lumbar). Information about patient pain management, procedural techniques, and devices was not available to us.
Conclusion
The privately funded spinal surgery rate continues to be larger than the publicly funded procedure rate, and it has also increased more rapidly. These differences may indicate that some privately funded procedures are unnecessary, or that the number of publicly funded procedures does not reflect clinical need. The factors that influence whether spinal surgery is undertaken should be further investigated, including financial considerations, access to specialist care and surgery, and the preferences of patients and physicians with respect to surgical and non‐surgical care. Our findings could assist the evaluation of spinal surgery policies and the planning of services,3 and also contribute to reducing low value care.10
Box 2 – Demographic and clinical characteristics of adults who underwent elective procedures for degenerative spinal conditions in New South Wales, 2001–20, by procedure type*
|
Characteristic |
Fusion |
Decompression |
Disc replacement |
All procedures |
|||||||||||
|
|
|||||||||||||||
|
All procedures |
53 606 |
100 225 |
1257 |
155 088 |
|||||||||||
|
Sex (men) |
25 792 (48.1%) |
57 062 (56.9%) |
699 (55.6%) |
83 553 (53.9%) |
|||||||||||
|
Age (years), mean (SD) |
59.1 (14.8) |
57.4 (16.3) |
43.3 (9.7) |
57.9 (15.9) |
|||||||||||
|
18–29 years |
1593 (3.0%) |
4942 (4.9%) |
112 (8.9%) |
6647 (4.3%) |
|||||||||||
|
30–34 years |
1634 (3.0%) |
5372 (5.4%) |
140 (11.1%) |
7146 (4.6%) |
|||||||||||
|
35–39 years |
2796 (5.2%) |
7028 (7.0%) |
208 (16.5%) |
10 032 (6.5%) |
|||||||||||
|
40–44 years |
4116 (7.7%) |
8271 (8.3%) |
267 (21.2%) |
12 654 (8.2%) |
|||||||||||
|
45–49 years |
5065 (9.4%) |
8849 (8.8%) |
251 (20.0%) |
14 165 (9.1%) |
|||||||||||
|
50–54 years |
5348 (10.0%) |
9061 (9.0%) |
139 (11.1%) |
14 548 (9.4%) |
|||||||||||
|
55–59 years |
5667 (10.6%) |
9579 (9.6%) |
83 (6.6%) |
15 329 (9.9%) |
|||||||||||
|
60–64 years |
6342 (11.8%) |
10 234 (10.2%) |
36 (2.9%) |
16 612 (10.7%) |
|||||||||||
|
65 years and over |
21 045 (39.3%) |
36 889 (36.8%) |
21 (1.7%) |
57 955 (37.4%) |
|||||||||||
|
Living with a partner |
35 632 (66.5%) |
67 692 (67.5%) |
840 (66.8%) |
104 164 (67.2%) |
|||||||||||
|
Funding scheme |
|
|
|
|
|||||||||||
|
Private |
35 355 (66.0%) |
65 991 (65.8%) |
820 (65.2%) |
102 166 (65.9%) |
|||||||||||
|
Public |
11 558 (21.6%) |
23 535 (23.5%) |
194 (15.4%) |
35 287 (22.8%) |
|||||||||||
|
Workers’ compensation |
6693 (12.5%) |
10 669 (10.7%) |
243 (19.3%) |
17 635 (11.4%) |
|||||||||||
|
Remoteness of residence† |
|
|
|
|
|||||||||||
|
Major cities |
40 068 (74.7%) |
75 928 (75.8%) |
991 (78.8%) |
116 987 (75.4%) |
|||||||||||
|
Inner regional |
9827 (18.3%) |
18 083 (18.0%) |
197 (15.7%) |
28 107 (18.1%) |
|||||||||||
|
Outer regional/remote/very remote |
2231 (4.2%) |
4596 (4.6%) |
30 (2.4%) |
6857 (4.4%) |
|||||||||||
|
Missing data |
1480 (2.8%) |
1618 (1.6%) |
39 (3.1%) |
3137 (2.0%) |
|||||||||||
|
Principal diagnosis |
|
|
|
|
|||||||||||
|
Intervertebral disc disorders |
17 323 (32.3%) |
43 709 (43.6%) |
846 (67.3%) |
61 878 (39.9%) |
|||||||||||
|
Spondylopathies |
16 005 (29.9%) |
33 854 (33.8%) |
134 (10.7%) |
49 993 (32.2%) |
|||||||||||
|
Backpain |
6970 (13.0%) |
13 531 (13.5%) |
197 (15.7%) |
20 698 (13.3%) |
|||||||||||
|
Deforming dorsopathies |
9130 (17.0%) |
732 (0.7%) |
6 (0.5%) |
9868 (6.4%) |
|||||||||||
|
Disorders of central nervous system, nerve root |
1976 (3.7%) |
5275 (5.3%) |
50 (4.0%) |
7301 (4.7%) |
|||||||||||
|
Symptoms involved nervous and musculoskeletal systems |
545 (1.0%) |
568 (0.6%) |
7 (0.6%) |
1120 (0.7%) |
|||||||||||
|
Others |
1657 (3.1%) |
2556 (2.6%) |
17 (1.4%) |
4230 (2.7%) |
|||||||||||
|
Financial year |
|
|
|
|
|||||||||||
|
2001–02 |
1003 (1.9%) |
3444 (3.4%) |
NA |
4447 (2.9%) |
|||||||||||
|
2002–03 |
1162 (2.2%) |
3983 (4.0%) |
NA |
5145 (3.3%) |
|||||||||||
|
2003–04 |
1392 (2.6%) |
3798 (3.8%) |
NA |
5190 (3.3%) |
|||||||||||
|
2004–05 |
1427 (2.7%) |
3764 (3.8%) |
NA |
5191 (3.3%) |
|||||||||||
|
2005–06 |
1670 (3.1%) |
3986 (4.0%) |
NA |
5656 (3.6%) |
|||||||||||
|
2006–07 |
1879 (3.5%) |
4315 (4.3%) |
NA |
6194 (4.0%) |
|||||||||||
|
2007–08 |
2088 (3.9%) |
4365 (4.4%) |
NA |
6453 (4.2%) |
|||||||||||
|
2008–09 |
2304 (4.3%) |
4772 (4.8%) |
NA |
7076 (4.6%) |
|||||||||||
|
2009–10 |
2737 (5.1%) |
5311 (5.3%) |
NA |
8048 (5.2%) |
|||||||||||
|
2010–11 |
3081 (5.7%) |
5742 (5.7%) |
32 (2.5%) |
8855 (5.7%) |
|||||||||||
|
2011–12 |
3307 (6.2%) |
5676 (5.7%) |
38 (3.0%) |
9021 (5.8%) |
|||||||||||
|
2012–13 |
3399 (6.3%) |
5981 (6.0%) |
68 (5.4%) |
9448 (6.1%) |
|||||||||||
|
2013–14 |
3710 (6.9%) |
6353 (6.3%) |
162 (12.9%) |
10 225 (6.6%) |
|||||||||||
|
2014–15 |
3942 (7.4%) |
6613 (6.6%) |
134 (10.7%) |
10 689 (6.9%) |
|||||||||||
|
2015–16 |
3802 (7.1%) |
6390 (6.4%) |
132 (10.5%) |
10 324 (6.7%) |
|||||||||||
|
2016–17 |
3853 (7.2%) |
6397 (6.4%) |
155 (12.3%) |
10 405 (6.7%) |
|||||||||||
|
2017–18 |
4266 (8.0%) |
6599 (6.6%) |
193 (15.4%) |
11 058 (7.1%) |
|||||||||||
|
2018–19 |
4340 (8.1%) |
6671 (6.7%) |
189 (15.0%) |
11 200 (7.2%) |
|||||||||||
|
2019–20 |
4244 (7.9%) |
6065 (6.1%) |
154 (12.3%) |
10 463 (6.7%) |
|||||||||||
|
|
|||||||||||||||
|
NA = not applicable (no public funding for artificial disc replacement until 2010–11). * Characteristics by funding type are provided in the Supporting Information, table 4. † Based on the Australian Statistical Geography Standard 2016 classification;19 remoteness categories were mapped to the Statistical Area Level 2 of residential postcodes. |
|||||||||||||||
Box 3 – Adults who underwent elective procedures for degenerative spinal conditions in New South Wales, 2001–20, by procedure type and funding type: crude rates, with 95% confidence intervals
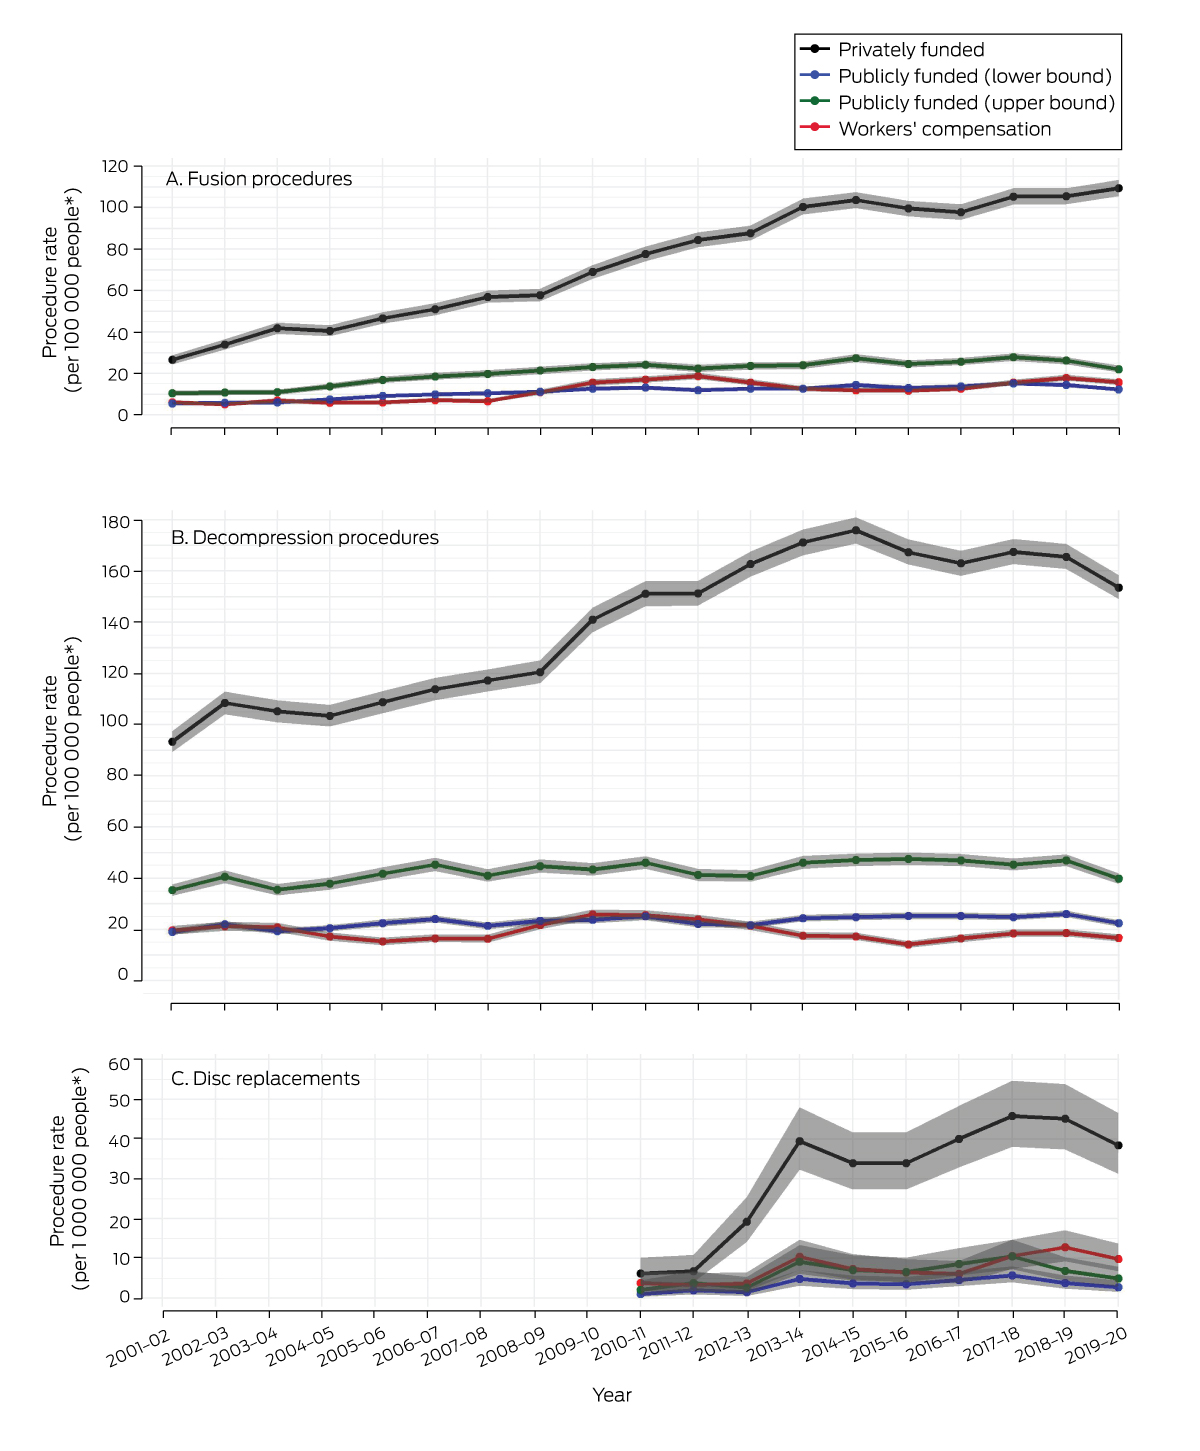
* Denominators for publicly funded, lower bound procedure rates: NSW people aged 18 years or more;18 publicly funded, upper bound rates: NSW people aged 18 years or more who did not have hospital cover private health insurance;17,18 privately funded procedure rates: NSW people aged 18 years or more who had hospital cover private health insurance;17 workers’ compensation procedure: NSW people aged 18 or more with workers’ compensation cover. Prior to April 2011, few disc replacement procedures were undertaken (any funding type), and most were associated with claims for a fusion or for an indication other than degenerative spine disorders.20 The data for these graphs are included in the Supporting Information, table 5.
Box 4 – Working age adults (18–64 years) who underwent elective fusion or decompression procedures in New South Wales, 2001–20, by funding type: age‐ and sex‐adjusted rates, with 95% confidence intervals
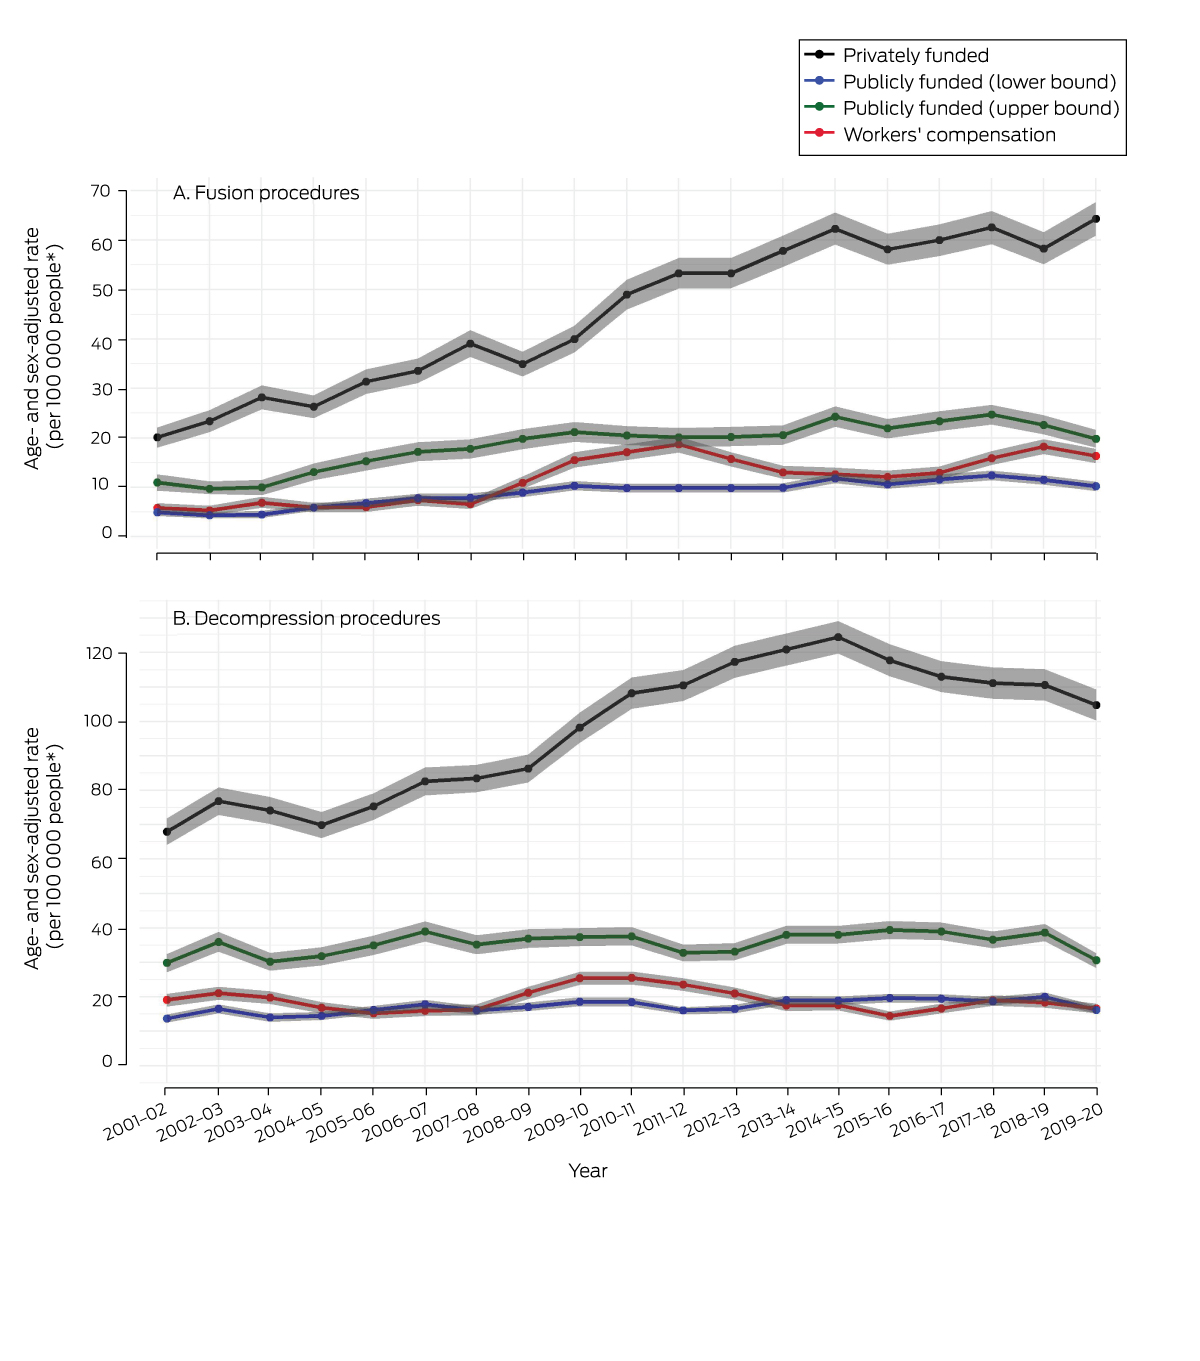
* Denominators for publicly funded, lower bound procedure rates: NSW people aged 18–64 years;18 publicly funded, upper bound rates: NSW people aged 18–64 years who did not have hospital cover private health insurance;17,18 privately funded procedure rates: NSW people aged 18–64 years who had hospital cover private health insurance;17 workers’ compensation procedure: NSW people aged 18–64 years with workers’ compensation cover. Standardisation for age and sex based on 2016 national census data for NSW.17 The data for these graphs are included in the Supporting Information, table 9.
Received 2 March 2023, accepted 25 May 2023
- Duong Thuy Tran1
- Adriane M Lewin2
- Louisa Jorm1
- Ian A Harris1,3
- 1 Centre for Big Data Research in Health, the University of New South Wales, Sydney, NSW
- 2 The University of New South Wales, Sydney, NSW
- 3 Whitlam Orthopaedic Research Centre, Ingham Institute for Applied Medical Research, Sydney, NSW
Open access:
Open access publishing facilitated by University of New South Wales, as part of the Wiley – University of New South Wales agreement via the Council of Australian University Librarians.
We thank the NSW Ministry of Health for providing access to the data we analysed, the NSW Centre for Health Record Linkage for conducting record linkage, the State Insurance Regulatory Agency, and the Australian Orthopaedic Association Research Foundation, the Australia and New Zealand Low Back Pain Research Network, and the National Health and Medical Research Council (APP1162833) for financial support. Duong Thuy Tran is supported by the Australia and New Zealand Low Back Pain Research Network. The funding sources were not involved in study design, data collection, analysis, or interpretation, reporting, or publication.
No relevant disclosures.
- 1. Lewin AM, Fearnside M, Kuru R, et al. Rates, costs, return to work and reoperation following spinal surgery in a workers’ compensation cohort in New South Wales, 2010–2018: a cohort study using administrative data. BMC Health Serv Res 2021; 21: 955.
- 2. Wong AYL, Karppinen J, Samartzis D. Low back pain in older adults: risk factors, management options and future directions. Scoliosis Spinal Disord 2017; 12: 14.
- 3. Australian Commission on Safety and Quality in Health Care and Australian Institute of Health and Welfare. The fourth Australian atlas of healthcare variation. Sydney: ACSQHC, 2021. https://www.safetyandquality.gov.au/our‐work/healthcare‐variation/fourth‐atlas‐2021 (viewed June 2023).
- 4. Evans L, O'Donohoe T, Morokoff A, Drummond K. The role of spinal surgery in the treatment of low back pain. Med J Aust 2023; 218: 40‐45. https://www.mja.com.au/journal/2023/218/1/role‐spinal‐surgery‐treatment‐low‐back‐pain
- 5. Grotle M, Småstuen M, Fjeld O, et al. Lumbar spine surgery across 15 years: trends, complications and reoperations in a longitudinal observational study from Norway. BMJ Open 2019; 9: e028743.
- 6. Martin BI, Mirza SK, Spina N, et al. Trends in lumbar fusion procedure rates and associated hospital costs for degenerative spinal diseases in the United States, 2004 to 2015. Spine (Phila Pa 1976) 2019; 44: 369‐376.
- 7. Ponkilainen VT, Huttunen TT, Neva MH, et al. National trends in lumbar spine decompression and fusion surgery in Finland, 1997–2018. Acta Orthop 2021; 92: 199‐203.
- 8. Sivasubramaniam V, Patel HC, Ozdemir BA, Papadopoulos MC. Trends in hospital admissions and surgical procedures for degenerative lumbar spine disease in England: a 15‐year time‐series study. BMJ Open 2015; 5: e009011.
- 9. Harris IA, Dao ATT. Trends of spinal fusion surgery in Australia: 1997 to 2006. ANZ J Surg 2009; 79: 783‐788.
- 10. Buchbinder R, Underwood M, Hartvigsen J, et al. The Lancet series call to action to reduce low value care for low back pain: an update. Pain 2020; 161 (Suppl 1): S57‐S64.
- 11. State Insurance Regulatory Agency (NSW). Workers compensation insurance. https://www.sira.nsw.gov.au/insurance‐coverage/workers‐compensation‐insurance (viewed Aug 2022).
- 12. Medical Services Advisory Committee. Application 1145: artificial intervertebral disc replacement in patients with cervical degenerative disc disease [public summary document]. 29 Nov 2011. http://www.msac.gov.au/internet/msac/publishing.nsf/Content/FD4160B6D7E29A41CA25801000123B84/$File/1145_PSD.pdf (viewed Sept 2022).
- 13. Australian Consortium for Classification Development. The international statistical classification of diseases and related health problems, tenth revision, Australian modification. Tenth edition. Adelaide: IHPA; Lane Publishing, 2016.
- 14. Australian Consortium for Classification Development. Australian classification of health interventions, tenth edition. Adelaide: IHPA; Lane Publishing, 2017.
- 15. von Elm E, Altman DG, Egger M, et al; STROBE Initiative. Strengthening the reporting of observational studies in epidemiology (STROBE) statement: guidelines for reporting observational studies. BMJ 2007; 335: 806‐808.
- 16. Australian Department of Health and Aged Care. 2020–25 National Health Reform Agreement (NHRA): Australian Government; 2023. https://www.health.gov.au/our‐work/2020‐25‐national‐health‐reform‐agreement‐nhra (viewed Jan 2023).
- 17. Australian Prudential Regulation Authority. Private health insurance membership trends. Mar 2023. https://www.apra.gov.au/sites/default/files/2023‐05/Quarterly%20Private%20Health%20Insurance%20Membership%20Trends%20March%202023.xlsx (viewed July 2023).
- 18. Australian Bureau of Statistics. Estimated resident population by state, age and sex, 2001 onwards. 2022. https://explore.data.abs.gov.au/?fs[0]=People%2C0%7CPopulation%23POPULATION%23&pg=0&fc=People (viewed Oct 2022).
- 19. Australian Bureau of Statistics. 1270.0.55.005. Australian Statistical Geography Standard (ASGS), volume 5: remoteness structure, July 2016. 16 Mar 2018. https://www.abs.gov.au/ausstats/abs@.nsf/mf/1270.0.55.005 (viewed Oct 2022).
- 20. Medical Services Advisory Committee. Review of interim funded service. Artificial intervertebral disc replacement: lumbar. MSAC application 1090.1: assessment report. Apr 2011. http://www.msac.gov.au/internet/msac/publishing.nsf/Content/5DE3C448FF252171CA25801000123B66/$File/1090.1‐Assessment‐Report.pdf (viewed July 2023).
- 21. Weinstein JN, Lurie JD, Olson PR, et al. United States’ trends and regional variations in lumbar spine surgery: 1992–2003. Spine (Phila Pa 1976) 2006; 31: 2707‐2714.
- 22. Bae HW, Rajaee SS, Kanim LE. Nationwide trends in the surgical management of lumbar spinal stenosis. Spine (Phila Pa 1976) 2013; 38: 916‐926.
- 23. Deyo RA, Mirza SK, Martin BI, et al. Trends, major medical complications, and charges associated with surgery for lumbar spinal stenosis in older adults. JAMA 2010; 303: 1259‐1265.
- 24. Machado GC, Maher CG, Ferreira PH, et al. Trends, complications, and costs for hospital admission and surgery for lumbar spinal stenosis. Spine (Phila Pa 1976) 2017; 42: 1737‐1743.
- 25. Australian Department of Health and Aged Care. Changes to MBS items for spinal surgery services. Updated 12 Oct 2018. http://www.mbsonline.gov.au/internet/mbsonline/publishing.nsf/Content/773E298D6CD05602CA25831A00000E58/$File/Spine%20Surgery%20Quick%20reference%20guide.pdf (viewed Sept 2022).
- 26. Harris IA, Traeger A, Stanford R, et al. Lumbar spine fusion: what is the evidence? Intern Med J 2018; 48: 1430‐1434.
- 27. Harris IA, Sidhu V, Mittal R, Adie S. Surgery for chronic musculoskeletal pain: the question of evidence. Pain 2020; 161 (Suppl 1): S95‐S103.
Abstract
Objective: To investigate elective rates of spinal fusion, decompression, and disc replacement procedures for people with degenerative conditions, by funding type (public, private, workers’ compensation).
Design, setting: Cross‐sectional study; analysis of hospitals admissions data extracted from the New South Wales Admitted Patient Data Collection.
Participants: All adults who underwent elective spinal surgery (spinal fusion, decompression, disc replacement) in NSW, 1 July 2001 – 30 June 2020.
Main outcome measures: Crude and age‐ and sex‐adjusted procedure rates, by procedure, funding type, and year; annual change in rates, 2001–20, expressed as incidence rate ratios (IRRs).
Results: During 2001–20, 155 088 procedures in 129 525 adults were eligible for our analysis: 53 606 fusion, 100 225 decompression, and 1257 disc replacement procedures. The privately funded fusion procedure rate increased from 26.6 to 109.5 per 100 000 insured adults (per year: IRR, 1.06; 95% confidence interval [CI], 1.05–1.07); the workers’ compensation procedure rate increased from 6.1 to 15.8 per 100 000 covered adults (IRR, 1.04; 95% CI, 1.01–1.06); the publicly funded procedure rate increased from 5.6 to 12.4 per 100 000 adults (IRR, 1.03; 95% CI, 1.01–1.06), and from 10.5 to 22.1 per 100 000 adults without hospital cover private health insurance (IRR, 1.03; 95% CI, 1.01–1.05). The privately funded decompression procedure rate increased from 93.4 to 153.6 per 100 000 people (IRR, 1.02; 95% CI, 1.01–1.03); the workers’ compensation procedure rate declined from 19.7 to 16.7 per 100 000 people (IRR, 0.98; 95% CI, 0.96–0.99), and the publicly funded procedure rate did not change significantly. The privately funded disc replacement procedure rate increased from 6.2 per million in 2010–11 to 38.4 per million people in 2019–20, but did not significantly change for the other two funding groups. The age‐ and sex‐adjusted rates for privately and publicly funded fusion and decompression procedures were similar to the crude rates.
Conclusions: Privately funded spinal surgery rates continue to be larger than for publicly funded procedures, and they have also increased more rapidly. These differences may indicate that some privately funded procedures are unnecessary, or that the number of publicly funded procedures does not reflect clinical need.