


The known: In developed countries, vitamin C deficiency is more frequent among men, older people, people who smoke or are overweight, and those living in areas of lower socio‐economic status.
The new: In the largest Australian study of risk factors for low vitamin C levels to date, the population proportion of findings of low vitamin C levels was larger for people from areas of lower socio‐economic status or living in regional or remote communities.
The implications: Socio‐economic disadvantage increases the risk of vitamin C deficiency, which is a significant public health problem in both developed and developing countries.
Vitamin C plays diverse physiological roles, including in the assembly of mature collagen, reactive oxygen species scavenging, and immune system function.1 Vitamin C deficiency causes symptoms that include poor wound healing and, in cases of severe deficiency, scurvy, a vessel‐mediated bleeding disorder. It is critical that scurvy be recognised and treated early, as fatal haemorrhage is possible in advanced disease.2
Recommended vitamin C intake for adults is 45 mg/day, and 60 mg/day for pregnant women and 85 mg/day for lactating women.3 Testing methods and reference ranges differ between countries, but serum vitamin C levels of 40 μmol/L or more are generally regarded as normal; hypovitaminosis is defined as 12–39 μmol/L and significant deficiency as values lower than 11.4 μmol/L.4,5,6 Scurvy is rare in developed countries, but studies in the United States, Canada, the United Kingdom, and Germany have found a relatively high prevalence of low vitamin C levels (17–26%).4,7,8,9 The prevalence of vitamin C deficiency in the United States, Canada, and Germany in these studies was 3–7%;4,7,8 it was higher in the United Kingdom (men, 26%; women, 16%), but this study included only people with low incomes.9 These and other investigations2,4,10 have found that the risk of vitamin C deficiency is higher for men, older people, those who misuse alcohol or smoke, for people with psychiatric or neurodevelopmental disorders, or cancer, or undergoing renal replacement therapy, and for residents of areas of low socio‐economic status.
In New South Wales, 13.3% of people live below the poverty line, the proportion in individual suburbs and towns ranging between 4% and 28%.11 In western Sydney, scurvy has been described in people presenting to hospital with bleeding12 and people with diabetes with lower limb ulcers,6 and low vitamin C levels have been identified by pre‐surgery screening.13 We examined the relationship between serum vitamin C status and demographic factors in NSW by analysing data from the Royal Prince Alfred Hospital, a centralised public referral hospital in Sydney.
Methods
We undertook a retrospective analysis of vitamin C tests undertaken by the central public reference laboratory at the Royal Prince Alfred Hospital (RPAH) during the period 1 January 2017 – 31 December 2021. This laboratory is the only NSW Health Pathology laboratory that performs vitamin C testing for inpatients and outpatients at all NSW public hospitals (apart from the Children's Hospital at Westmead); a small number of samples from other Australian states and territories are also tested. The vitamin C level, age, gender, and postcode for each tested person were extracted from the RPAH biochemistry department vitamin C testing database. Postcode‐based socio‐economic status was defined according to the Socio‐Economic Indexes for Areas (SEIFA) Index of Relative Socio‐Economic Advantage and Disadvantage (IRSAD)14 and postcode‐based geographic remoteness according to the Australian Statistical Geography Standard (ASGS), edition 3.15 For people tested more than once during the study period, the test yielding the lowest vitamin C level was included in our analysis. The indication was not recorded for most samples; in Australian studies, the most frequent reasons for testing have been easy bruising or bleeding, non‐healing ulcers in people with diabetes, and pre‐operative screening.6,12,13
Serum vitamin C concentrations had been determined by the RPAH biochemistry department laboratory using hydrophilic interaction chromatography, with a detection limit of 5 μmol/L and the normal range defined as 40–100 μmol/L.
Statistical analysis
The main outcome was vitamin C status: a concentration of 40 μmol/L or more was deemed normal, a value of 12–39 μmol/L to indicate hypovitaminosis C, and a value of less than 12 μmol/L to indicate significant deficiency.4,6 The distribution by five variables — year of testing, age, gender, IRSAD quintile, and remoteness category — was assessed both for all tested people and for the three vitamin C status categories. Data for categorical variables are summarised as numbers and frequencies, for numerical variables as medians with interquartile ranges (IQRs).
Associations between each of the five variables and vitamin C status were initially assessed in univariable ordinal logistic regression models. The parallel regression assumption was assessed with Brant's test; as it provided evidence of violation of the assumption of proportional odds for four of the univariable models (Supporting Information, table 1), univariable and multivariable multinomial models were fitted to vitamin C status. All five variables were considered in multivariable multinomial model building using the multinom function in the R package nnet,16 using manual backward elimination. Two‐way interaction terms between year and each of the other variables were sequentially added to the multivariable main effects model for testing to derive the final model; variables for which P < 0.05 were included in the final model. Two ordinary binary logistic models were fitted, and testing to identify outliers and influential data points undertaken. We report odds ratios (ORs) and adjusted ORs (aORs) with 95% confidence intervals (CIs).
We mapped the estimated rate of vitamin C test findings of hypovitaminosis C or significant deficiency (per 100 000 estimated resident population) by Statistical Area 3 (SA3) for Greater Sydney and for regional NSW by linking postcodes to SA3 geography and estimated resident population by SA3.17
All data management and statistical analyses were conducted in R 4.3.0 (R Core Team) using R Studio 2023.03.1 + 446 (Posit) and the tidyverse package suite.18 For mapping, a Statistical Areas 3 (SA3) boundary shapefile 2021 (Environmental Systems Research Institute) was downloaded from the Australian Bureau of Statistics19 and processed with the R package sf 1.0‐14.20 Multinomial regression analyses used the R package mass 7.3‐60.16
Ethics approval
Our study was approved by the Nepean Blue Mountains Local Health District Human Research Ethics Committee (LNR/17/NEPEAN/95).
Results
Of 17 507 vitamin C tests undertaken at the Royal Prince Alfred Hospital during 2017–2021, 4573 were excluded because multiple tests had been undertaken for individual people. A total of 12 934 results were included in our descriptive analysis; 6654 were for women (51.5%), 9402 for people living in major cities (73.5%), and 81 for people from remote or very remote areas (0.6%). Most tests were for people from NSW (11 652, 90%); tests were also undertaken for people in Victoria (542, 4%), Queensland (371, 3%), Tasmania (218, 2%), the Australian Capital Territory (35, 0.3%), Western Australia (15, 0.1%), South Australia (14, 0.1%) and the Northern Territory (four, < 0.1%). The clinical indication for vitamin C testing was not recorded for most tests. The total number of tests undertaken increased steadily from 1881 in 2017 to 3308 in 2021 (Box 1).
A total of 5894 people had vitamin C levels within the normal range (45.6%), 3872 had hypovitaminosis C (29.9%), and 3168 had significant vitamin C deficiency (24.5%). The proportions with significant deficiency increased with postcode‐level socio‐economic disadvantage (from 17.0% in IRSAD quintile 5 to 27.3% in quintile 1); the proportions with hypovitaminosis C were similar across the five quintiles (about 30%) (Box 1). The median age of all people tested was 47 years (IQR, 15–66 years); it was lower for people with normal vitamin C levels (32 years; IQR, 8–62 years) than for people with hypovitaminosis C (51 years; IQR, 24–68 years) or significant vitamin C deficiency (56 years; IQR, 36–70 years) (Box 2).
Univariable multinomial regression analyses
As demographic data were incomplete for 141 tests, 12 793 results were included in multinomial regression analyses. In univariable multinomial regression analyses, the likelihood of hypovitaminosis C relative to normal vitamin C levels increased with age (per year: OR, 1.02; 95% CI, 1.01–1.02), as did that of significant deficiency (OR, 1.02; 95% CI, 1.02–1.02). The likelihood of hypovitaminosis C or significant deficiency findings was significantly higher in 2017 than in any of the subsequent four years. The likelihood of hypovitaminosis C (remote/very remote v major city: OR, 2.13; 95% CI, 1.22–3.71) or significant deficiency (OR, 2.85; 95% CI, 1.64–4.95) increased with postcode‐level remoteness of residence. It also increased, albeit less consistently, with postcode‐level socio‐economic disadvantage (IRSAD quintile 1 v 5, hypovitaminosis C: OR, 1.33; 95% CI, 1.18–1.51; significant deficiency: OR, 2.05; 95% CI, 1.78–2.37). The likelihood of significant deficiency (but not hypovitaminosis C), relative to normal vitamin C levels, was higher for men than women (OR, 1.33; 95% CI, 1.22–1.45) (Box 3).
Multivariable multinomial regression analyses
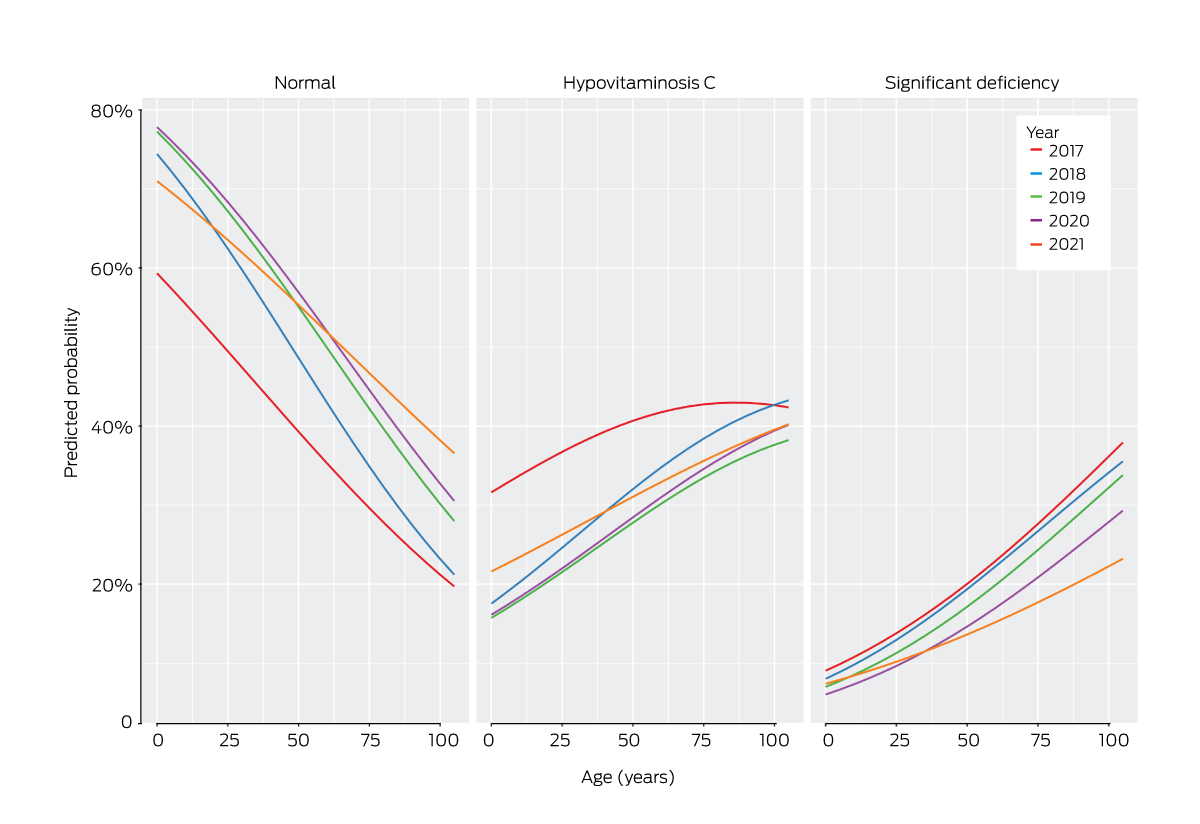
In the multivariable multinomial regression analysis, the interaction of age and year was statistically significant (P = 0.004). The associations between age and the predicted probabilities of normal vitamin C levels and significant deficiency were generally similar throughout 2017–2020, but in 2021 the probabilities of people under 75 years of age having hypovitaminosis C or significant deficiency were higher, and that of normal levels lower (Box 4). The likelihood of hypovitaminosis C or significant deficiency, relative to normal vitamin C levels, generally increased with postcode‐level socio‐economic disadvantage (IRSAD quintile 1 v 5, hypovitaminosis C: aOR, 1.35; 95% CI, 1.19–1.53; significant deficiency: aOR, 2.07; 95% CI, 1.79–2.40). The likelihood of hypovitaminosis C (aOR, 1.1; 95% CI, 1.01–1.2) or significant deficiency (aOR, 1.39; 95% CI, 1.27–1.52), relative to normal levels, was higher for men than women (Box 5). No outliers or influential data points were detected.
Geographic distribution in regional and metropolitan NSW of hypovitaminosis C and significant deficiency test results during 2017–2021
In Coffs Harbour, the rate of test results indicating hypovitaminosis C or significant deficiency was 82.1 per 100 000 residents, in Lithgow–Mudgee 58.6 per 100 000 residents, and in Tamworth–Gunnedah 48.3 per 100 000 residents; the rates in Lower Murray, Gosford, Clarence Valley, and Maitland were between 31.3 and 37.3 per 100 000 residents. In Greater Sydney, the rate was 113.2 per 100 000 residents in Liverpool, 72.8 per 100 000 in Parramatta, 64.5 per 100 000 in Camden, 55.1 per 100 000 in Bringelly–Green Valley, 53.5 per 100 000 in St Marys, 52.9 per 100 000 in Mount Druitt, 35.9 per 100 000 in Blacktown and 34.5 per 100 000 in Richmond–Windsor (Box 6).
Discussion
The distribution of prosperity and socio‐economic disadvantage in NSW is uneven in both urban and regional areas.11 Disadvantage influences diet, including the consumption of fresh fruit and vegetables, and thereby the risk of vitamin C deficiency.21 Several cohort and case studies of vitamin C deficiency in western Sydney have been reported6,12,13 but no large studies of vitamin C status across NSW.
To determine the demographic factors associated with vitamin C status in NSW, we analysed a large dataset of vitamin C tests undertaken at a central public reference laboratory. In our univariable multinomial analyses, the likelihood of hypovitaminosis C and significant deficiency relative to findings of normal vitamin C levels increased with age, level of local disadvantage, and geographic remoteness; men were more likely to have a significant deficiency than women, but not hypovitaminosis C. In the multivariable model, the likelihood of vitamin C deficiency relative to findings of normal vitamin C levels increased with socio‐economic disadvantage, and was higher for men; remoteness itself did not significantly influence the odds of deficiency, mainly because its effects overlapped with those of other factors (eg, remoteness). The number of people with significant deficiency declined each year until 2020; but in 2021, the probability of people under 75 years of age having a significant deficiency was higher than in 2019 and 2020. The reason for this rise, and for an even larger rise in the probability of hypovitaminosis C, may be related to changes in diet during COVID‐19 lockdowns, including altered consumption of fresh fruit and vegetables during this period;22 however, most relevant studies did not take socio‐economic factors into account.
The number of vitamin C tests undertaken increased each year of the study period. Increasing numbers of other vitamin tests in general practice have been reported.23 Increased vitamin C testing may be related to rising concern about dietary adequacy or, as for vitamins D and B12 testing, could reflect differences between patients and doctors regarding appropriate indications for testing.23 Alternatively, the increased number of tests may reflect population growth; the NSW population grew between 2017 and early 2020 before stagnating in 2020 and 2021 during the COVID‐19 pandemic.24
Although the number of vitamin C tests increased each year, the deficiency rate did not decline after 2018. This suggests that awareness among clinicians of the importance of vitamin C has grown, but also that some people with symptoms of deficiency do not undergo assessment or are unaware of the risk of deficiency, and that not all clinicians order tests when indicated. We do not know whether dietary intake of vitamin C is declining, but consumption of fruit and vegetables in NSW did not change during the study period;25 the proportion of NSW adults who were overweight or obese, however, increased.26
The estimated rates of hypovitaminosis C or significant deficiency test results by resident population were highest in Liverpool (in southwestern Sydney). Several of the areas with the highest low vitamin C rates were areas of greatest of disadvantage in NSW, including the Bringelly–Green Valley SA3 (poverty rate, 27.7%) and Tamworth West (24.6%).11 Higher rates may also reflect the local food environment; for example, in the Penrith local government area (in the Penrith SA3), there are as many as seventeen unhealthy food outlets for each healthy outlet.27
Limitations
Selection bias limits the external validity of our study and consequently the generalisability of our findings.28 Our study sample was not derived by random selection, and may not be representative of the general NSW population with respect to the prevalence of hypovitaminosis and significant vitamin C deficiency.28 Further, the reasons for assessing vitamin C levels were not available to us and the population from which our sample was drawn could not be clearly defined. Nor were data on risk factors for vitamin C deficiency, such as alcohol misuse, smoking, psychiatric and neurodevelopmental disorders, cancer, renal replacement therapy, and chronic dental disease, available, limiting our investigation of risk factors. The tested samples, all from public patients, were assessed at the central reference laboratory for NSW; vitamin C tests by private laboratories were not included, potentially introducing ascertainment bias, as samples from people in areas of higher socio‐economic status or urban areas are more likely to be tested at private laboratories or collection centres. During the study period, Douglass Hanly Moir — the largest private laboratory that provides vitamin C testing in metropolitan and regional NSW — tested about 2500 samples per year at Sullivan Nicolaides Pathology, Brisbane, Queensland (personal communication, Anita Vásquez‐Brown and Andy Liu, Douglass Hanly Moir Pathology, 27 Sept 2023).
Conclusion
We found that vitamin C deficiency, particularly among people living in areas of lower socio‐economic status and remote communities, may be more frequent in NSW than generally recognised. Vitamin C levels below 11.4 μmol/L are associated with clinical scurvy; the consequences of hypovitaminosis C have not been established, but symptoms can include fatigue, impaired immune responses and wound healing, and cardiovascular disease.1 Strategies for increasing the consumption of foods rich in vitamin C include education, national dietary guidelines,21 and making fresh fruit and vegetables more affordable. As people living in areas of lower socio‐economic status consume less healthy food and drink than those in higher status areas,21 increasing their household income could increase vitamin C intake; the economic stimulus measures of the Australian government during the COVID‐19 pandemic led to welfare‐dependent people eating healthier food more regularly.29 A more comprehensive investigation of the prevalence of vitamin C deficiency could identify groups for whom ensuring the recommended daily intake of vitamin C might be an inexpensive and effective public health intervention.
Box 1 – Characteristics of 12 934 people whose serum vitamin C levels were assessed at the Royal Prince Alfred Hospital, 2017–2021, overall and by vitamin C status
|
|
Vitamin C status |
|
|||||||||||||
|
Characteristic |
Significant deficiency |
Hypovitaminosis C |
Normal |
All tests |
|||||||||||
|
|
|||||||||||||||
|
All tests |
3168 (24.5%) |
3872 (29.9%) |
5894 (45.6%) |
12 934 |
|||||||||||
|
Year of test |
|
|
|
|
|||||||||||
|
2017 |
518 (27.5%) |
705 (37.5%) |
658 (35.0%) |
1881 (14.5%) |
|||||||||||
|
2018 |
593 (26.8%) |
632 (28.5%) |
989 (44.7%) |
2214 (17.1%) |
|||||||||||
|
2019 |
627 (24.5%) |
656 (25.7%) |
1271 (49.8%) |
2554 (19.8%) |
|||||||||||
|
2020 |
693 (23.3%) |
833 (28.0%) |
1451 (48.7%) |
2977 (23.0%) |
|||||||||||
|
2021 |
737 (22.3%) |
1046 (31.6%) |
1525 (46.1%) |
3308 (25.6%) |
|||||||||||
|
Gender* |
|
|
|
|
|||||||||||
|
Women |
1474 (22.1%) |
2021 (30.4%) |
3159 (47.5%) |
6654 (51.5%) |
|||||||||||
|
Men |
1691 (27.0%) |
1849 (29.5%) |
2731 (43.5%) |
6271 (48.5%) |
|||||||||||
|
Socio‐economic status (IRSAD quintile)14 |
|
|
|
|
|||||||||||
|
1 (most disadvantaged) |
853 (27.3%) |
951 (30.5%) |
1315 (42.2%) |
3119 (24.4%) |
|||||||||||
|
2 |
829 (29.5%) |
848 (30.2%) |
1131 (40.3%) |
2808 (21.9%) |
|||||||||||
|
3 |
685 (25.0%) |
792 (29.0%) |
1259 (46.0%) |
2736 (21.4%) |
|||||||||||
|
4 |
380 (21.3%) |
555 (31.0%) |
854 (47.7%) |
1789 (14.0%) |
|||||||||||
|
5 (least disadvantaged) |
399 (17.0%) |
685 (29.2%) |
1264 (53.8%) |
2348 (18.3%) |
|||||||||||
|
Remoteness15 |
|
|
|
|
|||||||||||
|
Major cities |
2146 (22.8%) |
2775 (29.5%) |
4481 (47.7%) |
9402 (73.5%) |
|||||||||||
|
Inner regional |
636 (28.1%) |
702 (31.0%) |
924 (40.9%) |
2262 (17.7%) |
|||||||||||
|
Outer regional |
334 (31.7%) |
325 (30.8%) |
396 (37.5%) |
1055 (8.2%) |
|||||||||||
|
Remote/very remote |
30 (37.0%) |
29 (35.8%) |
22 (27.2%) |
81 (0.6%) |
|||||||||||
|
|
|||||||||||||||
|
IRSAD = Index of Relative Socio‐economic Advantage and Disadvantage. * Not available for nine tested people. |
|||||||||||||||
Box 2 – Age distribution of 12 934 people whose serum vitamin C levels were assessed at the Royal Prince Alfred Hospital, 2017–2021, overall and by vitamin C status*
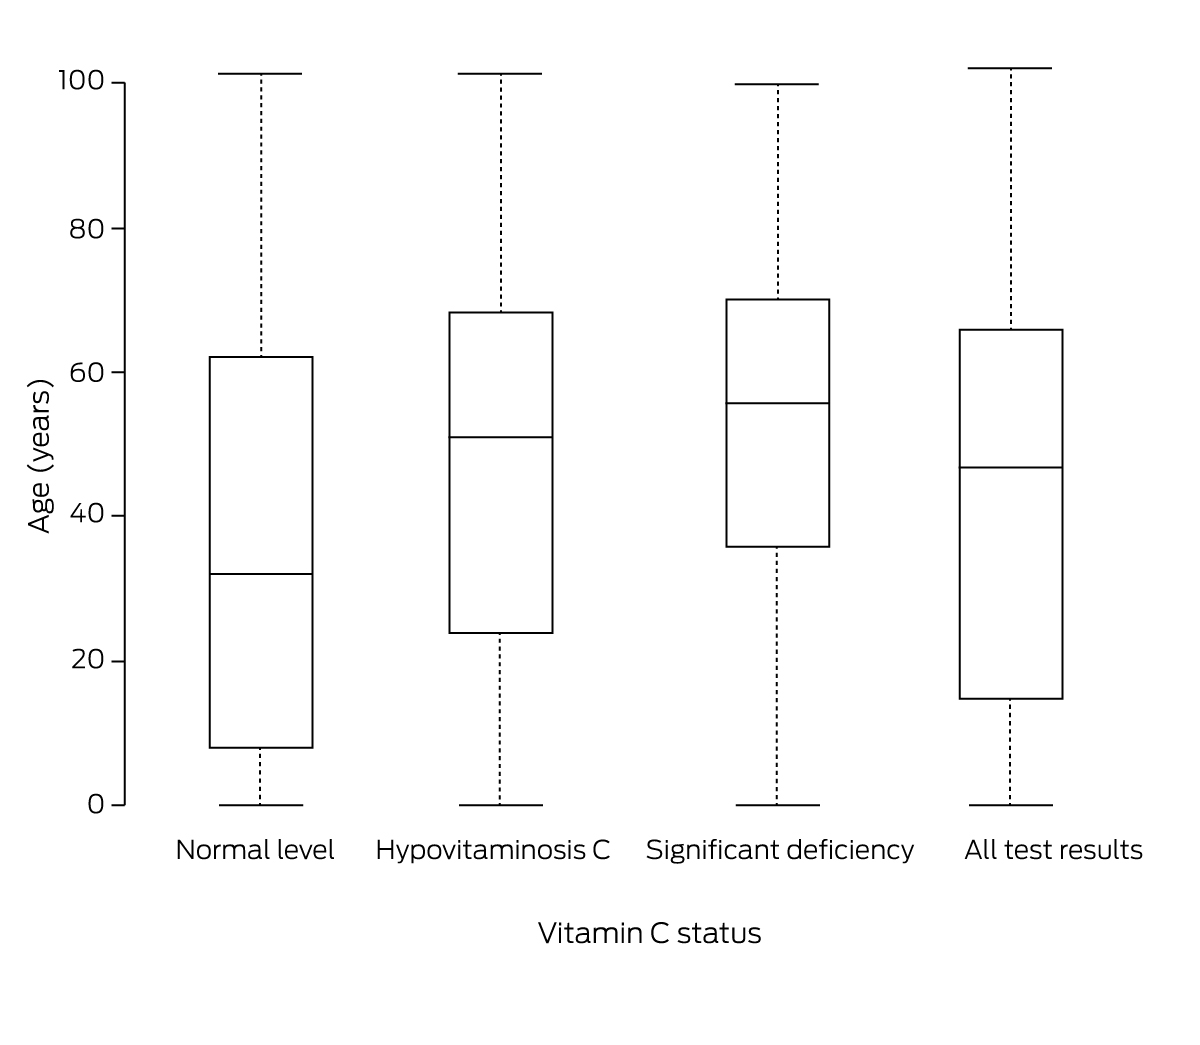
The data for this figure, and the mean serum vitamin C values, are included in the Supporting Information, table 2; a violin plot of the age distribution is included in the Supporting Information, figure 1.
Box 3 – Serum vitamin C tests undertaken for 12 793 people at the Royal Prince Alfred Hospital, 2017–2021: univariable multinomial regression analyses
|
|
Odds ratio (95% CI) |
||||||||||||||
|
Characteristic |
Hypovitaminosis C v normal |
Significant deficiency v normal |
|||||||||||||
|
|
|||||||||||||||
|
Year of test |
|
|
|||||||||||||
|
2017 |
1 |
1 |
|||||||||||||
|
2018 |
0.60 (0.52–0.69) |
0.76 (0.65–0.89) |
|||||||||||||
|
2019 |
0.48 (0.42–0.56) |
0.63 (0.54–0.73) |
|||||||||||||
|
2020 |
0.54 (0.47–0.61) |
0.61 (0.52–0.70) |
|||||||||||||
|
2021 |
0.64 (0.56–0.73) |
0.61 (0.53–0.71) |
|||||||||||||
|
Age (per year) |
1.02 (1.01–1.02) |
1.02 (1.02–1.02) |
|||||||||||||
|
Gender |
|
|
|||||||||||||
|
Women |
1 |
1 |
|||||||||||||
|
Men |
1.06 (0.98–1.15) |
1.33 (1.22–1.45) |
|||||||||||||
|
Socio‐economic status (IRSAD quintile)14 |
|
|
|||||||||||||
|
5 (least disadvantaged) |
1 |
1 |
|||||||||||||
|
4 |
1.20 (1.04–1.38) |
1.41 (1.20–1.66) |
|||||||||||||
|
3 |
1.16 (1.02–1.32) |
1.72 (1.49–1.99) |
|||||||||||||
|
2 |
1.38 (1.22–1.57) |
2.32 (2.01–2.68) |
|||||||||||||
|
1 (most disadvantaged) |
1.33 (1.18–1.51) |
2.05 (1.78–2.37) |
|||||||||||||
|
Remoteness15 |
|
|
|||||||||||||
|
Major cities |
1 |
1 |
|||||||||||||
|
Inner regional |
1.23 (1.10–1.37) |
1.44 (1.28–1.61) |
|||||||||||||
|
Outer regional |
1.33 (1.14–1.55) |
1.76 (1.51–2.06) |
|||||||||||||
|
Remote/very remote |
2.13 (1.22–3.71) |
2.85 (1.64–4.95) |
|||||||||||||
|
|
|||||||||||||||
|
CI = confidence interval; IRSAD = Index of Relative Socio‐economic Advantage and Disadvantage. |
|||||||||||||||
Box 4 – Serum vitamin C tests undertaken for 12 793 people at the Royal Prince Alfred Hospital, 2017–2021: effects plot for the year–age interaction term in the multivariable multinomial model
Box 5 – Serum vitamin C tests undertaken for 12 793 people at the Royal Prince Alfred Hospital, 2017–2021: multivariable multinomial analysis*
|
|
Adjusted odds ratio (95% CI) |
||||||||||||||
|
|
Hypovitaminosis C v normal |
Significant deficiency v normal |
|||||||||||||
|
|
|||||||||||||||
|
Term |
|
|
|||||||||||||
|
Age (per year) |
1.01 (1.01–1.02) |
1.02 (1.02–1.03) |
|||||||||||||
|
Gender |
|
|
|||||||||||||
|
Women |
1 |
1 |
|||||||||||||
|
Men |
1.10 (1.01–1.20) |
1.39 (1.27–1.52) |
|||||||||||||
|
Year of test |
|
|
|||||||||||||
|
2017 |
1 |
1 |
|||||||||||||
|
2018 |
0.44 (0.34–0.57) |
0.71 (0.53–0.95) |
|||||||||||||
|
2019 |
0.38 (0.30–0.49) |
0.59 (0.45–0.79) |
|||||||||||||
|
2020 |
0.39 (0.30–0.50) |
0.51 (0.38–0.69) |
|||||||||||||
|
2021 |
0.57 (0.45–0.73) |
0.68 (0.51–0.92) |
|||||||||||||
|
Year–age interaction |
|
|
|||||||||||||
|
2017 |
1 |
1 |
|||||||||||||
|
2018 |
1.01 (1.00–1.01) |
1.00 (1.00–1.01) |
|||||||||||||
|
2019 |
1.00 (1.00–1.01) |
1.00 (0.99–1.01) |
|||||||||||||
|
2020 |
1.00 (1.00–1.01) |
1.00 (0.99–1.01) |
|||||||||||||
|
2021 |
1.00 (0.99–1.00) |
0.99 (0.99–1.00) |
|||||||||||||
|
Socio‐economic status (IRSAD quintile)14 |
|
|
|||||||||||||
|
5 (least disadvantaged) |
1 |
1 |
|||||||||||||
|
4 |
1.19 (1.03–1.38) |
1.40 (1.18–1.66) |
|||||||||||||
|
3 |
1.20 (1.05–1.37) |
1.82 (1.57–2.12) |
|||||||||||||
|
2 |
1.32 (1.15–1.50) |
2.18 (1.88–2.53) |
|||||||||||||
|
1 (most disadvantaged) |
1.35 (1.19–1.53) |
2.07 (1.79–2.40) |
|||||||||||||
|
|
|||||||||||||||
|
CI = confidence interval; IRSAD = Index of Relative Socio‐economic Advantage and Disadvantage. * The corresponding results for the interactions of year with gender and postcode‐level socio‐economic status are included in the Supporting Information, tables 3 and 4. |
|||||||||||||||
Box 6 – Rate of 12 793 serum vitamin C tests undertaken at the Royal Prince Alfred Hospital, 2017–2021, that indicated hypovitaminosis C or significant deficiency (per 100 000 estimated resident population), by Statistical Area 3 for New South Wales*
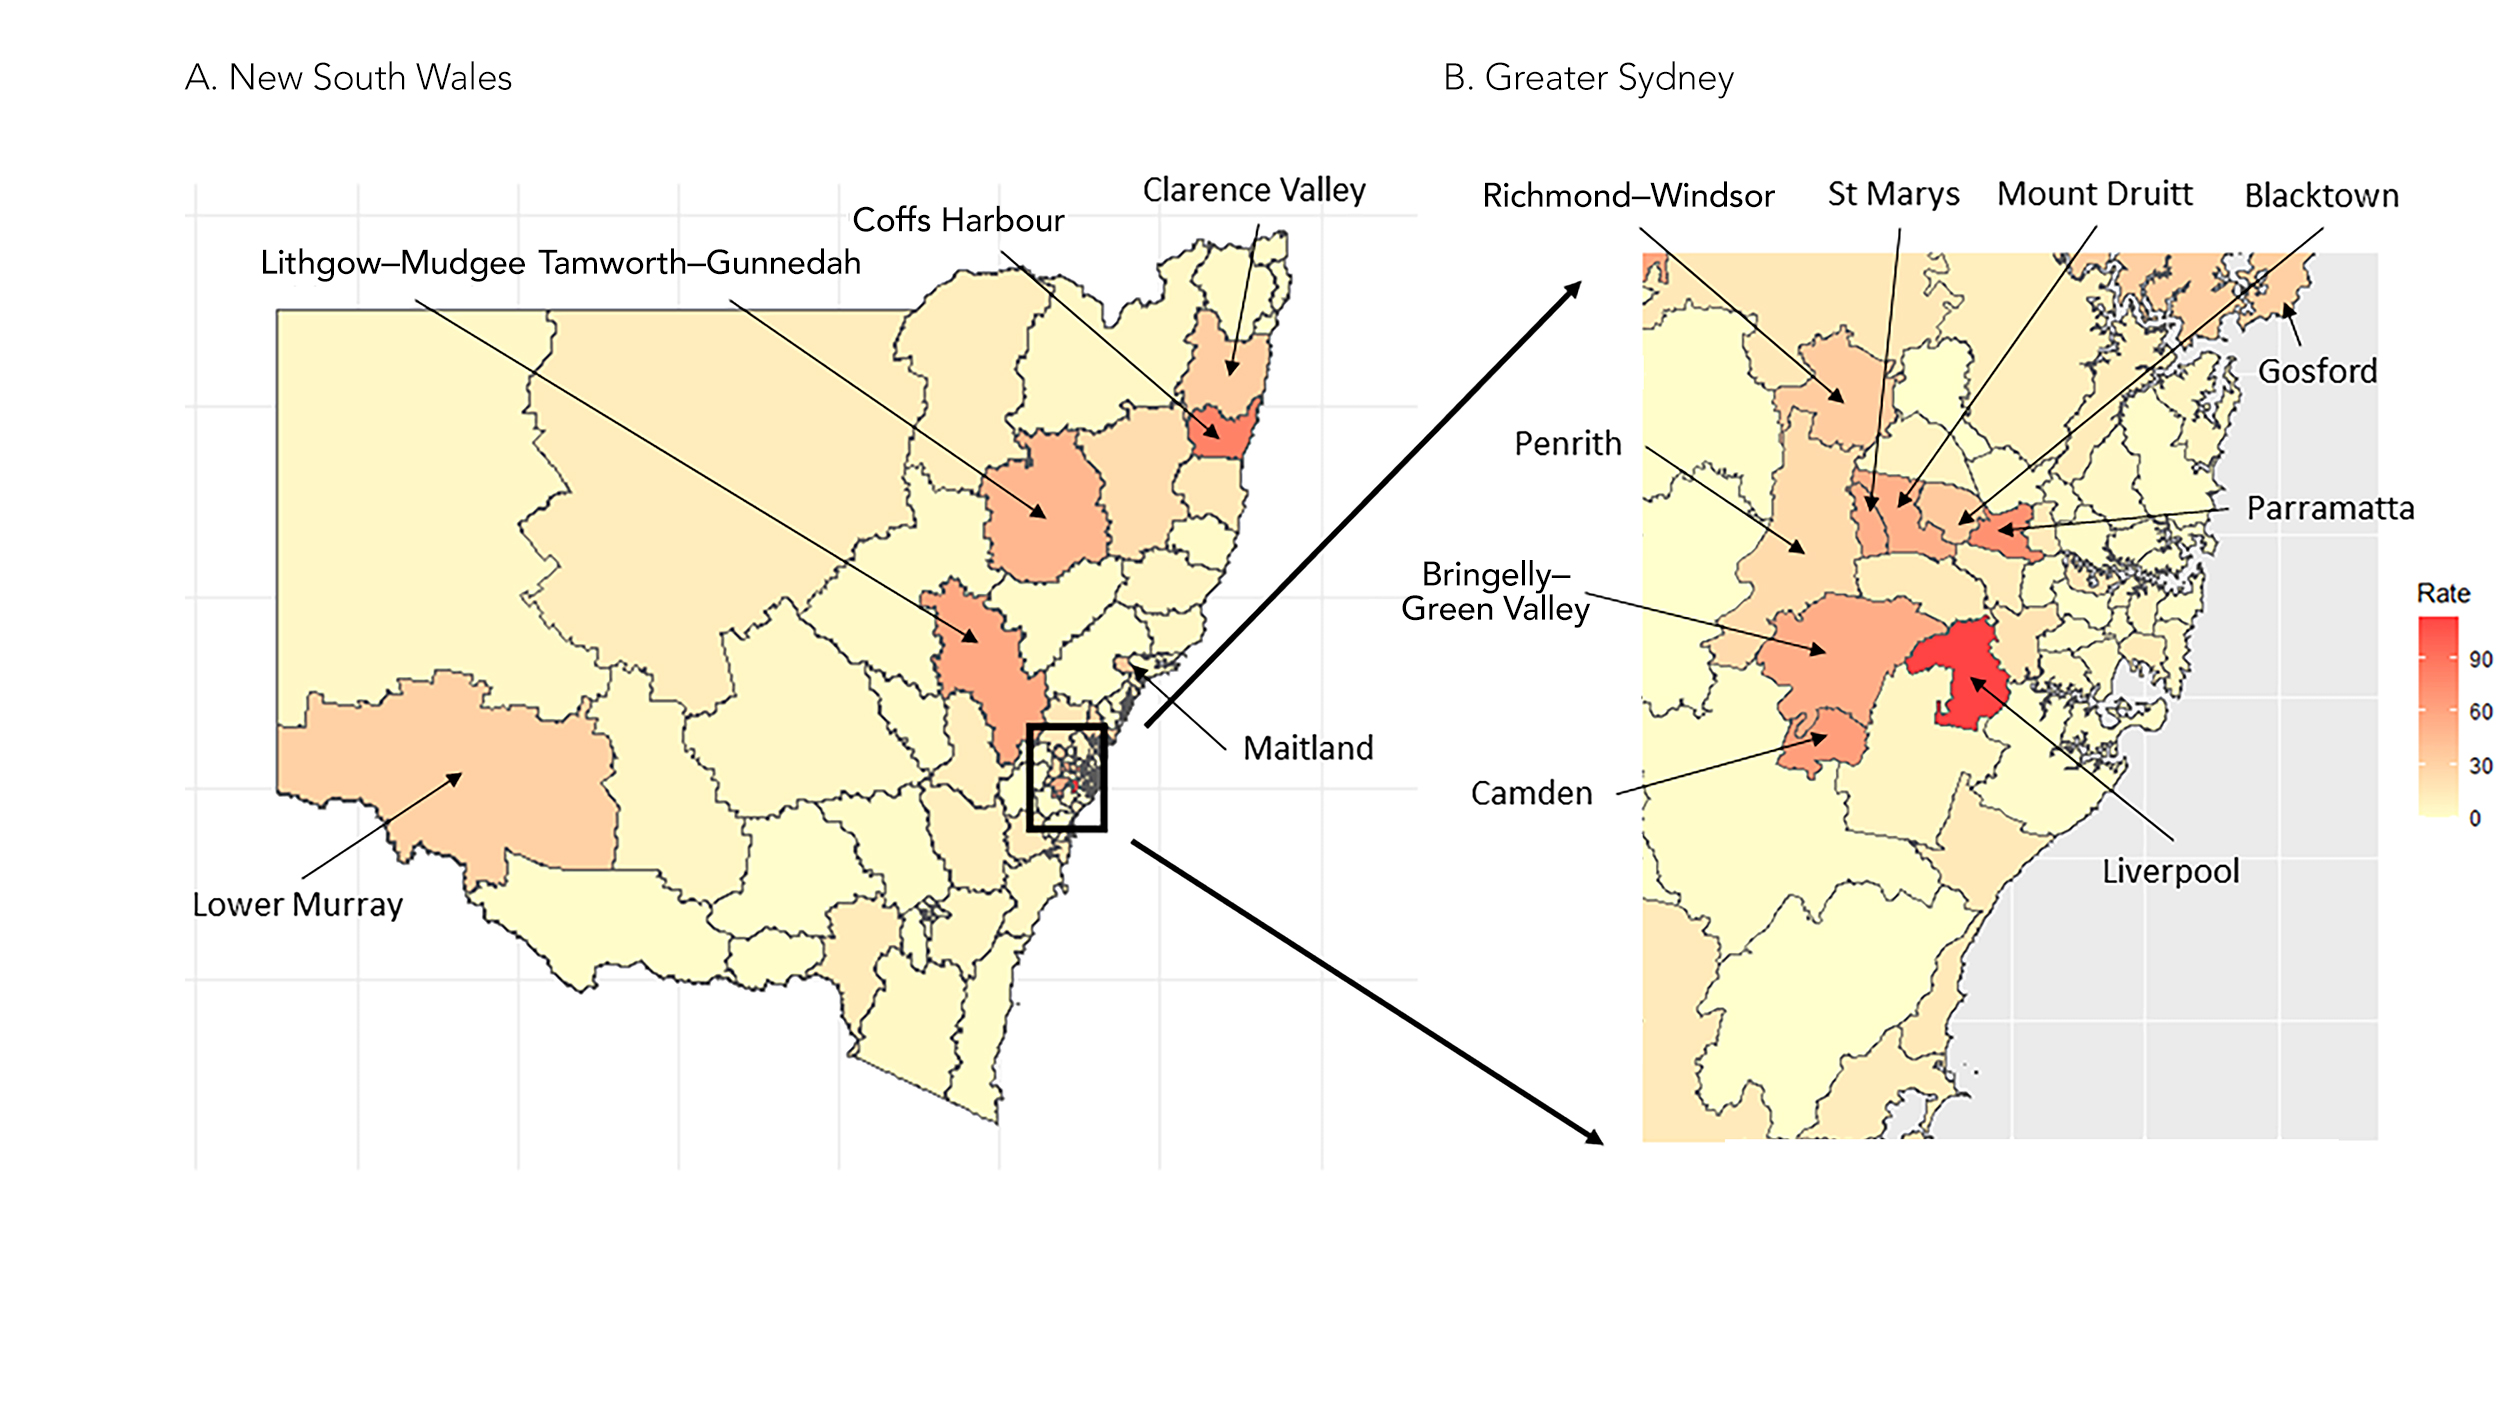
*The data for SA3 areas with rates exceeding 30 per 100 000 estimated resident population are included in the Supporting Information, table 5.
Received 27 February 2023, accepted 11 August 2023
- Puja Bhattacharyya1,2
- Kathrin Schemann3
- San San Min4,5
- David R Sullivan4,5
- Stephen J Fuller1,6
- 1 Sydney Medical School, the University of Sydney, Sydney, NSW
- 2 Blacktown Hospital, Blacktown, NSW
- 3 The University of Sydney, Sydney, NSW
- 4 Royal Prince Alfred Hospital, Sydney, NSW
- 5 NSW Health Pathology, Sydney, NSW
- 6 Nepean Hospital, Penrith, NSW
Open access:
Open access publishing facilitated by The University of Sydney, as part of the Wiley – The University of Sydney agreement via the Council of Australian University Librarians.
We acknowledge the technical assistance provided by the Sydney Informatics Hub, a core research facility of the University of Sydney. We thank Anita Vásquez‐Brown and Andy Liu (Douglass Hanly Moir Pathology, Macquarie Park NSW) for providing information about private pathology vitamin C test numbers.
No relevant disclosures.
- 1. Granger M, Eck P. Dietary vitamin C in human health. Adv Food Nutr Res 2018; 83: 281‐310.
- 2. Byard RW, Maxwell‐Stewart H. Scurvy: characteristic features and forensic issues. Am J Forensic Med Pathol 2019; 40: 43‐46.
- 3. National Health and Medical Research Council; Australian Department of Health and Ageing; New Zealand Ministry of Health. Nutrient reference values for Australia and New Zealand. Updated 13 July 2017. https://www.eatforhealth.gov.au/nutrient‐reference‐values/resources (viewed May 2023).
- 4. Schleicher RL, Carroll MD, Ford ES, Lacher DA. Serum vitamin C and the prevalence of vitamin C deficiency in the United States: 2003–2004 National Health and Nutrition Examination Survey (NHANES). Am J Clin Nutr 2009; 90: 1252‐1263.
- 5. Kallner AB, Hartmann D, Hornig DH. On the requirements of ascorbic acid in man: steady‐state turnover and body pool in smokers. Am J Clin Nutr 1981; 34: 1347‐1355.
- 6. Christie‐David DJ, Gunton JE. Vitamin C deficiency and diabetes mellitus: easily missed? Diabet Med 2017; 34: 294‐296.
- 7. Hagel AF, Albrecht H, Dauth W, et al. Plasma concentrations of ascorbic acid in a cross section of the German population. J Int Med Res 2018; 46: 168‐174.
- 8. Langlois K, Cooper M, Colapinto CK. Vitamin C status of Canadian adults: findings from the 2012/2013 Canadian Health Measures Survey. Health Rep 2016; 27: 3‐10.
- 9. Mosdol A, Erens B, Brunner EJ. Estimated prevalence and predictors of vitamin C deficiency within UK's low‐income population. J Public Health (Oxf) 2008; 30: 456‐460.
- 10. Fain O, Mathieu E, Thomas M. Scurvy in patients with cancer. BMJ 1998; 316: 1661‐1662.
- 11. Vidyattama Y, Tanton R; NSW Council of Social Services. Mapping significant economic disadvantage in New South Wales. Oct 2019. https://www.ncoss.org.au/wp‐content/uploads/2019/10/Web‐Version‐Mapping‐Economic‐Disadvantage‐in‐New‐South‐Wales‐report1.pdf (viewed May 2023).
- 12. Bhattacharyya P, Giannoutsos J, Eslick GD, Fuller SJ. Scurvy: an unrecognized and emerging public health issue in developed economies. Mayo Clin Proc 2019; 94: 2594‐2597.
- 13. Ravindran P, Wiltshire S, Das K, Wilson RB. Vitamin C deficiency in an Australian cohort of metropolitan surgical patients. Pathology 2018; 50: 654‐658.
- 14. Australian Bureau of Statistics. IRSAD. In: Census of Population and Housing: Socio‐Economic Indexes for Areas (SEIFA), Australia, 2016 (2033.0.55.001). 27 Mar 2018. https://www.abs.gov.au/ausstats/abs@.nsf/Lookup/by%20Subject/2033.0.55.001~2016~Main%20Features~IRSAD~20 (viewed Jan 2023).
- 15. Australian Bureau of Statistics. Remoteness structure. Australian Statistical Geography Standard (ASGS), edition 3. Reference period: July 2021 – June 2026. 20 July 2021. https://www.abs.gov.au/statistics/standards/australian‐statistical‐geography‐standard‐asgs‐edition‐3/jul2021‐jun2026/remoteness‐structure (viewed Jan 2023).
- 16. Venables W, Ripley BD. Package nnet. 3 May 2023. https://cran.r‐project.org/web/packages/nnet/nnet.pdf (viewed Sept 2023).
- 17. Australian Bureau of Statistics. ASGS geographic correspondences (2016), 2011 population weighted. Updated 2 Aug 2023. https://data.gov.au/data/dataset/asgs‐geographic‐correspondences‐2016 (viewed Jan 2023).
- 18. Wickham H, Averick M, Bryan J, et al. Welcome to the Tidyverse. J Open Source Softw 2019; 4: 1686.
- 19. Australian Bureau of Statistics. Digital boundary files: Australian Statistical Geography Standard (ASGS) edition 3. Reference period: July 2021 – June 2026. 20 July 2021. https://www.abs.gov.au/statistics/standards/australian‐statistical‐geography‐standard‐asgs‐edition‐3/jul2021‐jun2026/access‐and‐downloads/digital‐boundary‐files (viewed Sept 2023).
- 20. Pebesma E. Simple features for R: standardized support for spatial vector data. R Journal 2018; 10: 439‐446.
- 21. Lewis M, McNaughton SA, Rychetnik L, et al. Dietary intake, cost, and affordability by socioeconomic group in Australia. Int J Environ Res Public Health 2021; 18: 13315.
- 22. Kombanda KT, Margerison C, Booth A, Worsley A. The impact of the COVID‐19 pandemic on young Australian adults’ food practices. Curr Dev Nutr 2022; 6: nzac009.
- 23. Hofstede H, van der Burg HAM, Mulder BC, et al. Reducing unnecessary vitamin testing in general practice: barriers and facilitators according to general practitioners and patients. BMJ Open 2019; 9: e029760.
- 24. Australian Bureau of Statistics. National, state and territory population. Statistics about the population and components of change (births, deaths, migration) for Australia and its states and territories. Reference period: Sept 2022. 16 Mar 2023. https://www.abs.gov.au/statistics/people/population/national‐state‐and‐territory‐population/latest‐release#data‐downloads (viewed May 2023).
- 25. HealthStats NSW. Fruit and vegetables: recommended daily consumption by adults. 2021. https://www.healthstats.nsw.gov.au/#/indicator?name=‐beh‐nutrition‐fruitveg‐cat‐phs&location=NSW&view=Trend&measure=prevalence&groups=Food%20group&compare=Food%20group&filter=Food%20group,Vegetables,Fruit (viewed May 2023).
- 26. HealthStats NSW. Overweight and obesity in adults by body mass index. 2021. https://www.healthstats.nsw.gov.au/#/indicator?name=‐beh‐bmi‐cat‐oo‐phs&location=NSW&view=Trend&measure=prevalence&groups=Body%20mass%20index&compare=Body%20mass%20index&filter=Body%20mass%20index,Overweight%20or%20obese,Obese,Overweight (viewed May 2023).
- 27. Timba R, Morrison N, Paine G. A rapid‐mapping methodology for local food environments, and associated health actions: the case of Penrith, Australia. J Urban 2022; https://doi.org/10.1080/17549175.2022.2138951.
- 28. Hoy D, Brooks P, Woolf A, et al. Assessing risk of bias in prevalence studies: modification of an existing tool and evidence of interrater agreement. J Clin Epidemiol 2012; 65: 934‐939.
- 29. Lewis M, Lee AJ. Affording health during the COVID‐19 pandemic and associated economic downturn. Aust N Z J Public Health 2020; 44: 519‐520.
Abstract
Objectives: To examine the relationship between vitamin C status and demographic factors in New South Wales on the basis of serum vitamin C test results undertaken at the central pathology laboratory in Sydney, and to assess associations with age, gender, social disadvantage, and geographic remoteness.
Design, setting: Retrospective observational study; analysis of vitamin C test results undertaken at the Royal Prince Alfred Hospital, 1 January 2017 – 31 December 2021.
Main outcome measures: Vitamin C status (normal, serum concentration ≥ 40 μmol/L; hypovitaminosis C, 12–39 μmol/L; significant deficiency, < 12 μmol/L); associations of vitamin C status with year of testing, age, gender, socio‐economic status (Index of Relative Socio‐Economic Advantage and Disadvantage quintile), and geographic remoteness (Australian Statistical Geography Standard); rate of hypovitaminosis C or significant deficiency test results (relative to findings of normal levels; per 100 000 estimated resident population) by Statistical Area 3.
Results: Of 17 507 vitamin C tests undertaken during 2017–2021, 4573 were excluded (multiple tests for individuals); of 12 934 included results, 6654 were for women (51.5%), 9402 for people living in major cities (73.5%), and 81 for people in remote or very remote areas (0.6%). In multivariable multinomial regression analyses, significant deficiency (relative to normal test results) was more likely for men than women (adjusted odds ratio [aOR], 1.39; 95% confidence interval [CI], 1.27–1.52); the likelihood of hypovitaminosis C (IRSAD quintile 1v 5, aOR, 1.35; 95% CI, 1.19–1.53) or significant deficiency (aOR, 2.07; 95% CI, 1.79–2.40) generally increased with postcode‐level socio‐economic disadvantage. Several of the population areas with the highest low vitamin C rates were areas of greatest disadvantage in NSW.
Conclusions: The prevalence of vitamin C deficiency among older people and people living in areas of socio‐economic disadvantage indicates that population assessment of vitamin C levels would be appropriate.