


The known: Emergency department (ED) presentation numbers declined in many countries during the COVID‐19 pandemic. Data on ED activity in Australia, however, are limited.
The new: The number of presentations to Queensland public hospital EDs was 19.4% lower during the 4‐month COVID‐19 lockdown than predicted by pre‐pandemic attendance patterns. The magnitude and duration of declines were greater for less urgent presentations (by triage category) and for presentations with mental health problems, respiratory conditions, or sepsis.
The implications: Pandemic‐related restrictions should be accompanied by advice about appropriate locations for seeking medical care, by condition severity and type. Primary care providers should be supported to increase care for people who do not need hospital‐based care.
By mid‐November 2022, 6.6 million people had died from coronavirus disease 2019 (COVID‐19) and more than 600 million had been infected with its pathogen.1 Early in the pandemic, the spread of the disease varied by region; by1 July 2020, fewer than 20 cases per million population per week were reported in Australia but more than 400 per million in the Americas, 300 per million in Europe, and nearly 200 per million per week in the Middle East.2 Where the prevalence of COVID‐19 was high, multisite and population‐based reports described reduced emergency department (ED) activity of varying degrees.3,4,5,6,7 In the United States, three multisite studies that compared ED activity in 2020 with activity during the corresponding period of 2019 found reductions in all‐cause ED presentation numbers of 26% to 64%.3,4,5 Studies that compared weekly presentation numbers immediately before and after the declaration of the pandemic found declines ranging from 16% to 66%.6,7 The characteristics of ED presentations had also changed; there were fewer presentations by children,3 with non‐emergency conditions,8 or with life‐threatening conditions such as acute myocardial infarction and stroke,9 and more by people with infectious respiratory conditions.3,4
The few publications that describe the impact of COVID‐19 on ED activity in Australia10,11,12 have typically assessed only short periods and did not take underlying seasonality and progressive trends into account. As the number of COVID‐19 cases in Australia during 2020–21 was lower than in many countries, local data are needed to assess the impact of COVID‐19 and related public health measures on ED activity. We therefore examined ED presentation numbers in Queensland during the COVID‐19 pandemic to mid‐2021.
Methods
We undertook a retrospective analysis of presentations to public hospital EDs in Queensland (2020 population: about 5.2 million people across 1.85 million square kilometres) during 1 January 2018 – 30 June 2021. Following the declaration of the COVID‐19 pandemic by the World Health Organization on 11 March 2020, an array of public health measures were introduced at various times in Queensland, including closure of schools and non‐essential businesses, quarantine for returning overseas travellers, and restrictions on movement in public spaces.
Data collection and cleaning
We analysed routinely collected administrative health data from 105 EDs that report to the Emergency Data Collection, a centrally managed state‐based repository.13 We requested dates and times of ED presentation, triage, and service completion, mode of arrival, Australasian Triage Scale (ATS) category, age, sex, Indigenous status, usual residence postcode, facility, payer type, discharge disposition, and ED primary diagnosis code (International Statistical Classification of Diseases, tenth revision, Australian modification; ICD‐10‐AM). We excluded data for people who had attended the ED for COVID‐19 testing only (Supporting Information, part 1).
Categorisation: clinical urgency and diagnostic groups
We report total ED presentation numbers (daily), as well as presentations by triage category (daily) and diagnostic category (weekly, commencing 1–7 January 2018). The ATS is used by ED triage nurses to prioritise patients by urgency, with recommended maximum waiting times for clinical assessment and treatment ranging from ATS 1 (most urgent, to be seen immediately) to ATS 5 (least urgent, to be seen within 120 minutes).14 Reasons for ED presentation were defined by ICD‐10‐AM code, either combined under major diagnostic categories (defined by the Independent Health and Aged Care Pricing Authority) as cardiac conditions, respiratory conditions, mental health problems, or injury‐related conditions,15 or ICD‐10‐AM codes alone (stroke and sepsis) (Supporting Information, table 1). The selected conditions are frequent reasons for ED presentations under normal circumstances.
Study period definitions
We defined three key periods for analysis: the pre‐pandemic period (1 January 2018 – 10 March 2020), the Queensland lockdown period (ie, the period during which restrictions were most stringent:16 11 March 2020 – 30 June 2020), and the subsequent period of easing restrictions (1 July 2020 – 30 June 2021). The date for the start of a sustained reduction in presentation number was defined as the first day on which the number was lower than the 95% confidence interval for the predicted number (based on the pre‐pandemic period); the date of normalisation was defined as the first of ten consecutive days (presentations by ATS category) or the first day of three weeks (presentations by diagnostic category or condition) in which the number of presentations had returned to within 10% of the predicted number.
Data analysis
For our time series analysis of daily presentations for 1 January 2018 – 10 March 2020 we used the open‐source software code, Prophet, in R 3.6.0 (R Foundation for Statistical Computing).17 Time series analysis provides a forecast of expected presentation numbers on the basis of prior trends, including seasonality. Prophet applies a generalised additive, piecewise linear regression model and automatically estimates trend, daily, weekly, annual, and holiday effects; seasonality is fitted as a Fourier series.18 We calculated predicted daily presentation numbers (with 95% confidence limits) for the lockdown period. Prophet has been compared with traditional autoregressive integrated moving average (ARIMA) modelling, but provides more accurate predictions for datasets with marked seasonality and holiday effects.19
The mean difference between predicted and actual presentation numbers during the lockdown period was calculated as a proportion (with 95% confidence interval [CI]), both for all ED presentations and by ATS category and diagnostic category or condition.
Ethics approval
The Gold Coast Health (LNR/2020/QGC/65436) and Griffith University (2020/567) human research ethics committees approved our study. Our analysis of health data complied with Public Health Act 2005 (Qld) requirements.
Results
The number of ED presentations declined markedly within two weeks of the WHO pandemic declaration (11 March 2020) (Box 1). The mean difference between actual and predicted daily presentation numbers during the lockdown period was –19.4% (95% CI, –17.9% to –20.9%); (predicted mean number: 5935; actual mean number: 4786 presentations). The lowest number of presentations was on 8 April (3963 presentations), but the maximum divergence between actual and predicted case numbers was on 5 April, when the number of presentations was 33.6% lower than predicted (95% CI, –31.1% to –36.2%). At the start of the easing of restrictions (1 July 2020), the weekly presentation number was 13.1% lower than predicted (95% CI, –16.8% to –9.2%).
Presentations by triage category
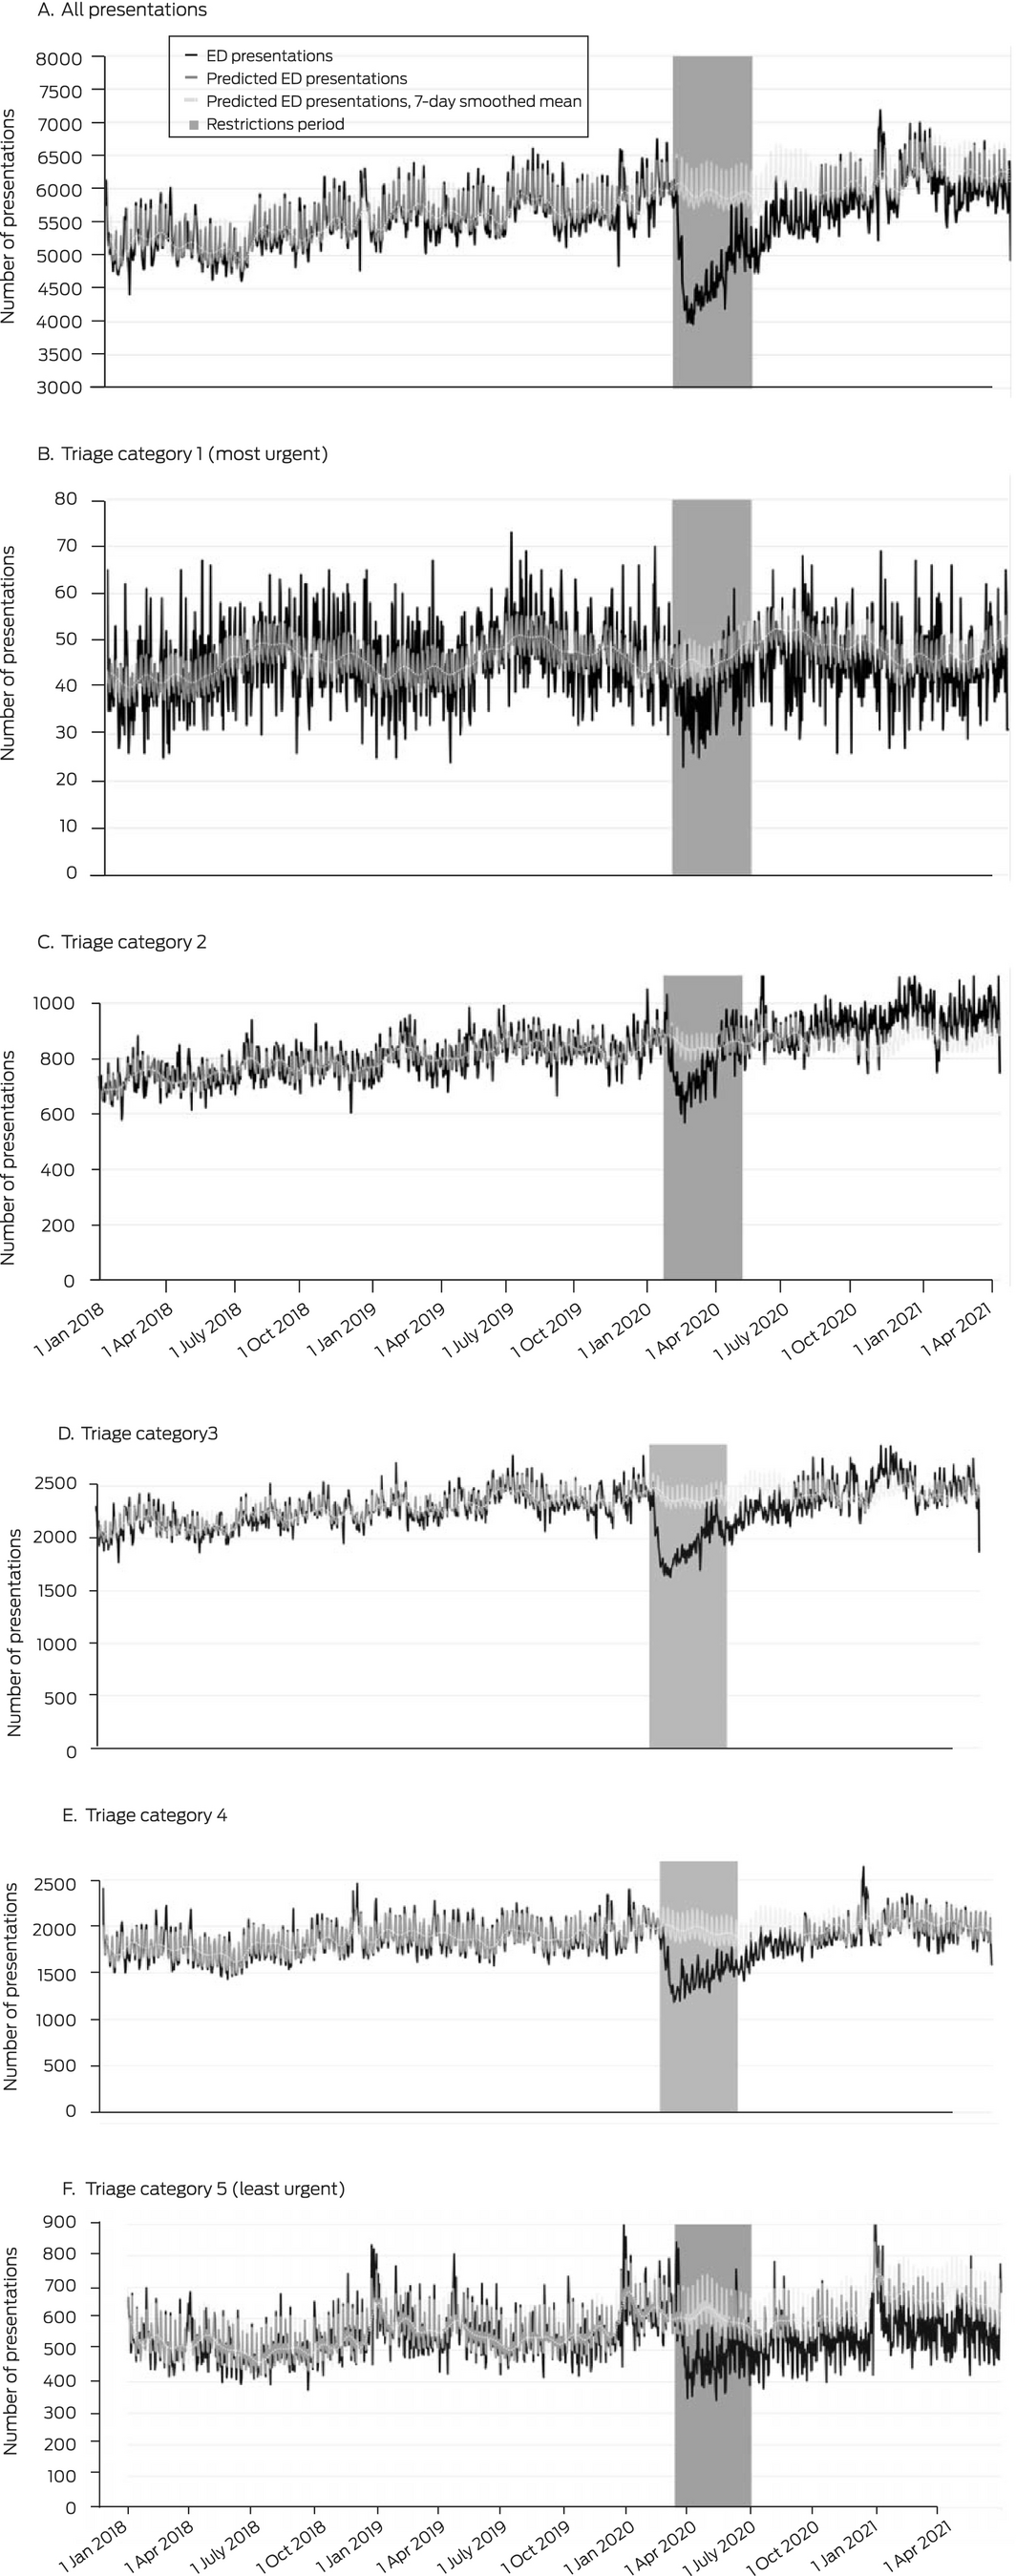
During the lockdown period, presentation numbers were lower than predicted in all triage categories; mean declines ranged from 7.8% (95% CI, –9.7% to –6.0%) for ATS 2 to 23.4% (95% CI, –24.9% to –21.9%) for ATS 4 presentations. The decline in ATS 2 presentations was brief; the number normalised during the restrictions period, and exceeded the predicted number during 2021. The numbers of ATS 1, 3, and 4 presentations gradually returned to predicted levels over two (ATS 1) to six months (ATS 4). The number of ATS 5 presentations remained lower than predicted until the end of the study period, twelve months beyond the lockdown period (Box 2, Box 3).
Presentations by diagnosis category
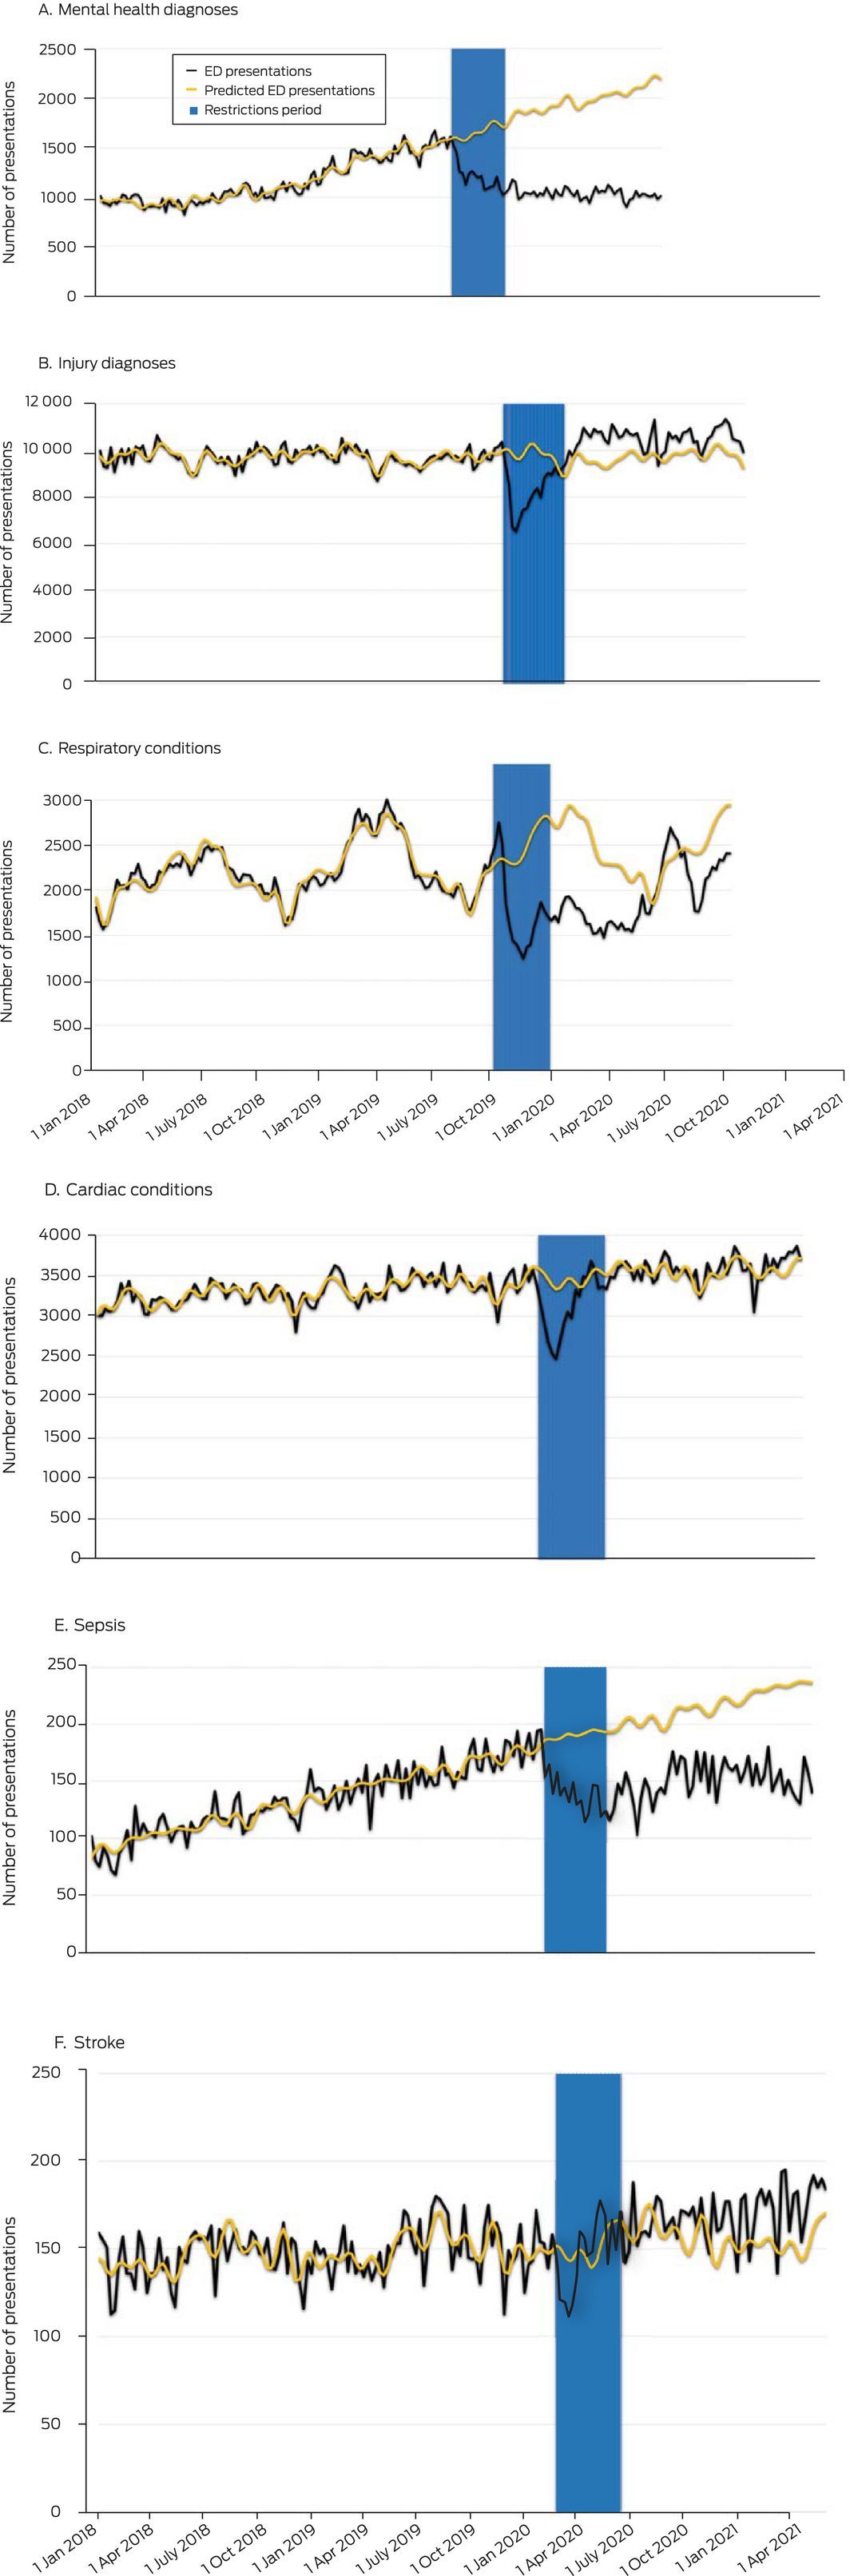
During the lockdown period, the numbers of presentations with respiratory conditions (mean change, –29.5%; 95% CI, –39.5% to –19.5%), sepsis (–28%; 95% CI, –33% to –24%), mental health problems (–27.3%; 95% CI, –32.2% to –22.4%), injury‐related conditions (–15.9%; 95% CI, –21.2% to –10.6%), and cardiac conditions (–10.1%; 95% CI, –14.9% to –5.2%) were each lower than predicted, but not the number of presentations with stroke (–2.9%; 95% CI, –9.3% to +3.5%). The declines in cardiac and injury‐related presentations were brief, and normalised during the lockdown period; the number of injury‐related presentations exceeded the predicted number during the twelve months after the lockdown. The numbers of presentations with sepsis or mental health problems continued to be lower than predicted during the twelve months after the lockdown period (Box 3, Box 4).
Discussion
During the four months of stringent public health measures in Queensland from 11 March to 30 June 2020, the daily number of ED presentations was almost 20% lower than predicted by pre‐pandemic data. The decline was greatest 25 days after declaration of the pandemic, and numbers returned to expected levels over the course of two to six months. The pattern of changes varied by triage category and diagnostic group. Changes in presentation numbers were least marked for ATS 1 and 2 presentations, and for those with cardiac conditions or stroke as the diagnostic category. On the other hand, the declines in numbers of presentations with respiratory conditions, sepsis, or mental health conditions were the most marked, and persisted for nine months (respiratory) or at least twelve months (sepsis, mental health) after restrictions eased. Declines in the number of ATS 5 presentations also persisted for at least twelve months. Interestingly, the numbers of ATS 2 and injury‐related presentations exceeded the predicted level during the period of easing restrictions.
The overall decline of 19.4% in ED presentations was smaller than reported by population‐based studies in Hong Kong (27%),20 the United States (42%),3 Canada (50%),21 and Italy (66%),7 but similar reductions have been reported in other Australian states (14–25%).10,11 The findings of smaller multisite studies, which also reported lower presentation numbers, are summarised in the Supporting Information, table 3. Overseas reports of dates for the nadir in ED presentations with respect to the start of the pandemic were similar to ours, although it was about one week earlier in Germany21 and a week later in the United States3 and Canada.22
Our study examined a period of relatively low local COVID‐19 prevalence. The similarities between our findings regarding ED presentation number decline and time from pandemic onset to ED presentation nadir and those of studies in areas with higher community infection and COVID‐19‐related hospital admission rates suggest that factors other than pandemic‐related infections and illness may influence ED presentation numbers. These may include fear of exposure to COVID‐19 in the ED, postponing presentation for reasons deemed less urgent, the desire to avoid burdening the acute care health system, and reduced numbers of public gatherings, sports events, and motor vehicle journeys.23,24
We found that presentation numbers in the most urgent categories (ATS 1, 2) and with urgent conditions (cardiac disorders, stroke) were least affected by the lockdown and most rapidly returned to normal levels. This suggests that people who required urgent care were less dissuaded by restrictions and messages encouraging people to stay at home than people with less urgent conditions. Nevertheless, reduced numbers of attendances with urgent conditions have been reported elsewhere, prompting advice that people with serious medical conditions should continue to seek care as needed.25
The number of presentations with mental health problems, respiratory conditions, or sepsis, and those categorised as least urgent (ATS 5) remained lower than expected for more than twelve months after the lockdown period. Our findings suggest that social distancing, improved hand hygiene, and public health restrictions reduced the number of infectious disease ED presentations. Pandemic‐related factors and restrictions may have led people with mental health problems, on the other hand, to seek help elsewhere, or to not seek help at all, and this requires further investigation. The persistent drop in ATS 5 presentations may reflect a change in health‐seeking behaviour, including a shift to outpatient care,26 but changes in illness perception and the use of primary care during this period also need to be investigated.
The increase in the number of ATS 2 presentation beyond the expected level after the lockdown period may indicate that people with chronic conditions delayed care during the restrictions, as a result of which they subsequently experienced more severe illness. The increase in injury‐related ED presentations during 2021 might reflect reduced accessibility of general practitioners, but these possibilities require further exploration.
Our findings prompt us to recommend that pandemic‐related restrictions be accompanied by advice about appropriate locations for seeking medical care. People with the most urgent conditions should be encouraged to continue attending EDs, while those with less serious problems require clarity about appropriate care pathways. Second, a decline in ED presentations during a future outbreak or pandemic should be anticipated, and support provided to primary care providers so that they can offer more services for people who do not need hospital‐based care. Finally, our findings could be useful for modelling changes in health‐seeking behaviour in other epidemics, for refining health access modalities (eg, telehealth), and establishing services for providing more tailored care for people with special needs (eg, mental health problems) and non‐urgent medical needs.27,28,29
Limitations
First, generalising our findings, which refer to public hospital EDs in Queensland, to private facilities or other states should be undertaken with caution. Second, our findings are based on data from the first COVID‐19 wave, when the predominant viral strains were the original circulating severe acute respiratory syndrome coronavirus 2 and its Alpha and Delta variants, and prior to the widespread availability of vaccination. The impacts of subsequent strains, epidemic waves, and vaccination on ED presentations warrant further research. Third, some aspects of our modelling methods could not be adjusted; for example, we could not introduce a trend coefficient to compare with the trend coefficient of the observed counts, which could have simplified determining the onset of normalisation. Finally, we could not account in our retrospective analysis for confounding factors (eg, triage practices, broader hospital measures) that may have changed as an indirect effect of the lower presentation volumes and patient behaviour. Future studies could apply more sophisticated statistical modelling to data collected from regions that share key features with Queensland.
Conclusions
We found that the reduction in ED presentation numbers during the 4‐month 2020 COVID‐19 lockdown period in Queensland varied by urgency and diagnostic category of presentations. This variation suggests that several factors were involved, including reduced incidence of infectious disease (fewer presentations with respiratory conditions or sepsis) and changes in health‐seeking behaviour (fewer mental health‐related and ATS 5 presentations). The number of stroke presentations was consistent before, during, and after the lockdown, but ATS 2 presentations increased beyond pre‐pandemic levels after restrictions were lifted. Pandemic planning should ensure early advice to continue seeking care for health emergencies while increasing support and information about alternative sources of care for less serious conditions.
Box 1 – Actual and predicted numbers of emergency department presentations, numbers of newly reported COVID‐19 cases, and restrictions imposed to limit the spread of COVID‐19, Queensland, 2020
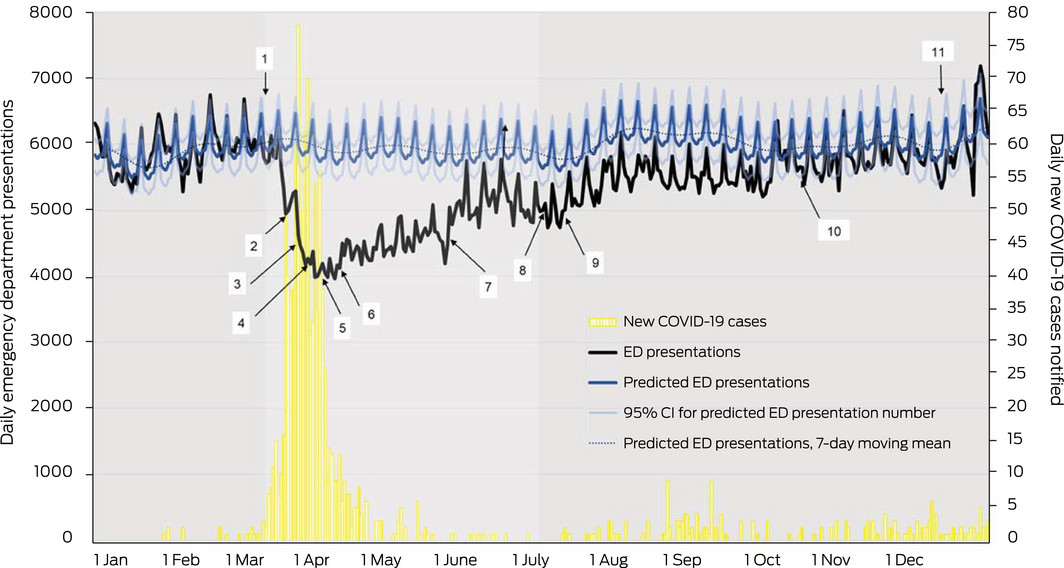
CI = confidence interval; COVID‐19 = coronavirus disease 2019.
The chronology of public health interventions is summarised by 7‐day period in the Supporting Information, table 2 and figure 1. The events indicated on this diagram are: 1 (11 March): World Health Organization declares pandemic; 2 (20 March): Australian borders close; 3 (26 March): Queensland state borders close; 4 (30 March): schools start online learning; 5 (2 April): movements restricted to essential reasons; 6 (9 April): non‐essential businesses must close; 7 (25 May): return to school for all ages; 8 (3 July): gatherings of up to one hundred people allowed; 9 (10 July): Queensland borders open to most jurisdictions; 10 (16 October): further easing for gatherings and weddings, dancing allowed; 11 (14 December): full capacity crowds allowed at stadiums and indoor venues.
Box 2 – Daily number of emergency department presentations, Queensland, 1 January 2018 – 30 June 2021: overall and by Australasian Triage Scale category
Box 3 – Changes in emergency department presentations in Queensland with respect to numbers predicted by pre‐pandemic data during the Queensland COVID‐19 lockdown (11 March – 30 June 2020): all ED presentations (daily) and by diagnostic category/condition (weekly) and triage category (daily)
|
Presentation type |
Pre‐pandemic mean number (SD) |
Maximum decline (proportion of predicted number) |
Mean change (95% CI)* |
Sustained reduction start date (consecutive days)† |
Normalisation date‡ |
||||||||||
|
|
|||||||||||||||
|
All presentations (daily) |
5502 (390) |
2019 (33.6%) (5 Apr) |
–19.4% –20.9% to –17.9%) |
17 Mar (135 days) |
14 Sept 2020 |
||||||||||
|
Diagnostic categories/conditions (weekly) |
|
|
|
|
|
||||||||||
|
Cardiac conditions |
3312 (163) |
861 (25.8%) (6–12 Apr) |
–10.1% (–14.9% to –5.2%) |
9 Mar (8 weeks) |
11–17 May 2020§ |
||||||||||
|
Respiratory conditions |
2202 (308) |
1142 (47.9%) (4–10 May) |
–29.5% (–39.5% to –19.5%) |
30 Mar (38 weeks) |
15–21 Mar 2021 |
||||||||||
|
Mental health problems |
1165 (230) |
1245 (56.0%) (14–20 June) |
–27.3% (–32.2% to –22.4%) |
16 Mar (66 weeks)¶ |
None** |
||||||||||
|
Injury‐related conditions |
9738 (379) |
3131 (32.4%) (30 Mar – 5 Apr) |
–15.9% (–21.2% to –10.6%) |
16 Mar (12 weeks) |
1–6 June 2020 |
||||||||||
|
Sepsis |
135 (29) |
96 (48%) (17–23 Aug) |
–28% (–33% to –24%) |
6 Apr (26 weeks) |
None** |
||||||||||
|
Stroke |
148 (14) |
32 (22%) (30 Mar – 5 Apr) |
–2.9% (–9.3% to +3.5%) |
None |
Not applicable |
||||||||||
|
Australasian Triage Scale (ATS) category (daily) |
|
|
|
|
|
||||||||||
|
ATS 1 |
46 (8) |
26 (50%) (27 Mar) |
–13% (–16% to –10%) |
29 Mar (4 days) |
5 July 2020 |
||||||||||
|
ATS 2 |
792 (69) |
258 (31.3%) (10 Apr) |
–7.8% (–9.7% to –6.0%) |
24 Mar (42 days) |
11 May 2020§ |
||||||||||
|
ATS 3 |
2268 (156) |
878 (30.8%) (10 Apr) |
–17.7% (–19.1% to –16.2%) |
17 Mar (90 days, 81 days) |
11 Aug 2020 |
||||||||||
|
ATS 4 |
1851 (179) |
834 (39.5%) (31 Mar) |
–23.4% (–24.9% to –21.9%) |
15 Mar (150 days) |
15 Sept 2020 |
||||||||||
|
ATS 5 |
546 (79) |
321 (43.2%) (10 May) |
–17.8% (–20.4% to –15.2%) |
24 Mar (64 days) |
None |
||||||||||
|
|
|||||||||||||||
|
CI = confidence interval; COVID‐19 = coronavirus disease 2019; SD = standard deviation. * For 11 March – June 30 2020 (during the restrictions period). † Number of presentations below 95% confidence interval for predicted number. ‡ First day after sustained decrease followed by ten consecutive days or three consecutive weeks in which the number of presentations was within 10% of predicted number. § That is, during the restrictions period. ¶ Truncated at 30 June 2021. ** That is, normalisation did not occur by 30 June 2021. |
|||||||||||||||
Received 20 June 2022, accepted 13 October 2022
- Amy L Sweeny1,2
- Gerben Keijzers2,3
- Andrea Marshall2,4
- Emma J Hall2
- Jamie Ranse2,4
- Ping Zhang4
- Gary Grant4
- Ya‐Ling Huang2,5
- Dinesh Palipana1,2
- Yang D Teng6
- Benjamin Gerhardy7
- Jaimi H Greenslade8,9
- Philip Jones2
- Julia L Crilly2,4
- 1 Griffith University, Gold Coast, QLD
- 2 Gold Coast Hospital and Health Service, Gold Coast, QLD
- 3 Bond University, Gold Coast, QLD
- 4 Menzies Health Institute Queensland, Griffith University, Gold Coast, QLD
- 5 Southern Cross University Faculty of Health, Gold Coast, QLD
- 6 Harvard Medical School, Boston, MA, United States of America
- 7 Nepean Hospital, Penrith, NSW
- 8 Royal Brisbane and Women's Hospital, Brisbane, QLD
- 9 Australian Centre for Health Services Innovation, Centre for Healthcare Transformation, Queensland University of Technology, Brisbane, QLD
Open access
Open access publishing facilitated by Griffith University, as part of the Wiley – Griffith University agreement via the Council of Australian University Librarians.
The Emergency Medicine Foundation supported this study by providing funding to employ staff from Queensland Health and Griffith University who undertook the study. We acknowledge Ben Walters (Ramsay Healthcare) for being a study team member on this project.
No relevant disclosures.
- 1. World Health Organization. Weekly epidemiological update on COVID‐19: 23 November 2022. Edition 119. who.int/publications/m/item/weekly‐epidemiological‐update‐on‐covid‐19‐‐‐23‐november‐2022 (viewed Nov 2022).
- 2. World Health Organization. Coronavirus disease (COVID‐19): situation report 163. 1 July 2020. https://www.who.int/docs/default‐source/coronaviruse/situation‐reports/20200701‐covid‐19‐sitrep‐163.pdf?sfvrsn=c202f05b_2 (viewed Nov 2022).
- 3. Hartnett KP, Kite‐Powell A, DeVies J, et al; National Syndromic Surveillance Program Community of Practice. Impact of the COVID‐19 pandemic on emergency department visits: United States, January 1, 2019 – May 30, 2020. MMWR Morb Mortal Wkly Rep 2020; 69: 699‐704.
- 4. Baugh JJ, White BA, McEvoy D, et al. The cases not seen: patterns of emergency department visits and procedures in the era of COVID‐19. Am J Emerg Med 2021; 46: 476‐481.
- 5. Jeffery MM, D'Onofrio G, Paek H, et al. Trends in emergency department visits and hospital admissions in health care systems in 5 states in the first months of the COVID‐19 pandemic in the US. JAMA Int Med 2020; 180: 1328‐1333.
- 6. Kuitunen I, Ponkilainen VT, Launonen AP, et al. The effect of national lockdown due to COVID‐19 on emergency department visits. Scand J Trauma Resusc Emerg Med 2020; 28: 114.
- 7. Santi L, Golinelli D, Tampieri A, et al. Non‐COVID‐19 patients in times of pandemic: emergency department visits, hospitalizations and cause‐specific mortality in northern Italy. PLoS One 2021; 16: e0248995.
- 8. Hughes HE, Hughes TC, Morbey R, et al. Emergency department use during COVID‐19 as described by syndromic surveillance. Emerg Med J 2020; 37: 600‐604.
- 9. Lange SJ, Ritchey MD, Goodman AB, et al. Potential indirect effects of the COVID‐19 pandemic on use of emergency departments for acute life‐threatening conditions: United States, January–May 2020. Am J Transplant 2020; 20: 2612‐2617.
- 10. Kam AW, Chaudhry SG, Gunasekaran N, et al. Fewer presentations to metropolitan emergency departments during the COVID‐19 pandemic. Med J Aust 2020; 213: 370‐371. https://www.mja.com.au/journal/2020/213/8/fewer‐presentations‐metropolitan‐emergency‐departments‐during‐covid‐19‐pandemic
- 11. Sutherland K, Chessman J, Zhao J, et al. Impact of COVID‐19 on healthcare activity in NSW, Australia. Public Health Res Pract 2020; 30: 3042030.
- 12. Collyer TA, Athanasopoulos G, Srikanth V, et al. Impact of COVID‐19 lockdowns on hospital presentations and admissions in the context of low community transmission: evidence from time series analysis in Melbourne, Australia. J Epidemol Community Health 2022; 76: 341‐349.
- 13. Queensland Government. Emergency Data Collection (EDC). In: Queensland Health Information Knowledgebase (QHIK). Updated 21 Sept 2021. https://qhdd.health.qld.gov.au/apex/f?p=103:MS_DETAIL::KW:::P4_MD_ID,P4_SEQ_ID:2,26040&cs=102FA19CEDE790750706FC33BB51B42F2 (viewed Nov 2022).
- 14. Independent Health and Aged Care Pricing Authority. AR‐DRG version 9.0: Appendix A. Diagnosis code/MDC/ADRG index. 1 July 2017. ihacpa.gov.au/resources/ar‐drg‐version‐90 (viewed Nov 2022).
- 15. Australasian College for Emergency Medicine. Triage. 21 Nov 2017. https://acem.org.au/Content‐Sources/Advancing‐Emergency‐Medicine/Better‐Outcomes‐for‐Patients/Triage (viewed Mar 2022).
- 16. COVID‐19: a chronology of state and territory government announcements (up until 30 June 2020). Australian Department of Parliamentary Services, 22 Oct 2020. https://parlinfo.aph.gov.au/parlInfo/download/library/prspub/7614514/upload_binary/7614514.pdf (viewed Nov 2022).
- 17. Taylor S, Letham B. prophet: Automatic forecasting procedure. 30 Mar 2021. https://cran.r‐project.org/web/packages/prophet/index.html (viewed Mar 2022).
- 18. Taylor SJ, Letham B. Forecasting at scale. American Statistician 2018; 72: 37‐45.
- 19. Xie C, Wen H, Yang W, et al. Trend analysis and forecast of daily reported incidence of hand, foot and mouth disease in Hubei, China by Prophet model. Sci Rep 2021; 11: 1445.
- 20. Wai AKC, Wong CKH, Wong JYH, et al. Changes in emergency department visits, diagnostic groups, and 28‐day mortality associated with the COVID‐19 pandemic: a territory‐wide, retrospective, cohort study. Ann Emerg Med 2021; 79: 148‐157.
- 21. Bergrath S, Strapatsas T, Tuemen M, et al. Impact of the COVID‐19 pandemic on emergency medical resources. Anaesthesist 2021; https://doi.org/10.1007/s00101‐021‐01005‐7 [online ahead of print].
- 22. Dudevich A, Frood J. Impact of the COVID‐19 pandemic on health system use in Canada. Healthc Q 2021; 24: 12‐14.
- 23. Douillet D, Dupont C, Leloup N, et al. Prevalence and characterization of forgoing care: comparison of two prospective multicentre cohorts between pre‐COVID‐19 era and a lockdown period. Arch Public Health 2022; 80: 32.
- 24. Wartelle A, Mourad‐Chehade F, Yalaoui F, et al. Effect of the COVID‐19 pandemic lockdown on non‐COVID‐19 emergency department visits in eastern France: reduced risk or avoidance behavior? Public Health Pract (Oxf) 2021; 2: 100109.
- 25. ABC News. Cancer screening, heart attack and stroke presentations down in Victoria during coronavirus pandemic. ABC News (Australia), 11 Sept 2020. https://www.abc.net.au/news/2020‐09‐11/victoria‐coronavirus‐drop‐in‐stroke‐heart‐attack‐cancer‐screens/12654588 (viewed Sept 2022).
- 26. Quinn‐Scoggins HD, Cannings‐John R, Moriarty Y, et al. Cancer symptom experience and help‐seeking behaviour during the COVID‐19 pandemic in the UK: a cross‐sectional population survey. BMJ Open 2021; 11: e053095.
- 27. Upton E, Clare PJ, Aiken A, et al. Changes in mental health and help‐seeking among young Australian adults during the COVID‐19 pandemic: a prospective cohort study. Psychol Med 2021; https://doi.org/10.1017/S0033291721001963 [online ahead of print].
- 28. Morello F, Bima P, Ferreri E, et al. After the first wave and beyond lockdown: long‐lasting changes in emergency department visit number, characteristics, diagnoses, and hospital admissions. Int Emerg Med 2021; 16: 1683‐1690.
- 29. Wong MYZ, Gunasekeran DV, Nusinovici S, et al. Telehealth demand trends during the COVID‐19 pandemic in the top 50 most affected countries: infodemiological evaluation. JMIR Public Health Surveill 2021; 7: e24445.
Abstract
Objectives: To assess emergency department (ED) presentation numbers in Queensland during the coronavirus disease 2019 (COVID‐19) pandemic to mid‐2021, a period of relatively low COVID‐19 case numbers.
Design: Interrupted time series analysis.
Setting: All 105 Queensland public hospital EDs.
Main outcome measures: Numbers of ED presentations during the COVID‐19 lockdown period (11 March 2020 – 30 June 2020) and the period of easing restrictions (1 July 2020 – 30 June 2021), compared with pre‐pandemic period (1 January 2018 – 10 March 2020), overall (daily numbers) and by Australasian Triage Scale (ATS; daily numbers) and selected diagnostic categories (cardiac, respiratory, mental health, injury‐related conditions) and conditions (stroke, sepsis) (weekly numbers).
Results: During the lockdown period, the mean number of ED presentations was 19.4% lower (95% confidence interval, –20.9% to –17.9%) than during the pre‐pandemic period (predicted mean number: 5935; actual number: 4786 presentations). The magnitudes of the decline and the time to return to predicted levels varied by ATS category and diagnostic group; changes in presentation numbers were least marked for ATS 1 and 2 (most urgent) presentations, and for presentations with cardiac conditions or stroke. Numbers remained below predicted levels during the 12‐month post‐lockdown period for ATS 5 (least urgent) presentations and presentations with mental health problems, respiratory conditions, or sepsis.
Conclusions: The COVID‐19 pandemic and related public restrictions were associated with profound changes in health care use. Pandemic plans should include advice about continuing to seek care for serious health conditions and health emergencies, and support alternative sources of care for less urgent health care needs.