


The coronavirus disease 2019 (COVID‑19) pandemic has forced many countries to take extraordinary measures to prevent spread of disease. In New South Wales, public health orders introduced during 18–26 March 2020 required the closure of major industries and prohibited non‐essential gatherings of more than 100 people or allowing less than 4 m2 space per person. On 29 March, further public health orders prohibited people leaving home other than for work, study, shopping, medical care, or exercise.1,2
Changes in patterns of presentations to emergency departments (EDs) have been reported during COVID‐19 lockdowns overseas, including reduced numbers of patients with certain high acuity conditions, such as acute coronary syndrome (ACS) and stroke.3,4,5 Understanding the situation in Australia is important for public health policy during this and future pandemics.
The Western Sydney Local Health District is a metropolitan health network in NSW of four hospitals (each with EDs) with a total capacity of 1925 beds, serving a catchment of 950 000 people. We analysed triage, International Classification of Diseases, tenth revision, Australian modification (ICD‐10‐AM) coding, and separations data for ED presentations during 29 March – 31 May in each of 2019 and 2020. Differences in mean daily presentation numbers for each triage category and selected presentation types were assessed in non‐paired Student t test with Bonferroni correction. All data analysis was performed in Excel (Microsoft). As a quality assurance project, the study was exempted from formal ethics approval.
The number of ED presentations during 29 March – 31 May was almost 25% lower in 2020 than in 2019 (26 617 v 35 268). Presentation numbers in all triage categories were lower in 2020 (P < 0.001), except for category 1 (resuscitation) (506 v 445, 14% increase; P = 0.40). The proportion of patients discharged from the ED was greater in 2020 (60% v 53%) and that of patients who did not wait for treatment smaller (1% v 5%). The number of patients admitted to hospital was lower in 2020 than 2019 (8047 v 11 838), as were the proportions admitted to hospital (30% v 34%) (Box 1).
ED presentations with fourteen selected diagnoses were further examined: common infectious diseases (infectious enteric disease, pneumonia), conditions frequently seen in EDs (wrist or hand fractures, femur fractures, appendicitis, renal calculi), conditions for which fewer ED presentations have been reported during COVID‐19 restrictions overseas (stroke or cerebral haemorrhage, ACS, chest pain, transient ischaemic attacks), and conditions that may be exacerbated or for which follow‐up in routine medical services may be reduced by COVID‐19 and its associated restrictions (mental health problems, substance misuse, malignancy). The numbers of presentations with infectious enteric disease, pneumonia, wrist or hand fractures, stroke or intracerebral haemorrhage, and chest pain not resulting in another diagnosis were lower in 2020 than in 2019. The numbers of presentations with ACS were similar. The number of presentations with mental health problems was higher in 2020 (daily mean, 8.4; standard deviation [SD], 3.1) than in 2019 (daily mean, 6.9; SD, 2.6; difference, +1.5 presentations per day; 95% confidence interval, +0.1–2.9) (Box 2; online Supporting Information).
Social distancing may have reduced the spread of infectious enteric diseases and community‐acquired pneumonia, and home isolation may have led to fewer fractures. However, lower numbers of presentations with chest pain or stroke (also reported overseas4) may reflect factors other than lower incidence, such as suspension of outpatient clinics and elective procedures, social distancing measures, and public anxiety.
COVID‐19 has profoundly affected health care delivery. We found concerning reductions in ED presentation numbers that may indicate delayed seeking of appropriate medical attention. Public health messages should encourage timely presentation of people with time‐sensitive, potentially life‐threatening conditions, even during pandemics. Equally concerning is the higher number mental health‐related presentations, which may reflect anxiety about COVID‐19, loss of job security, or prolonged isolation. Studies of patients presenting to health care services as they re‐open are required to fully appreciate the health implications of the COVID‐19 epidemic.
Box 1 – Emergency department presentations to Western Sydney Local Health District hospitals during corresponding two‐month periods in 2019 and 2020
|
|
Triage category |
||||||||||||||
|
Resuscitation |
Emergency |
Urgent |
Semi‐urgent |
Non‐urgent |
Total |
||||||||||
|
|
|||||||||||||||
|
29 March – 31 May 2019 |
|
|
|
|
|
|
|||||||||
|
Total number of presentations |
445 |
8910 |
12 464 |
10 726 |
2723 |
35 268 |
|||||||||
|
Daily presentations, mean (standard deviation) |
7.0 (3.2) |
139 (15.9) |
195 (19.3) |
168 (22.3) |
42.5 (10.7) |
551 (41.8) |
|||||||||
|
Admitted to hospital |
350 (79%) |
4550 (51%) |
4524 (36%) |
2156 (20%) |
258 (9%) |
11 838 (34%) |
|||||||||
|
Discharged: treatment complete |
38 (9%) |
3350 (38%) |
6155 (49%) |
7093 (66%) |
2039 (75%) |
18 675 (53%) |
|||||||||
|
Transferred to another hospital or service |
26 (6%) |
521 (6%) |
577 (5%) |
299 (3%) |
68 (2%) |
1491 (4%) |
|||||||||
|
Did not wait |
0 |
65 (1%) |
560 (4%) |
735 (7%) |
239 (9%) |
1599 (5%) |
|||||||||
|
Discharged against medical advice |
7 (2%) |
413 (5%) |
646 (5%) |
442 (4%) |
81 (3%) |
1589 (5%) |
|||||||||
|
Died in emergency department/dead on arrival |
24 (5%) |
11 (< 1%) |
2 (< 1%) |
1 (< 1%) |
38 (1%) |
76 (< 1%) |
|||||||||
|
29 March – 31 May 2020 |
|
|
|
|
|
|
|||||||||
|
Total number of presentations |
506 |
7609 |
9095 |
7346 |
2061 |
26 617 |
|||||||||
|
Daily presentations, mean (standard deviation) |
7.9 (2.6) |
119 (18.4) |
142 (17.5) |
115 (17.9) |
32.2 (8.4) |
416 (40.6) |
|||||||||
|
Admitted to hospital |
370 (73%) |
3112 (41%) |
3072 (34%) |
1279 (17%) |
214 (10%) |
8047 (30%) |
|||||||||
|
Discharged: treatment complete |
62 (12%) |
3836 (50%) |
5146 (57%) |
5324 (72%) |
1525 (74%) |
15 893 (60%) |
|||||||||
|
Transferred to another hospital or service |
26 (5%) |
424 (6%) |
461 (5%) |
304 (4%) |
136 (7%) |
1351 (5%) |
|||||||||
|
Did not wait |
0 |
22 (< 1%) |
84 (1%) |
170 (2%) |
107 (5%) |
383 (1%) |
|||||||||
|
Discharged against medical advice |
9 (2%) |
210 (3%) |
328 (4%) |
267 (4%) |
64 (3%) |
878 (3%) |
|||||||||
|
Died in emergency department/dead on arrival |
39 (8%) |
5 (< 1%) |
3 (< 1%) |
0 |
15 (1%) |
62 (< 1%) |
|||||||||
|
Change in presentation numbers, 2020 v 2019 |
+14% |
–15% |
–17% |
–32% |
–25% |
–25% |
|||||||||
|
|
|||||||||||||||
|
|
|||||||||||||||
Box 2 – Mean changes (with 95% confidence intervals) for numbers of emergency department presentations with selected diagnoses (ICD‐10‐AM codes), 29 March – 31 May 2020 v 29 March – 31 May 2019
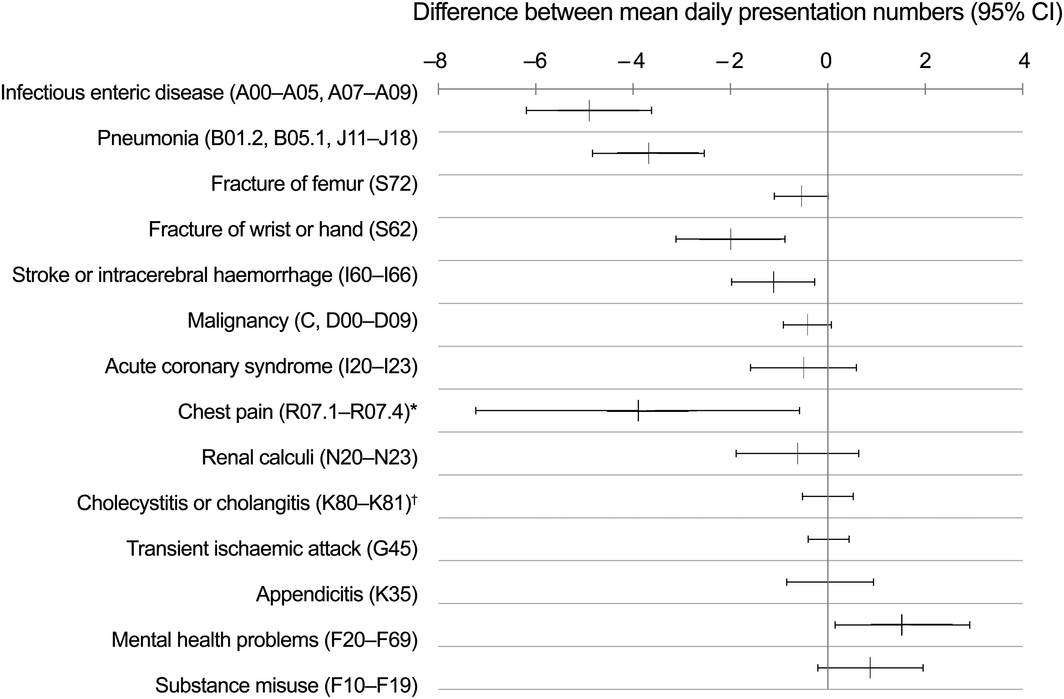
ICD-10-AM = International Classification of Diseases, tenth revision, Australian modification. * Not resulting in another diagnosis. † Excluding cases without mention of obstruction.
Received 27 June 2020, accepted 24 July 2020
- 1. Wahlquist C. Australia’s coronavirus lockdown: the first 50 days. The Guardian [Australia edition], updated 2 May 2020. https://www.theguardian.com/world/2020/may/02/australias-coronavirus-lockdown-the-first-50-days (viewed Aug 2020).
- 2. McAnulty JM, Ward K. Suppressing the epidemic in New South Wales. N Engl J Med 2020; 382: e74.
- 3. De Filippo O, D’Ascenzo F, Angelini F, et al. Reduced rate of hospital admissions for ACS during Covid‐19 outbreak in Northern Italy. N Engl J Med 2020; 383: 88–89.
- 4. Morelli N, Rota E, Terracciano C, et al. The baffling case of ischemic stroke disappearance from the casualty department in the COVID‐19 era. Eur Neurol 2020; 83: 213–215.
- 5. Rosenbaum L. The untold toll: the pandemic’s effects on patients without Covid‐19. N Engl J Med 2020; 382: 2368–2371.
No relevant disclosures.