


The known: In 2015, e‐cigarette use in NSW was relatively low among smokers and recent quitters. However, devices have since rapidly evolved, including the introduction of pod‐style products containing high concentrations of nicotine salts.
The new: Despite measures for limiting e‐cigarette use in NSW, our survey found that the proportions of smokers and recent quitters using e‐cigarettes increased markedly between 2016 and 2020, particularly among 18–24‐year‐old respondents, for whom the proportion rose from 8% to 27%.
The implications: The increase in e‐cigarette use by younger people who smoke or have recently quit reflects the presentation and marketing of these products. E‐cigarette marketing, particularly in social media, should be more effectively regulated.
Australia is a global leader in tobacco control, having reduced the adult smoking rate from 26.7% in 1998 to 12.9% in 2019.1 In 2017, 3% of 12–15‐year‐old and 9% of 16–17‐year‐old young people reported smoking during the past week, the lowest rates since the first national survey in 1984.2 These encouraging figures indicate that effective policy (particularly with regard to tobacco pricing), evidence‐based media campaigns, and smoke‐free indoor environments can significantly reduce smoking among both teenagers and adults.3,4 Further reductions will require policy measures and funding for interventions that reach the entire population but also target specific communities.
Electronic cigarettes (e‐cigarettes, vapes) may be a threat to public health and an impediment to further reducing smoking rates. A 2021 global umbrella review of systematic reviews found that non‐smokers who used e‐cigarettes were three times as likely to start smoking as people who did not, and the relapse rate among former smokers using them was twice that for those who did not use e‐cigarettes.5 A 2021 systematic review (including only a small number of randomised controlled trials) found moderate certainty evidence that e‐cigarettes providing nicotine were associated with higher quit rates than nicotine replacement therapy; evidence that their benefit was greater than usual or no care was less certain.6 Nevertheless, e‐cigarettes are often promoted as effective smoking cessation aids,7 targeted only at adult smokers who have tried and failed to quit smoking by other means. However, the marketing tactics, ease of access, colourful product design, and a wide array of flavours make e‐cigarettes attractive to both young non‐smokers and smokers who use both e‐cigarettes and tobacco.8
In addition to public health concerns that e‐cigarettes might lead to increased smoking, e‐cigarette liquids contain cancer‐causing chemicals and toxic substances, including flavours,9 and are often labelled “nicotine‐free” even when they contain nicotine.10 While the long term health effects of e‐cigarette use are not yet clear, it may be associated with heart and respiratory disease.11 Acute health effects include accidental and intentional poisoning by nicotine‐containing liquids and burns from overheating and exploding devices.9
E‐cigarette devices have rapidly evolved since 2016, including the introduction of pod‐style vaping products containing high concentrations of nicotine salts, and they are marketed to young people in social media.12 On the other hand, e‐cigarette use in smoke‐free public spaces and sales to minors are now prohibited in New South Wales, and e‐cigarette advertising and promotion regulated, including bans on displays at retail points of sale.
We examined changes over time in e‐cigarette use by NSW adults who smoke or have recently quit smoking, assessed demographic characteristics associated with e‐cigarette use, and investigated reasons for using e‐cigarettes, building on and updating our 2016 report.13
Methods
The Cancer Institute NSW Tobacco Tracking Survey (CITTS) is an ongoing, serial, cross‐sectional telephone survey study; 40 interviews are conducted in NSW each week.13 This report is based on interviews during 4 January 2016 – 31 December 2020. The CITTS monitors smoking‐related perceptions and behaviours among adults (18 years or older) who are current tobacco smokers or have recently quit smoking. Computer‐assisted telephone interviews were conducted using a dual‐frame survey design: from January 2016 to September 2020 using random digit dialling to landline and mobile phone numbers (50%/50%), from October 2020 to December 2020 using random digit dialling to listed and unlisted mobile phone numbers (50%/50%). When calling a landline, participants were randomly selected from within households (selecting the nth oldest eligible adult); when calling a mobile phone, the person answering the call was screened for eligibility. Screening includes questions about current and past smoking behaviour. Current smokers are defined as people who currently smoke cigarettes, pipes, or other tobacco products daily, weekly, or less often than weekly, recent quitters as people who had smoked tobacco products in the past twelve months but who no longer smoked.
E‐cigarette use
Eligible participants were asked “How often, if at all, do you currently use e‐cigarettes?” Responses (options: daily, weekly, monthly, less than monthly, not at all) were analysed by use (never use v use e‐cigarettes) and frequency (for users: infrequent use [monthly, less than monthly] v frequent use [weekly, daily]).
From 4 January 2016, e‐cigarette users were asked the free‐response question, “What are the main reasons you currently use e‐cigarettes?” The interviewer classified responses under one or more categories: so I don't have to quit smoking; to cut down on the number of cigarettes I smoke; to help me quit cigarettes; they're not as bad for your health as cigarettes; cheaper than cigarettes; taste better than cigarettes; I use them exclusively instead of smoking cigarettes; so I can smoke in places where smoking cigarettes is not allowed; I just tried them because I was curious; no reason; habit; for social reasons; for enjoyment; other. If the response did not map to any category, the interviewer recorded the response verbatim under “other”; for the analysis, “other” responses were subsequently allocated to a specific category or tallied as a separate category.
Covariates
The covariates we examined were sex, age group (18–24 years, 25–39 years, 40–44 years, 45–54 years, 55–64 years, 65 or more years), education (low: did not complete high school; moderate: completed high school or vocational college; high: tertiary education), location type (metropolitan [Sydney postcodes], non‐metropolitan [other NSW or Australian Capital Territory postcodes]), and socio‐economic status by residential postcode according to the Socio‐Economic Indices for Areas (SEIFA) Index of Relative Socio‐economic Disadvantage14 (low: quintiles 4–5; moderate to high: quintiles 1–3). The tobacco use of current smokers was categorised with the Heaviness of Smoking Index (based on time to first cigarette of the day and number of cigarettes smoked each day)15 as low (0–1), medium (2–4), or high (5–6).
Data analysis
We summarise demographic characteristics data as counts and prevalence (weighted proportions) using Cancer Institute NSW weights to ensure that the sample was representative of the NSW smoker population by age, sex, and region.16 We estimated the prevalence of e‐cigarette use by year and age category. We assessed differences in e‐cigarette use (use e‐cigarettes; frequent use of e‐cigarettes) by demographic characteristic and survey year in weighted multiple binary logistic regression models, and report adjusted odds ratios (aORs) with bootstrapped (1000 iterations) 95% confidence intervals (CIs). In model 1, the entire survey sample was included, and the covariates were year, demographic characteristics, and smoking status. In model 2, only current smokers were included, and the covariates were year, demographic characteristics, smoking frequency, and Heaviness of Smoking Index scores. We estimated the prevalence of the most frequent reasons for using e‐cigarettes. All analyses were undertaken in SAS Enterprise Guide 9.4.
Ethics approval
The NSW Population and Health Services Research Ethics Committee approved the CITTS research project (HREC/10/CIPHS/13); the University of Sydney Human Research Ethics Committee approved the secondary data analysis (project number 2017/497).
Results
During 2016–2020, CITTS callers rang 1 494 233 randomly selected numbers. In 203 203 answered calls (13.6%), 11 125 people were eligible for the survey (5.5% of answered calls), of whom 10 012 completed the survey interview (90.0%), 774 terminated it before completion (7.0%), and 339 refused participation (3.0%). As two consenting participants responded “don't know” to the question about e‐cigarette use and six refused a response, 10 004 respondents were included in our analysis (89.9% of eligible phone call respondents) (Box 1).
E‐cigarette use by age group, sex, recent smoking history, and survey year
Overall e‐cigarette use increased from 6.6% of respondents in 2016 to 13.0% in 2020 (aOR, 1.86; 95% CI, 1.47–2.36) (Box 2, Box 3). The proportion of respondents who reported e‐cigarette use declined with age, from 20.8% for respondents aged 18–24 years to 5.2% for people aged 65 years or more (aOR, 0.22; 95% CI, 0.16–0.28). Similar proportions of recent quitters (11.4%) and current smokers (10.9%; aOR, 1.10; 95% CI, 0.91–1.33) and of women (10.0%) and men (11.7%; aOR 1.15; 95% CI, 0.99–1.33) had used e‐cigarettes (Box 3).
The proportion of e‐cigarette users who used them frequently was similar throughout 2016–2020; about half of all users used e‐cigarettes frequently. The proportion of frequent e‐cigarette users was larger for men (7.1%) than for women (4.3%; aOR, 2.49; 95% CI, 1.83–3.39), and smaller among smokers (5.2%) than recent quitters (9.4%; aOR, 0.20; 95% CI, 0.13–0.32) (Box 4).
The proportions of 18–24‐year‐old and 25–39‐year‐old respondents who used e‐cigarettes increased between 2016 and 2020, but not those of respondents aged 40 years or more. The proportion of people aged 18–24 years who reported e‐cigarette use increased from 18.4% (95% CI, 12.9–23.9%) in 2018 to 27.2% (95% CI, 20.5–33.9%) in 2020, a larger proportion than for any other age group (Box 5).
Reasons for using e‐cigarettes
Among the 939 users of e‐cigarettes who provided reasons for using them, the most frequent reason was “to help me quit smoking” (33%; 95% CI, 30–37%); the proportion was slightly higher for recent quitters (41%; 95% CI, 32–49%) than for smokers (31%; 95% CI, 28–35%). The proportion of smokers who reported using e‐cigarettes “to cut down on the number of cigarettes I smoke” (29%; 95% CI, 25–33%) was larger than that for recent quitters (6%; 95% CI, 2–11%) (Box 6).
Discussion
Despite measures for limiting e‐cigarette use in NSW,17 including bans on retail displays of e‐cigarette products in December 2015 and of e‐cigarette use in smoke‐free enclosed public places in July 2018,18 the proportions of surveyed smokers and recent quitters using e‐cigarettes increased from 2016 to 2018, and had not markedly declined by 2020. The increase was most pronounced among younger people; the proportion of 18–24‐year‐old respondents using e‐cigarettes tripled between 2016 and 2020 (to 27.2%) and that of people aged 25–39 years doubled (to 16.1%). Conversely, e‐cigarette use among smokers and recent quitters aged 40 years or more did not substantially change during 2016–2020.
This large increase in e‐cigarette use by young adults who smoke or have recently quit contrasts with tobacco and e‐cigarette company claims that e‐cigarettes are designed for older smokers who have struggled to quit smoking using other methods. The increase in use by younger people reflects the marketing tactics of these companies. E‐cigarette marketing is widespread in social media, including the use of high profile “influencers” to advertise products.19 E‐cigarette companies have also sponsored music festivals,20 featured fashion and style as themes in promotions,21 and enabled the tobacco industry to maintain longstanding relationships with international motor sport, including Formula One.22 Further, the product design appeals to younger people, coming in a large range of flavours and attractive packaging, and the devices are inexpensive.22 E‐cigarette marketing, particularly in social media, should be more effectively regulated.
Only one‐third of respondents who used e‐cigarettes did so to help them quit smoking, and the proportion of recent quitters who offered this reason was not much larger than for smokers. Many reported dual use of tobacco and e‐cigarettes; 25% of users said they used e‐cigarettes to reduce (but not quit) smoking, and 8% that they used e‐cigarettes where smoking was not allowed. Methodological weaknesses in studies of the health impacts of using both e‐cigarettes and smoked tobacco make it difficult to draw conclusions about whether dual use is associated with health benefits or increased harm.23 There is no evidence that dual use to reduce the amount of tobacco smoked is likely to lead to quitting.24
In NSW, vaping is banned in public places where smoking is banned. Vaping may not be as well policed in these spaces, or it may be more acceptable where it is socially unacceptable to smoke, including private homes. We did not examine how informed e‐cigarettes users were about the harms of vaping, but 22% stated they used e‐cigarettes because they were not as bad for their health as smoking. Lower price (19%) and better taste (15%) as motivations reflect the high taxes on tobacco products and the wide array of e‐cigarette flavours available, in contrast to the ban on overtly flavoured tobacco products (apart from with menthol) in Australia.
Since October 2021, a prescription from a local doctor is required to purchase nicotine‐containing e‐cigarette products in Australia.25 However, no e‐cigarette product has been approved for medical smoking cessation therapy. Further, freely available e‐cigarette fluids labelled “nicotine‐free” are often found to contain nicotine when tested, and openly nicotine‐containing products are sold illegally.26 E‐cigarette fluids also contain flavours and other chemicals unsafe for inhalation. Removing e‐cigarette products from general retail sale could assist with both limiting the supply of illegal e‐cigarettes and strengthening the prescription model for smokers using e‐cigarettes to quit smoking. Further, ensuring that people are better informed about the effects of e‐cigarettes on health and the low certainty of evidence that they are effective when used for smoking cessation27 would complement any legislative efforts to reduce and prevent their adoption by young people.
Limitations
Ongoing and continuous data collection is a key strength of CITTS. It does not seek to draw conclusions about people who have never smoked or about those who quit more than twelve months before being contacted for the survey. CITTS does not assess whether participants use e‐cigarettes that provide nicotine, but future iterations of the survey could enquire about a nicotine‐providing devices and whether uses have prescription for their e‐cigarette products. Telephone surveys are biased toward people willing to answer their phones and participate. Finally, the survey does not ask questions about other substances that can be vaped, such as cannabis and vitamins.
Conclusion
The increase in e‐cigarette use between 2016 and 2020 by young adults who smoke or have recently quit undermines assertions that these products are designed for older smokers who have struggled to quit using other methods. E‐cigarette marketing, particularly in social media, should be more effectively regulated to reduce their uptake by young people and to thereby mitigate their public health impact.
Data sharing
The survey questions, technical reports, and data are available on request to the NSW Cancer Institute.28
Box 1 – Characteristics of the 10 004 participants in the Cancer Institute NSW Tobacco Tracking Survey (CITTS), 2016–2020, with weighted proportions*
|
|
Interview year |
||||||||||||||
|
Characteristic |
2016 |
2017 |
2018 |
2019 |
2020 |
||||||||||
|
|
|||||||||||||||
|
All respondents |
2005 |
2004 |
2003 |
2000 |
2000 |
||||||||||
|
Sex |
|
|
|
|
|
||||||||||
|
Men |
1156 (60.3%) |
1144 (60.3%) |
1110 (60.3%) |
1108 (58.1%) |
1135 (57.9%) |
||||||||||
|
Women |
849 (39.7%) |
860 (39.7%) |
893 (39.7%) |
888 (41.6%) |
852 (41.4%) |
||||||||||
|
Refused/other/non‐binary |
0 |
0 |
0 |
4 |
13 |
||||||||||
|
Age (years) |
|
|
|
|
|
||||||||||
|
18–24 |
219 (10.1%) |
196 (10.1%) |
204 (10.1%) |
202 (13.9%) |
184 (13.5%) |
||||||||||
|
25–39 |
455 (34.1%) |
435 (34.0%) |
395 (33.9%) |
394 (32.6%) |
418 (33.4%) |
||||||||||
|
40–44 |
171 (9.7%) |
176 (9.6%) |
147 (8.8%) |
115 (7.5%) |
147 (9.1%) |
||||||||||
|
45–54 |
406 (22.8%) |
435 (22.8%) |
412 (23.7%) |
368 (22.2%) |
361 (21.1%) |
||||||||||
|
55–64 |
450 (14.7%) |
411 (12.8%) |
469 (13.8%) |
456 (13.2%) |
451 (12.9%) |
||||||||||
|
65 or older |
304 (8.6%) |
350 (10.6%) |
374 (9.5%) |
462 (10.5%) |
439 (10.0%) |
||||||||||
|
Missing data |
0 |
1 |
2 |
3 |
0 |
||||||||||
|
Education level† |
|
|
|
|
|
||||||||||
|
Low |
468 (22.5%) |
490 (22.6%) |
501 (22.6%) |
471 (19.5%) |
461 (19.6%) |
||||||||||
|
Moderate |
991 (49.7%) |
1036 (53.0%) |
980 (50.7%) |
1001 (52.3%) |
973 (51.3%) |
||||||||||
|
High |
504 (25.8%) |
454 (23.1%) |
470 (24.3%) |
486 (26.5%) |
520 (27.3%) |
||||||||||
|
Missing data |
42 |
24 |
52 |
42 |
46 |
||||||||||
|
Residential region |
|
|
|
|
|
||||||||||
|
Metropolitan |
1190 (54.0%) |
1218 (54.0%) |
1197 (54.0%) |
1184 (58.4%) |
1219 (58.5%) |
||||||||||
|
Non‐metropolitan |
815 (46.0%) |
786 (46.0%) |
806 (46.0%) |
816 (41.6%) |
781 (41.5%) |
||||||||||
|
Residential socio‐economic status‡ |
|
|
|
|
|
||||||||||
|
Moderate or high |
1308 (63.2%) |
1291 (63.7%) |
1215 (63.1%) |
1227 (63.8%) |
1188 (61.1%) |
||||||||||
|
Low |
697 (36.8%) |
713 (36.3%) |
788 (36.9%) |
722 (36.2%) |
764 (38.9%) |
||||||||||
|
Missing data |
0 |
0 |
0 |
51 |
48 |
||||||||||
|
Smoking status |
|
|
|
|
|
||||||||||
|
Recent quitter |
376 (18.9%) |
338 (16.6%) |
344 (17.6%) |
376 (19.8%) |
332 (18.5%) |
||||||||||
|
Current smoker |
1629 (81.1%) |
1666 (83.4%) |
1659 (82.4%) |
1624 (80.2%) |
1668 (81.5%) |
||||||||||
|
Current smokers |
|
|
|
|
|
||||||||||
|
Smoking frequency |
|
|
|
|
|
||||||||||
|
Less than daily |
168 (10.3%) |
181 (10.9%) |
198 (11.9%) |
238 (14.7%) |
268 (16.1%) |
||||||||||
|
Daily |
1461 (89.7%) |
1485 (89.1%) |
1461 (88.1%) |
1386 (85.3%) |
1400 (83.9%) |
||||||||||
|
Heaviness of Smoking Index score |
|
|
|
|
|
||||||||||
|
Low |
355 (26.3%) |
336 (24.6%) |
331 (24.2%) |
343 (27.8%) |
358 (27.8%) |
||||||||||
|
Moderate |
939 (63.7%) |
968 (64.4%) |
960 (65.6%) |
891 (63.6%) |
904 (64.5%) |
||||||||||
|
High |
142 (10.0%) |
169 (11.0%) |
141 (10.2%) |
128 (8.7%) |
121 (7.7%) |
||||||||||
|
Missing data |
25 |
12 |
29 |
24 |
17 |
||||||||||
|
|
|||||||||||||||
|
* Weighted by age, sex, and region (metropolitan v non‐metropolitan). † Low: did not complete high school; moderate: completed high school or vocational college; high: tertiary education. ‡ Socio‐Economic Indices for Areas (SEIFA) Index of Relative Socio‐Economic Disadvantage.14 Low: quintiles 4–5; moderate to high: quintiles 1–3. |
|||||||||||||||
Box 2 – E‐cigarette use by 10 004 participants in the Cancer Institute NSW Tobacco Tracking Survey (CITTS), 2016–2020: proportions, with 95% confidence intervals*
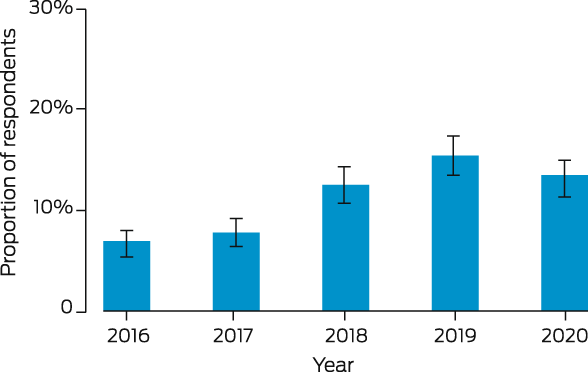
* Proportions weighted by age, sex, and region (metropolitan v non‐metropolitan).
Box 3 – E‐cigarette use by 10 004 participants in the Cancer Institute NSW Tobacco Tracking Survey (CITTS), 2016–2020, by demographic characteristics*
|
Characteristic |
Never use e‐cigarettes |
Use e‐cigarettes |
Use e‐cigarettes: adjusted odds ratio (95% CI) |
||||||||||||
|
|
|||||||||||||||
|
All respondents (model 1) |
9058 (90.5%) |
946 (9.5%) |
|
||||||||||||
|
Year |
|
|
|
||||||||||||
|
2016 |
1873 (93.4%) |
126 (6.6%) |
1 |
||||||||||||
|
2017 |
1855 (92.3%) |
147 (7.7%) |
1.23 (0.96–1.57) |
||||||||||||
|
2018 |
1790 (87.6%) |
213 (12.4%) |
1.89 (1.50–2.38) |
||||||||||||
|
2019 |
1751 (84.7%) |
249 (15.3%) |
2.27 (1.80–2.86) |
||||||||||||
|
2020 |
1789 (87.0%) |
211 (13.0%) |
1.86 (1.47–2.36) |
||||||||||||
|
Sex |
|
|
|
||||||||||||
|
Women |
3985 (90.0%) |
355 (10.0%) |
1 |
||||||||||||
|
Men |
5059 (88.3%) |
588 (11.7%) |
1.15 (0.99–1.33) |
||||||||||||
|
Missing data |
14 |
3 |
|
||||||||||||
|
Age (years) |
|
|
|
||||||||||||
|
18–24 |
812 (79.2%) |
193 (20.8%) |
1 |
||||||||||||
|
25–39 |
1826 (86.9%) |
270 (13.1%) |
0.60 (0.49–0.74) |
||||||||||||
|
40–44 |
680 (89.3%) |
76 (10.7%) |
0.48 (0.36–0.64) |
||||||||||||
|
45–54 |
1827 (92.0%) |
155 (8.0%) |
0.36 (0.29–0.46) |
||||||||||||
|
55–64 |
2077 (93.1%) |
157 (6.9%) |
0.32 (0.26–0.41) |
||||||||||||
|
65 or older |
1831 (94.8%) |
94 (5.2%) |
0.22 (0.16–0.28) |
||||||||||||
|
Missing data |
5 |
1 |
|
||||||||||||
|
Education level† |
|
|
|
||||||||||||
|
Low |
2233 (92.1%) |
158 (7.9%) |
1 |
||||||||||||
|
Moderate |
4482 (88.7%) |
494 (11.3%) |
1.23 (1.02–1.50) |
||||||||||||
|
High |
2159 (87.0%) |
274 (13.0%) |
1.50 (1.21–1.85) |
||||||||||||
|
Missing data |
184 |
20 |
|
||||||||||||
|
Residential region |
|
|
|
||||||||||||
|
Metropolitan |
3667 (90.7%) |
331 (9.3%) |
1 |
||||||||||||
|
Non‐metropolitan |
5391 (87.7%) |
615 (12.3%) |
1.19 (1.02–1.39) |
||||||||||||
|
Residential socio‐economic status‡ |
|
|
|
||||||||||||
|
Moderate or high |
3310 (88.2%) |
369 (11.8%) |
1 |
||||||||||||
|
Low |
5664 (89.5%) |
562 (10.5%) |
0.96 (0.83–1.11) |
||||||||||||
|
Missing data |
84 |
15 |
|
||||||||||||
|
Smoking status |
|
|
|
||||||||||||
|
Recent quitter |
1597 (88.6%) |
169 (11.4%) |
1 |
||||||||||||
|
Current smoker |
7461 (89.1%) |
777 (10.9%) |
1.11 (0.91–1.33) |
||||||||||||
|
Current smokers (model 2) |
|
|
|
||||||||||||
|
Smoking frequency |
|
|
|
||||||||||||
|
Less than daily |
907 (84.9%) |
145 (15.1%) |
1 |
||||||||||||
|
Daily |
6554 (89.9%) |
632 (10.1%) |
1.73 (0.90–3.32) |
||||||||||||
|
Heaviness of Smoking Index score |
|
|
|
||||||||||||
|
Low |
1837 (90.2%) |
174 (9.8%) |
1 |
||||||||||||
|
Moderate |
4433 (89.2%) |
455 (10.8%) |
1.44 (1.17–1.78) |
||||||||||||
|
High |
669 (91.4%) |
56 (8.6%) |
1.30 (0.91–1.84) |
||||||||||||
|
Missing data |
522 |
92 |
|
||||||||||||
|
|
|||||||||||||||
|
CI = confidence interval. * Weighted by age, sex, and region (metropolitan v non‐metropolitan). † Low: did not complete high school; moderate: completed high school or vocational college; high: tertiary education. ‡ Socio‐Economic Indices for Areas (SEIFA) Index of Relative Socio‐Economic Disadvantage.14 Low: quintiles 4–5; moderate to high: quintiles 1–3. |
|||||||||||||||
Box 4 – Frequency of e‐cigarette use by the 935 e‐cigarette users in the Cancer Institute NSW Tobacco Tracking Survey (CITTS), 2016–2020, by demographic characteristics*
|
Characteristic |
Infrequent use |
Frequent use |
Frequent use: adjusted odds ratio (95% CI) |
||||||||||||
|
|
|||||||||||||||
|
All e‐cigarette users (model 1) |
416 (4.2%) |
519 (5.2%) |
|
||||||||||||
|
Year |
|
|
|
||||||||||||
|
2016 |
65 (3.5%) |
61 (3.1%) |
1 |
||||||||||||
|
2017 |
72 (3.4%) |
75 (4.3%) |
1.04 (0.63–1.71) |
||||||||||||
|
2018 |
85 (5.0%) |
123 (7.3%) |
1.49 (0.92–2.42) |
||||||||||||
|
2019 |
101 (7.0%) |
146 (8.2%) |
1.62 (1.00–2.62) |
||||||||||||
|
2020 |
93 (5.8%) |
114 (7.0%) |
1.27 (0.78–2.06) |
||||||||||||
|
Sex |
|
|
|
||||||||||||
|
Women |
194 (5.6%) |
155 (4.3%) |
1 |
||||||||||||
|
Men |
222 (4.5%) |
361 (7.1%) |
2.49 (1.83–3.39) |
||||||||||||
|
Age (years) |
|
|
|
||||||||||||
|
18–24 |
102 (10.9%) |
90 (9.9%) |
1 |
||||||||||||
|
25–39 |
122 (6.0%) |
145 (7.0%) |
1.38 (0.89–2.13) |
||||||||||||
|
40–44 |
31 (4.2%) |
44 (6.4%) |
2.04 (1.11–3.76) |
||||||||||||
|
45–54 |
59 (3.2%) |
96 (4.8%) |
1.75 (1.05–2.92) |
||||||||||||
|
55–64 |
58 (2.6%) |
97 (4.2%) |
2.56 (1.59–4.14) |
||||||||||||
|
65 or older |
44 (2.4%) |
46 (2.6%) |
1.57 (0.89–2.77) |
||||||||||||
|
Education level† |
|
|
|
||||||||||||
|
Low |
71 (3.4%) |
81 (4.2%) |
1 |
||||||||||||
|
Moderate |
219 (5.1%) |
273 (6.1%) |
1.22 (0.80–1.85) |
||||||||||||
|
High |
119 (5.9%) |
152 (7.0%) |
1.15 (0.73–1.83) |
||||||||||||
|
Residential region |
|
|
|
||||||||||||
|
Metropolitan |
138 (3.9%) |
188 (5.3%) |
1 |
||||||||||||
|
Non‐metropolitan |
278 (5.8%) |
331 (6.5%) |
0.89 (0.64–1.24) |
||||||||||||
|
Residential socio‐economic status‡ |
|
|
|
||||||||||||
|
Moderate or high |
155 (5.1%) |
211 (6.6%) |
1 |
||||||||||||
|
Low |
256 (4.8%) |
298 (5.6%) |
0.92 (0.68–1.25) |
||||||||||||
|
Smoking status |
|
|
|
||||||||||||
|
Recent quitter |
30 (2.1%) |
139 (9.4%) |
1 |
||||||||||||
|
Current smoker |
386 (5.6%) |
380 (5.2%) |
0.20 (0.13–0.32) |
||||||||||||
|
Current smokers only (model 2) |
|
|
|
||||||||||||
|
Smoking frequency |
|
|
|
||||||||||||
|
Less than daily |
80 (8.5%) |
63 (6.5%) |
1 |
||||||||||||
|
Daily |
306 (5.0%) |
317 (5.0%) |
2.39 (0.64–8.93) |
||||||||||||
|
Heaviness of Smoking Index score |
|
|
|
||||||||||||
|
Low |
84 (4.6%) |
87 (5.0%) |
1 |
||||||||||||
|
Moderate |
220 (5.4%) |
229 (5.3%) |
0.87 (0.57–1.33) |
||||||||||||
|
High |
31 (5.0%) |
24 (3.5%) |
0.44 (0.21–0.90) |
||||||||||||
|
|
|||||||||||||||
|
CI = confidence interval. * Weighted by age, sex, and region (metropolitan v non‐metropolitan). Infrequent use: monthly, less than monthly; frequent use: weekly, daily. Frequency data missing for eleven respondents. † Low: did not complete high school; moderate: completed high school or vocational college; high: tertiary education. ‡ Socio‐Economic Indices for Areas (SEIFA) Index of Relative Socio‐Economic Disadvantage.14 Low: quintiles 4–5; moderate to high: quintiles 1–3. |
|||||||||||||||
Box 5 – E‐cigarette use among 10 004 participants in the Cancer Institute NSW Tobacco Tracking Survey (CITTS), 2016–2020, by age group and survey year*
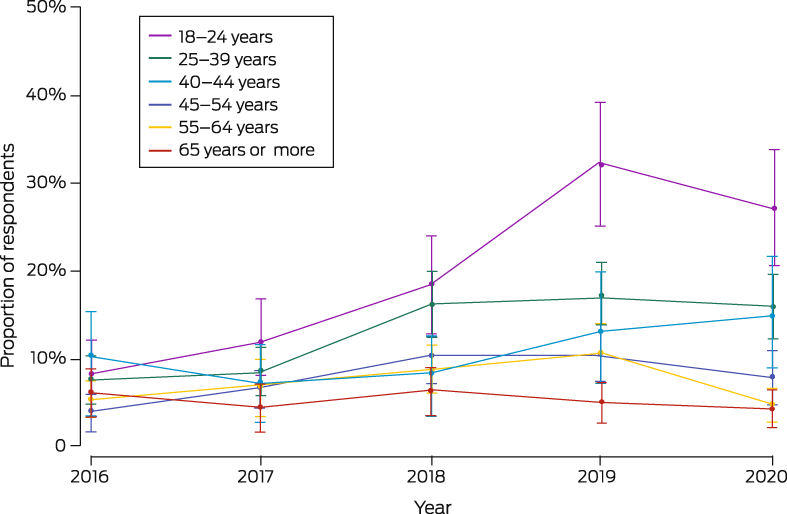
* Proportions weighted by age, sex, and region (metropolitan v non‐metropolitan). The data for this graph are included in the Supporting Information, table 1.
Box 6 – Reasons provided by 939 e‐cigarette users for using e‐cigarettes: the Cancer Institute NSW Tobacco Tracking Survey (CITTS), 2016–2020, by demographic characteristic*
|
Characteristic |
To help me quit cigarettes |
Cut down on the number of cigarettes I smoke |
Not as bad for your health as cigarettes |
Cheaper than cigarettes |
Taste better than cigarettes |
So I can smoke places where cigarettes are not allowed |
I was curious |
||||||||
|
|
|||||||||||||||
|
All respondents |
315 (33%) [30–37%] |
230 (25%) [22–28%] |
208 (22%) [19–25%] |
190 (19%) [17–22%] |
129 (15%) [12–18%] |
75 (8%) [6–10%] |
70 (8%) [6–10%] |
||||||||
|
Year |
|
|
|
|
|
|
|
||||||||
|
2016 |
33 (26%) [17–34%] |
22 (20%) [11–28%] |
20 (16%) [8–23%] |
19 (15%) [8–22%] |
16 (11%) [5–17%] |
15 (11%) [5–18%] |
4 (4%) [0–7%] |
||||||||
|
2017 |
59 (41%) [32–50%] |
28 (18%) [11–25%] |
31 (22%) [14–30%] |
22 (15%) [9–22%] |
13 (10%) [4–15%] |
12 (7%) [2–11%] |
16 (10%) [5–15%] |
||||||||
|
2018 |
57 (26%) [20–33%] |
57 (28%) [21–35%] |
51 (24%) [18–31%] |
45 (20%) [14–26%] |
21 (11%) [6–15%] |
12 (5%) [2–9%] |
11 (6%) [2–9%] |
||||||||
|
2019 |
83 (34%) [27–40%] |
60 (25%) [19–32%] |
57 (21%) [16–27%] |
54 (20%) [15–26%] |
37 (17%) [11–22%] |
18 (7%) [3–11%] |
14 (6%) [3–10%] |
||||||||
|
2020 |
80 (38%) [30–45%] |
63 (27%) [20–34%] |
49 (24%) [18–31%] |
50 (22%) [16–29%] |
42 (22%) [16–29%] |
18 (10%) [5–15%] |
25 (12%) [7–18%] |
||||||||
|
Sex |
|
|
|
|
|
|
|
||||||||
|
Women |
113 (32%) [26–37%] |
81 (24%) [19–30%] |
65 (20%) [15–24%] |
66 (17%) [12–21%] |
54 (17%) [12–22%] |
30 (8%) [5–11%] |
34 (11%) [7–14%] |
||||||||
|
Men |
200 (34%) [29–38%] |
147 (25%) [21–29%] |
142 (23%) [20–27%] |
123 (21%) [17–24%] |
74 (14%) [11–17%] |
45 (8%) [5–10%] |
36 (6%) [4–8%] |
||||||||
|
Age group (years) |
|
|
|
|
|
|
|
||||||||
|
18–24 |
39 (21%) [15–28%] |
30 (16%) [11–22%] |
34 (18%) [12–24%] |
30 (16%) [10–22%] |
53 (27%) [20–34%] |
7 (4%) [1–7%] |
22(12%) [7–17%] |
||||||||
|
25–39 |
97 (37%) [31–43%] |
60 (24%) [18–29%] |
59 (22%) [17–27%] |
52 (20%) [15–25%] |
34 (13%) [9–18%] |
21 (8%) [5–12%] |
22 (8%) [5–12%] |
||||||||
|
40–44 |
31 (38%) [26–50%] |
26 (38%) [25–50%] |
21 (29%) [18–41%] |
19 (26%) [15–37%] |
12 (19%) [9–29%] |
7 (9%) [2–16%] |
7 (7%) [2–13%] |
||||||||
|
45–54 |
50 (30%) [22–38%] |
47 (31%) [23–39%] |
43 (24%) [17–31%] |
33 (18%) [12–24%] |
15 (8%) [4–12%] |
15 (9%) [4–14%] |
5 (3%) [0–6%] |
||||||||
|
55–64 |
67 (44%) [36–53%] |
39 (25%) [18–33%] |
36 (24%) [16–31%] |
40 (26%) [18–34%] |
8 (6%) [2–10%] |
14 (8%) [3–12%] |
8 (5%) [1–9%] |
||||||||
|
65 or older |
31 (38%) [26–50%] |
28 (29%) [19–40%] |
15 (17%) [9–26%] |
16 (15%) [7–22%] |
7 (8%) [2–14%] |
10 (11%) [4–17%] |
6 (5%) [1–10%] |
||||||||
|
Smoking status |
|
|
|
|
|
|
|
||||||||
|
Smoker |
244 (31%) [28–35%] |
218 (29%) [25–33%] |
150 (19%) [16–23%] |
154 (19%) [16–22%] |
106 (15%) [12–18%] |
70 (9%) [6–11%] |
61 (8%) [6–11%] |
||||||||
|
Recent quitter |
71 (41%) [32–49%] |
12 (6%) [2–11%] |
58 (33%) [25–41%] |
36 (20%) [14–27%] |
23 (14%) [8–19%] |
5 (3%) [0–7%] |
9 (5%) [1–9%] |
||||||||
|
|
|||||||||||||||
|
* Proportions weighted by age, sex, and region (metropolitan v non‐metropolitan), with 95% confidence intervals. Multiple responses possible. Missing data mean that not all categories add to 100%. Other responses are summarised in the Supporting Information, table 2. |
|||||||||||||||
Received 24 June 2022, accepted 7 November 2022
- Becky Freeman1
- Katherine Owen1
- Sandra Rickards2
- Alecia Brooks3
- Philip J Clare1
- Anita Dessaix3
- 1 Sydney School of Public Health, the University of Sydney, Sydney, NSW
- 2 Cancer Institute NSW, Sydney, NSW
- 3 Cancer Council NSW, Sydney, NSW
Open access
Open access publishing facilitated by The University of Sydney, as part of the Wiley ‐ The University of Sydney agreement via the Council of Australian University Librarians.
This investigation was funded by the Cancer Institute NSW and the Cancer Council NSW. The Cancer Institute NSW designed, funded, and delivered the survey, including data collection. The Cancer Institute and the Cancer Council NSW paid for the data analysis and manuscript preparation.
Becky Freeman has received relevant grants from the NSW Department of Health, the Ian Potter Foundation, VicHealth, and Healthway WA; relevant research contracts from the Cancer Institute NSW and the Cancer Council NSW; relevant personal fees from the World Health Organization, the Hong Kong Special Administrative Region Department of Health, BMJ Tobacco Control, the Heart Foundation NSW, the United States Food and Drug Administration, the National Health and Medical Research Council e‐cigarette working committee, NSW Health, and Cancer Council NSW; and relevant travel expenses from the Oceania Tobacco Control Conference and the Australia Public Health Association preventive health conference. She serves as an expert advisor to the Cancer Council Australia Tobacco Issues Committee and the Cancer Institute NSW Vaping Communications Advisory Panel. Anita Dessaix and Alesia Brooks have received payments to their institution from the Australian Department of Health, NSW Health, Cancer Council Australia, the Cancer Institute NSW, and the Minderoo Foundation. Dessaix has acted as an unpaid expert advisor to the National Preventive Health Strategy expert advisory committee, the Cancer Institute Vaping Communications Advisory Panel, the Asthma Australia Campaign advisory committee, and the NSW Cancer Plan Governance advisory committee, and chairs the Cancer Council Public Health committee. Brooks has acted as an unpaid expert advisor to the Tobacco Issues committee, the Tobacco Creative Campaign committee, the Excellence in Smoking Cessation Training, Education and Resources advisory committee, the NSW Health NGO Tobacco Committee, and the Midwives and Obstetricians Helping Mothers to Quit advisory committee.
- 1. Greenhalgh E, Bayly M, Scollo M. Prevalence of smoking: adults. Updated Sept 2021. In: Greenhalgh, EM, Scollo MM, Winstanley MH [editors]. Tobacco in Australia: facts and issues. Melbourne: Cancer Council Victoria. http://www.tobaccoinaustralia.org.au/chapter‐1‐prevalence/1‐3‐prevalence‐of‐smoking‐adults (viewed May 2022).
- 2. Greenhalgh E, Winstanley M. Prevalence of smoking: teenagers. Updated Sept 2022. In: Greenhalgh, EM, Scollo MM, Winstanley MH [editors]. Tobacco in Australia: facts and issues. Melbourne: Cancer Council Victoria. http://www.tobaccoinaustralia.org.au/chapter‐1‐prevalence/1‐6‐prevalence‐of‐smoking‐teenagers (viewed Sept 2022).
- 3. Wakefield MA, Durkin S, Spittal MJ, et al. Impact of tobacco control policies and mass media campaigns on monthly adult smoking prevalence. Am J Public Health 2008; 98: 1443‐1450.
- 4. White VM, Warne CD, Spittal MJ, et al. What impact have tobacco control policies, cigarette price and tobacco control programme funding had on Australian adolescents’ smoking? Findings over a 15‐year period. Addiction 2011; 106: 1493‐1502.
- 5. Baenziger ON, Ford L, Yazidjoglou A, et al. E‐cigarette use and combustible tobacco cigarette smoking uptake among non‐smokers, including relapse in former smokers: umbrella review, systematic review and meta‐analysis. BMJ Open 2021; 11: e045603.
- 6. Hartmann‐Boyce J, McRobbie H, Butler AR, et al. Electronic cigarettes for smoking cessation [updated version]. Cochrane Database Syst Rev 2021; CD010216.
- 7. McCausland K, Maycock B, Leaver T, Jancey J. The messages presented in electronic cigarette‐related social media promotions and discussion: scoping review. J Med Internet Res 2019; 21: e11953.
- 8. US Department of Health and Human Services. Activities of the e‐cigarette companies. In: E‐cigarette use among youth and young adults: a report of the Surgeon General. Atlanta (GA): US Department of Health and Human Services, Centers for Disease Control and Prevention, National Center for Chronic Disease Prevention and Health Promotion, Office on Smoking and Health, 2016; pp. 147‐179. https://www.cdc.gov/tobacco/data_statistics/sgr/e‐cigarettes/pdfs/2016_SGR_Chap_4_508.pdf (viewed May 2022).
- 9. Banks E, Yazidjoglou A, Brown S, et al. Electronic cigarettes and health outcomes: systematic review of global evidence: report for the Australian Department of Health. Apr 2022. Canberra: National Centre for Epidemiology and Population Health. https://openresearch‐repository.anu.edu.au/bitstream/1885/262914/1/Electronic%20cigarettes%20health%20outcomes%20review_2022_WCAG.pdf (viewed Nov 2022).
- 10. Larcombe A, Allard S, Pringle P, et al. Chemical analysis of fresh and aged Australian e‐cigarette liquids. Med J Aust 2022; 216: 27‐32. https://www.mja.com.au/journal/2022/216/1/chemical‐analysis‐fresh‐and‐aged‐australian‐e‐cigarette‐liquids
- 11. Tsai M, Byun MK, Shin J, Crotty Alexander LE. Effects of e‐cigarettes and vaping devices on cardiac and pulmonary physiology. J Physiol 2020; 598: 5039‐5062.
- 12. Spindle TR, Eissenberg T. Pod mod electronic cigarettes: an emerging threat to public health. JAMA Netw 2018; 1: e183518.
- 13. Dunlop S, Lyons C, Dessaix A, Currow D. How are tobacco smokers using e‐cigarettes? Patterns of use, reasons for use and places of purchase in New South Wales. Med J Aust 2016; 204: 355. https://www.mja.com.au/journal/2016/204/9/how‐are‐tobacco‐smokers‐using‐e‐cigarettes‐patterns‐use‐reasons‐use‐and‐places
- 14. Australian Bureau of Statistics. 2033.0.55.001. Census of Population and Housing: Socio‐Economic Indexes for Areas (SEIFA), Australia, 2016. IRSD. Updated 27 Mar 2018. https://www.abs.gov.au/ausstats/abs@.nsf/Lookup/by%20Subject/2033.0.55.001~2016~Main%20Features~IRSD~19 (viewed Nov 2022).
- 15. Heatherton TF, Kozlowski LT, Frecker RC, et al. Measuring the heaviness of smoking: using self‐reported time to the first cigarette of the day and number of cigarettes smoked per day. Br J Addict 1989; 84: 791‐799.
- 16. Myers P, Vickers N. Data quality statement: 2005–2015 Cancer Institute Tobacco Tracking Survey. 16 Aug 2016. https://www.cancer.nsw.gov.au/about‐cancer/document‐library/data‐quality‐statement‐2005‐2015‐cancer‐institute‐ (viewed Oct 2022).
- 17. NSW Health. Ban on the display of e‐cigarettes and accessories in retail outlets and locations in which they can be sold. Updated 10 Nov 2017. https://www.health.nsw.gov.au/tobacco/Pages/ban‐display‐e‐cigarettes.aspx (viewed May 2022).
- 18. NSW Health. E‐cigarettes and smoke‐free laws. Updated 29 Sept 2021. https://www.health.nsw.gov.au/tobacco/Pages/use‐ecigs‐in‐public‐places.aspx (viewed May 2022).
- 19. Vassey J, Valente T, Barker J, et al. E‐cigarette brands and social media influencers on Instagram: a social network analysis. Tob Control 2022; https://doi.org/10.1136/tobaccocontrol‐2021‐057053 [online ahead of print].
- 20. Hoek J, Freeman B. BAT(NZ) draws on cigarette marketing tactics to launch Vype in New Zealand. Tob Control 2019; 28(e2): e162‐e163.
- 21. Alpert JM, Chen H, Adams KA. E‐cigarettes and social media: attitudes and perceptions of young adults to social media messages. Addiction Research and Theory 2020; 28: 387‐396.
- 22. Freeman B, Watts C, Astuti PAS. Global tobacco advertising, promotion and sponsorship regulation: what's old, what's new and where to next? Tob Control 2022; 31: 216‐221.
- 23. Pisinger C, Rasmussen S. A systematic review comparing the health effects of dual use of electronic and conventional cigarettes with health effects of exclusive smoking of conventional cigarettes [preprint]. Research Square; 13 Jan 2022; https://doi.org/10.21203/rs.3.rs‐1116605/v1 (viewed May 2022).
- 24. Abi Nehme AM, Lou XL, Yan X, et al. Transition to smoking cessation among dual cigarette and e‐cigarette users in the population assessment of tobacco and health study, Waves 3 and 4 (2015–2017). Addict Behav 2022; 129: 107284.
- 25. Therapeutic Goods Administration (Australian Department of Health and Aged Care). Nicotine vaping product access. Updated 24 Oct 2022. https://www.tga.gov.au/nicotine‐vaping‐product‐access#what‐is‐happening (viewed May 2022).
- 26. NSW Health. Enforcement of nicotine containing e‐cigarette laws. Updated 15 Nov 2022. https://www.health.nsw.gov.au/tobacco/Pages/Enforcement‐nicotine‐containing‐e‐cigarettes.aspx (viewed Nov 2022).
- 27. Zhang YY, Bu FL, Dong F, et al. The effect of e‐cigarettes on smoking cessation and cigarette smoking initiation: an evidence‐based rapid review and meta‐analysis. Tob Induc Dis 2021; 19: 04.
- 28. Cancer Institute NSW. Tobacco Tracking Survey (CITTS). Undated. https://www.cancer.nsw.gov.au/research‐and‐data/cancer‐data‐and‐statistics/request‐unlinked‐unit‐record‐data‐for‐research/cancer‐institute‐tobacco‐tracking‐survey‐citts (viewed Nov 2022).
Abstract
Objective: To examine e‐cigarette use by adults who smoke or have recently quit, and demographic characteristics associated with their use; to assess reasons for using e‐cigarettes.
Design: The Cancer Institute NSW Tobacco Tracking Survey (CITTS) is an ongoing, serial, cross‐sectional telephone survey study (40 interviews each week). This report is based on interviews during 4 January 2016 – 31 December 2020.
Setting, participants: Randomly selected New South Wales adults who are current smokers (smoked cigarettes, pipes, or other tobacco products daily, weekly, or less often) or recent quitters (smoked tobacco products in the past twelve months but who no longer smoked).
Main outcomes: E‐cigarette use by age group; reasons for using e‐cigarettes.
Results: CITTS callers rang 1 494 233 randomly selected numbers; in 203 203 answered calls (13.6%), 11 125 people were eligible for the survey (5.5% of answered calls), of whom 10 004 completed the survey interview, including the question about whether they used e‐cigarettes (89.9%). Overall e‐cigarette use increased from 6.6% of respondents in 2016 to 13.0% in 2020 (adjusted odds ratio, 1.86; 95% confidence interval [CI], 1.47–2.36). The proportion of respondents aged 18–24 years who reported e‐cigarette use increased from 18.4% (95% CI, 12.9–23.9%) in 2018 to 27.2% (95% CI, 20.5–33.9%) in 2020, a larger proportion than for any other age group. The leading reasons offered for e‐cigarette use were “to help me quit smoking” (33%; 95% CI, 30–37%) and “to cut down on the number of cigarettes I smoke” (25%; 95% CI, 22–28%).
Conclusion: The increase between 2016 and 2020 in the proportions of young adults who smoke or have recently quit who use e‐cigarettes undermines claims that these products are designed for older smokers who have struggled to quit using other methods.