


The known: Delays in ambulance offload are associated with poorer ambulance response times and longer admissions, but their impact on clinical outcomes for patients is less clear.
The new: In a population‐based study of adults with chest pain taken by ambulance to Victorian emergency departments, longer ambulance offload times were associated with greater 30‐day risks of death and repeated need for ambulance transport for emergency assessment.
The implications: The increasing length of ambulance‐to‐emergency department transfers in Australia requires urgent attention to reduce the risk of poor outcomes for people with chest pain.
Ambulance offload times are an increasing problem in Australian health care. Overcrowding in emergency departments (EDs) is causing more frequent and longer delays of ambulance‐to‐ED transfers.1,2,3 The adverse effects of offload delays at the system level include associations with poorer ambulance response times, greater access block, longer ED and admission times, and cancellations of elective admissions and procedures.2,3 The impact of offload delays at the patient level is less clear. Several studies have found delays to assessment and treatment,4,5 but implications for clinical endpoints such as mortality and re‐admission have not been examined in detail.
Nearly one in ten calls for ambulance transport in Australia are for people with chest pain, who subsequently receive diagnoses ranging from the benign to the urgent, such as acute coronary syndrome and acute aortic pathology.6 As timely care is associated with better outcomes for people with a variety of conditions that cause chest pain,7,8,9 they are an ideal group in which to examine the influence of ambulance offload time on clinical outcomes.
In a large population‐based study of ED presentations by people with non‐traumatic chest pain, we assessed whether ambulance offload time influenced the risks of death or ambulance re‐attendance with chest pain within 30 days of the initial ED presentation.
Methods
We undertook a population‐based observational cohort study of consecutive presentations by adults with non‐traumatic chest pain transported by ambulance to Victorian EDs during 1 January 2015 – 30 June 2019. To follow the complete patient journey, pre‐hospital data entered by paramedics into Victorian Ambulance Clinical Information System (VACIS) electronic patient care records were linked to the Victorian Emergency Minimum Dataset (VEMD), the Victorian Admitted Episodes Dataset (VAED), and the Victorian Death Index (VDI) (Supporting Information, table 1). Full details regarding the study population and linkage processes have been published,10 and are also summarised in the Supporting Information (supplementary methods).
Study population
Consecutive patients aged 18 years or more were included in our analysis if their VACIS records included pain in the chest, or they received a final or secondary ambulance diagnosis of ischaemic chest pain, acute coronary syndrome, acute myocardial infarction, pleuritic pain, or angina. We excluded patients with traumatic chest pain or ST elevation myocardial infarction (pre‐hospital electrocardiography), and those who were transferred between hospitals or were not transported to hospital (eg, cardiac arrest or death prior to transport).
Study definitions
Offload time was defined as the time between the ambulance arriving at the hospital and the patient being transferred from the stretcher to an ED bed. We also assessed time from ambulance arrival to nurse triage, time from triage to transfer from the stretcher, and total ambulance time (from ambulance dispatch to its departing the hospital). To avoid confounding by data for patients with unstable conditions being rapidly transferred to ED beds, we excluded those transported to ED “with lights and sirens” and patients classified on ED arrival as category 1 (resuscitation). Geographic remoteness was based on the postcode of the ambulance attendance location, using the Accessibility and Remoteness Index of Australia (ARIA), which classifies postcodes according to relative access to services in Australia as major city, inner regional, outer regional, remote, or very remote;11 in this study we combined the final three categories as a single category. Clinical assessments during transport at the time point closest to arrival at the ED (eg, heart rate, blood pressure) were used as clinical status measures. Low Glasgow Coma Scale (GCS) score was defined as a score below 15. Fever was defined as a temperature of at least 38°C. “In‐hours” was defined as 8 am – 5 pm, “out‐of‐hours” as 5 pm – 8 am. Total hospital bed number was categorised as fewer than 250, 250–499, or 500 or more. Discharge diagnosis was defined according to International Classification of Diseases, tenth revision, Australian modification (ICD‐10‐AM) coding of the hospital discharge primary diagnosis for patients discharged from hospital or the ED primary diagnosis for those discharged from the ED (details: Supporting Information, supplementary methods).
Outcomes
The primary outcome was 30‐day all‐cause mortality according to Victorian Death Index data. The secondary outcome was re‐presentations with chest pain to an ED, with transport by ambulance, within 30 days of the initial ED presentations.
Statistical analysis
Continuous data are summarised as means with standard deviations (SDs) or medians with interquartile ranges (IQRs), categorical data as counts with proportions. Offload times (by whole minute) were collated as tertiles of roughly equal patient numbers. To assess associations between ambulance offload time tertile and 30‐day mortality and ambulance re‐attendance rates, risk differences with 95% confidence intervals (CIs) were calculated by unadjusted and adjusted logistic regression (reference: tertile 1). Numbers needed to harm were calculated for tertiles two and three as the inverse of the adjusted risk differences. In our adjusted analysis, multilevel mixed effects logistic regression models included the covariates age, sex, comorbid conditions, clinical status (blood pressure, heart rate, respiratory rate, oxygen saturation as continuous variables; fever, low GCS score, ambulance pain score as categorical variables), day of the week, season, time (in‐ or out‐of‐hours), year, and total hospital bed numbers, with admitting hospital as a random effect to account for clustering. These variables were selected on the basis of a directed acyclic graph, which depicts how factors may confound the direct effect of the characteristic of interest on an outcome12 (Box 1). To handle missing data (Supporting Information, table 2), we applied multiple imputation with chained equations, assuming that data were missing at random. Ten datasets were imputed using all covariates included in the multivariable model, including the outcome variables, and Rubin’s rules were used to pool results.13
We assessed the robustness of the results of our primary analysis in a series of sensitivity analyses. First, to explore potential non‐linear relationships between offload time and 30‐day outcomes, we calculated the same multivariable regression model (excluding fever as a variable, because of missing data) in a complete case analysis, with offload time included as a continuous variable in a restricted cubic spline model. We fitted models with three, four or five knots, and selected the model with the lowest Akaike information criterion value. Second, to assess the effect of discharge diagnosis (ED or hospital), we repeated the analysis after restricting the primary analysis dataset (with multiple imputation) to patients with linked discharge diagnosis data from the VEMD or VAED datasets; we calculated unadjusted and adjusted outcome rates and risk differences as for the primary analysis. Third, to assess the appropriateness of current performance indicators for ambulance offload times, we estimated unadjusted and adjusted mortality rates and risk differences using the same model as the primary analysis (dataset with multiple imputation) for 10‐minute time segments to 60 minutes, with the period of lowest mortality (10–19 minutes) as reference. Finally, to assess the effect of clinical and hospital‐level parameters on offload delay, we performed a multivariable linear regression analysis with offload time as the dependent variable. Statistical analyses were conducted in Stata/MP 17.0.
Ethics approval
The Monash University Human Research Ethics Committee Ethics approved data linkage and the study (reference, 11681).
Results
A total of 232 973 patients with chest pain transported to EDs by ambulance met the inclusion criteria. We excluded 13 390 patients (5.7%) transported with lights and sirens or triaged as ED category 1, and 6039 patients (2.6%) for whom offload times were not recorded (Supporting Information, figure 1). The median offload time for the 213 544 included patients was 13 (IQR, 10–16) minutes for tertile 1 (range, 0–17 min), 22 (IQR, 20–25) minutes for tertile 2 (range, 18–28 min), and 41 (IQR, 33–56) minutes for tertile 3 (more than 28 min). The overall median offload time increased from 21 (IQR, 15–30) minutes in 2015 to 24 (IQR, 17–37) minutes during the first half of 2019 (Box 2).
Patient characteristics
Mean patient age was similar for all three tertiles (overall mean, 62 years; SD, 18 years); the proportion of women rose slightly from tertile 1 (49.9%) to 3 (52.1%). Most patients in tertile 3 had attended metropolitan EDs (82.3%) and public hospitals (96.6%); 37% of metropolitan presentations were included in tertile 3 (v inner regional, 23%; outer regional/remote/very remote, 16%), as were 35% of those to public hospitals (v private hospitals, 16%). Larger proportions of patients with histories of certain medical conditions were included in tertile 3, including diabetes mellitus (36%; tertile 1, 29%; tertile 2, 35%), chronic kidney disease (40%; tertile 1, 26%; tertile 2, 34%), prior stroke (37%; tertile 1, 28%; tertile 2, 35%), and peripheral vascular disease (38%; tertile 1, 27%; tertile 2, 35%) (Box 3).
Among the 181 130 patients for whom data linkage to the VAED and VEMD was possible, relatively large proportions of patients triaged as category 3 cases (urgent; 42%; v emergent, 31%; semi‐urgent, 28%) or with ED stays longer than four hours (41%) had experienced tertile 3 offload delays, but proportions by ED disposition were similar (Supporting Information, table 3), as were the proportions by discharge diagnosis (Supporting Information, table 4).
30‐day mortality and re‐attendance by ambulance
In the primary analysis, 30‐day risk of death was greater for patients in tertile 3 than in tertile 1 (adjusted rates, 1.57% v 1.29%; adjusted risk difference [aRD], 0.28 [95% CI, 0.16–0.42] percentage points), as was that of a second ambulance attendance with chest pain (adjusted rates, 9.03% v 8.15%; aRD, 0.87 [95% CI, 0.57–1.18] percentage points). Compared with treatment in tertile 1, the number needed to harm to result in one extra death within 30 days was 769 patients treated in tertile 2 and 357 in tertile 3; for one extra ambulance re‐attendance within 30 days the numbers needed to harm were 238 patients treated in tertile 2 and 115 in tertile 3 (Box 4).
In a complete case analysis using the restricted cubic spline model, the adjusted odds ratio for mortality (reference: 15 minutes) increased non‐linearly with offload time (Box 5).
Thirty‐day mortality by discharge diagnosis for the 181 130 patients for whom data could be linked to the VEMD or VAED datasets are summarised in the Supporting Information, table 5. Analyses limited to this subgroup and adjusted for discharge diagnosis (hospital or ED) yielded results similar to those of the primary analysis (mortality: adjusted rates, 1.70% v 1.46%; aRD, 0.24 [95% CI, 0.09–0.39] percentage points; re‐attendance: adjusted rates, 9.94% v 8.98%; aRD, 0.94 [95% CI, 0.62–1.31] percentage points) (Supporting Information, table 6). In an analysis of 10‐minute offload periods, unadjusted and adjusted mortality rates were significantly higher for periods longer than 10–19 minutes, except for 40–49 minutes (Supporting Information, table 7).
Variables associated with longer offload times
Presentations by people aged 65 years or more or by women, larger total number of hospital beds, daytime (8 am – 5 pm) or evening (5 pm – 12 am) presentations, and presentations during winter or spring or during years after 2015 were associated with longer offload times. Presenting to a private hospital, with pain scores exceeding three out of ten, or on the weekend were associated with shorter offload times (Supporting Information, table 8).
Discussion
We assessed the impact of ambulance offload time on 30‐day clinical outcomes for patients with chest pain. Our major findings are that the median offload time increased during 2015–19, that the risks of death and ambulance re‐attendance with chest pain within 30 days of initial ED presentation were higher when the offload time exceeded 17 minutes, and that longer offload times were associated with presentations by people over 65 and women, at hospitals with larger total bed numbers, and presentation between 8 am and midnight, on weekdays, or during winter or spring.
Ambulance offload delays (“ramping”) have caused substantial concern during the past decade in many countries, including Australia, the United States, the United Kingdom, and Canada.1,2 In Australia, the median offload time has increased, as confirmed by our study. Offload delays have consequences for both the health care system and patients.14 They have been associated with prolonged ambulance response times, longer ED and hospital admission times, and cancellations of elective admissions and procedures probably caused by ED overcrowding and access block.2,3 The impact of delays on patient outcomes is less clear; longer assessment and length of stay times have been reported,4 but discussion of their influence on clinical endpoints such as death has largely been limited to anecdotal reports in the mass media.15
We found that longer ED offload time was associated with greater 30‐day risk of death and ambulance re‐attendance for patients with chest pain. About 51 000 people with chest pain were transported to Victorian EDs in 2018, and in 70% of cases the offload time exceeded 17 minutes. Offload times of 18–28 minutes were associated with numbers needed to harm of 769 for death and 238 for re‐attendance within 30 days; for offload times greater than 28 minutes, the numbers were 357 (death) and 115 treated patients (re‐attendance). This is equivalent to about 70 preventable deaths and 225 preventable re‐attendances by patients with chest pain. The importance of prompt management in other areas of medicine is recognised, including time to primary revascularisation for patients with ST elevation myocardial infarction, to angiography in non‐ST elevation myocardial infarction, to thrombolysis in stroke, and to antibiotic therapy in cases of sepsis.7,8,9,16 Although the reasons for many cases of undifferentiated chest pain prove to be less serious than these conditions, increased risk could still be expected after delayed management.
Other studies of the influence of offload time on mortality were limited because they did not consider a non‐linear relationship between offload time and outcomes, and included patients triaged by paramedics as requiring emergency “lights and sirens” transport.4,5 We excluded these patients from our analysis (5.7% of all patients transported), as early mortality in this group is higher than the overall rate, which may confound the relationship between offload time and outcomes. Why offload time influences ambulance re‐attendance rates is not clear, but may be related to ED overcrowding and access block, associated with misdiagnosis, medication errors, hurried discharges, and higher re‐admission rates in some studies.17
Our findings should alert clinicians and health policymakers to the need for innovative strategies that reduce ambulance offload times. A key performance indicator for hospital performance in Victoria is the proportion of patients transferred from ambulance to ED within 40 minutes. As we found that mortality increased with times beyond 17 minutes, this target may be less appropriate than aiming to complete transfers within 15–20 minutes. Such a change to guidelines would be consistent with other jurisdictions, such as the United Kingdom, where the National Health Service requires handover of patients within 15 minutes of an ambulance arriving at an ED.18
Proposals for improving ambulance‐to‐ED transfer times include financial penalties for hospitals with longer offload times, algorithms that predict ambulance waiting times and direct ambulances to less crowded hospitals, dedicated offload zones, and offload nursing coordinators.19,20,21 However, these measures have limited benefits and may bring their own problems, such as increased mortality risk for patients with myocardial infarction if their ambulance is diverted.22 As offload times are primarily determined by ED and hospital overcrowding, effective solutions will require increased investment in hospital resources, staffing, and infrastructure, as well as public health education about the appropriate use of emergency ambulance services. System improvements can be expensive, but the estimated mean cost of an ED presentation with chest pain is $5272.23 The potential savings achieved by averting 260 ambulance re‐attendances per year (and the savings for other case types achieved with the same improvements) should be considered in future cost–benefit analyses of ED and ambulance planning.
Limitations
Our population‐based study may not be generalisable to other Australian states. Some ambulance cases (15.2%) could not be linked to hospital admissions (VEMD or VAED data), which may have influenced the sensitivity analysis assessment of diagnosis‐specific mortality rates and the multivariable analysis adjusted for diagnosis. However, our earlier analyses comparing linked and unlinked patients in this dataset found only minor differences between these groups.10 Unmeasured confounders (ie, parameters not included in in the linked dataset) are possible, and the relationship between offload time and outcomes is an association that cannot be assumed to be causal. Associations between ED overcrowding and mortality have been reported;24 as ambulance offload time is an intermediate variable in this causal pathway (Box 1), the degree to which higher mortality is attributable to overcrowding rather than offload delays is unclear. Finally, the number of patients who died in ambulances while awaiting transfer to the ED was not available in our dataset.
Conclusions
In our population‐based study of patients with chest pain transported by ambulance to Victorian EDs, we found that offload time influenced 30‐day mortality and ambulance re‐attendance rates for patients with chest pain. Improving the speed of ambulance‐to‐ED transfers is urgently required.
Box 1 – Directed acyclic graph: influence of ambulance offload delays on 30‐day clinical outcomes for patients*
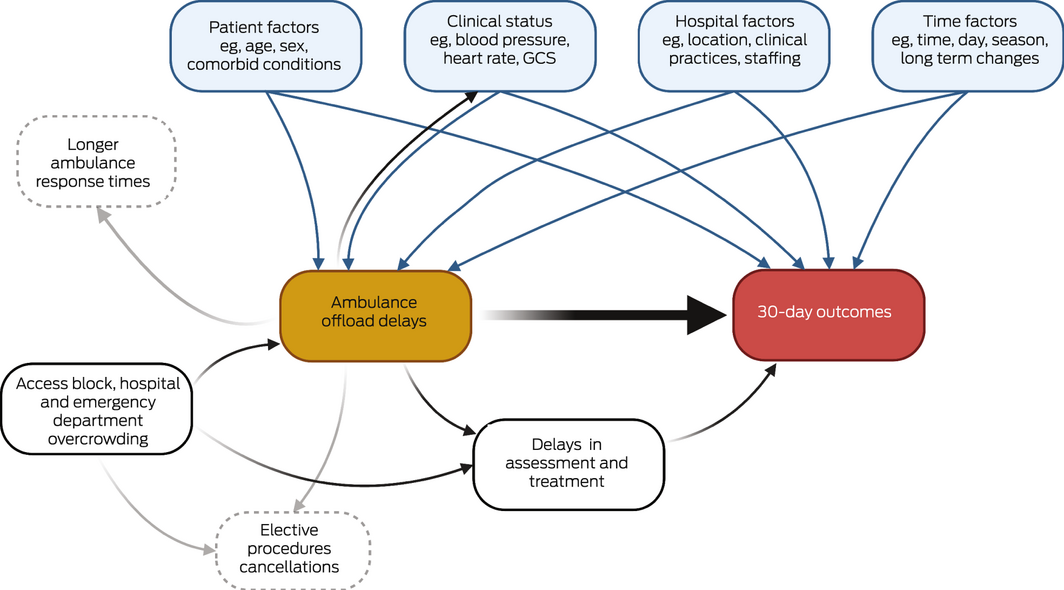
* We based our model on relationships identified in earlier studies2,3,4,5,14,17,24 between various factors, ambulance offload delays, and 30‐day clinical outcomes. The acyclic graph facilitates the selection of potentially confounding variables for multivariable models and the identification of collider variables (in this case, none). Causal pathways reported by previous studies are shown in black if relevant to the association of interest (between ambulance offload delay and 30‐day outcomes), and in grey if not. Biasing or confounding pathways and variables are shown as blue arrows and panels, and were included in our adjusted multivariable models.
Box 2 – Ambulance offload times in Victoria, 1 January 2015 – 30 June 2019: A. Overall distribution.* B. By month and year
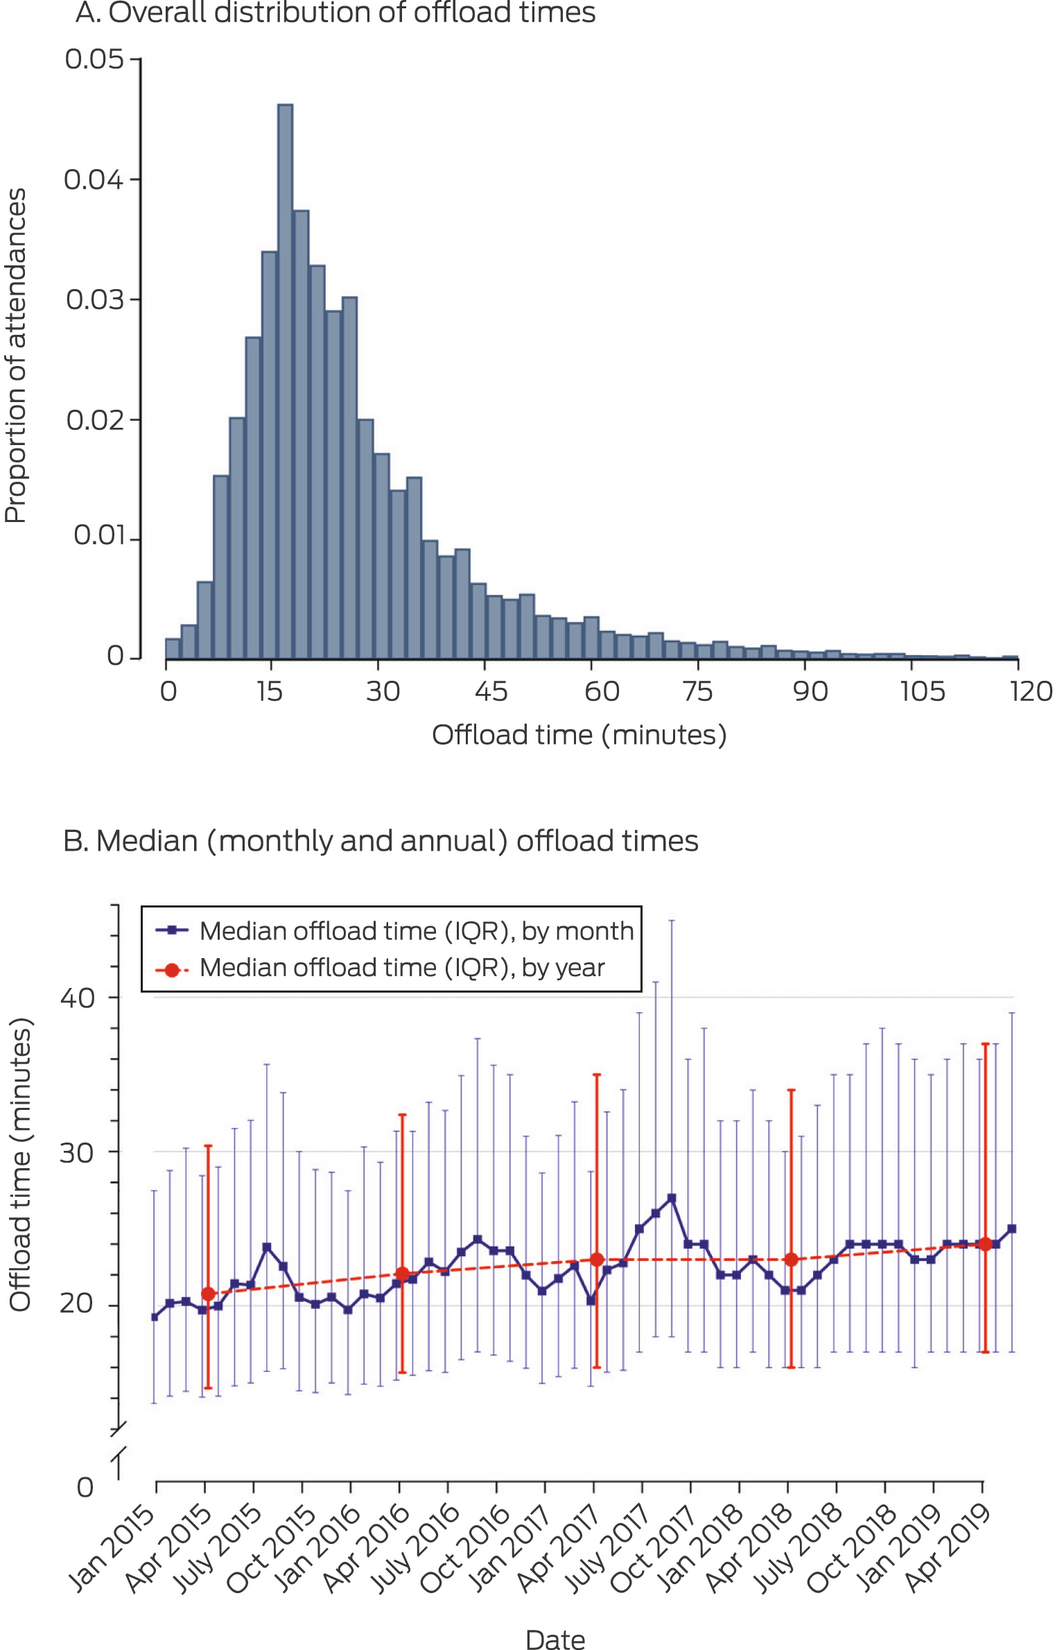
IQR = interquartile range.
* Proportion of 213 544 presentations; graph truncated at 120 minutes because of low numbers by time point (total, 1462 presentations; 0.7% of all presentations).
Box 3 – Patient characteristics, by ambulance offload tertile*
|
|
Ambulance offload time |
||||||||||||||
|
Characteristic |
Tertile 1 |
Tertile 2 |
Tertile 3 |
||||||||||||
|
|
|||||||||||||||
|
Ambulance offload time (min), range |
0–17 |
18–28 |
> 28 |
||||||||||||
|
Number of patients |
69 247 |
73 109 |
71 188 |
||||||||||||
|
Age (years), mean (SD) |
61.6 (18.7) |
62.3 (18.4) |
62.1 (18.5) |
||||||||||||
|
Sex |
|
|
|
||||||||||||
|
Men |
34 706 (50.1%) |
35 530 (48.6%) |
34 118 (47.9%) |
||||||||||||
|
Women |
34 526 (49.9%) |
37 554 (51.4%) |
37 047 (52.1%) |
||||||||||||
|
Ambulance times, median (IQR) |
|
|
|
||||||||||||
|
Offload (arrival to off‐stretcher) |
13 (10–16) |
22 (20–25) |
41 (33–56) |
||||||||||||
|
Arrival to triage |
5 (3–7) |
9 (6–12) |
11 (8–16) |
||||||||||||
|
Triage to off‐stretcher |
7 (5–10) |
14 (10–17) |
30 (21–44) |
||||||||||||
|
Total time (ambulance dispatch to departure) |
89 (74–108) |
101 (86–119) |
118 (101–140) |
||||||||||||
|
Emergency department geographic location11 |
|
|
|
||||||||||||
|
Metropolitan |
40 272 (58.7%) |
57 193 (78.9%) |
58 100 (82.3%) |
||||||||||||
|
Inner regional |
22 238 (32.4%) |
13 353 (18.4%) |
10 901 (15.5%) |
||||||||||||
|
Outer regional/remote/very remote |
6120 (8.9%) |
1981 (2.7%) |
1558 (2.2%) |
||||||||||||
|
Hospital type |
|
|
|
||||||||||||
|
Public |
61 625 (89.6%) |
67 646 (92.7%) |
68 711 (96.6%) |
||||||||||||
|
Private |
7143 (10.4%) |
5306 (7.3%) |
2393 (3.4%) |
||||||||||||
|
Medical history of patient |
|
|
|
||||||||||||
|
Hypertension |
27 616 (42.1%) |
31 464 (45.0%) |
30 696 (44.9%) |
||||||||||||
|
Hyperlipidaemia |
19 310 (29.5%) |
22 835 (32.7%) |
22 700 (33.2%) |
||||||||||||
|
Diabetes mellitus |
12 028 (18.4%) |
14 539 (20.8%) |
14 838 (21.7%) |
||||||||||||
|
Chronic kidney disease |
1610 (2.5%) |
2108 (3.0%) |
2451 (3.6%) |
||||||||||||
|
Prior coronary disease |
22 259 (34.0%) |
24 453 (35.0%) |
23 602 (34.5%) |
||||||||||||
|
Prior stroke |
3697 (5.6%) |
4749 (6.8%) |
4993 (7.3%) |
||||||||||||
|
Peripheral vascular disease |
618 (0.9%) |
814 (1.2%) |
889 (1.3%) |
||||||||||||
|
Chronic obstructive pulmonary disease |
5109 (7.8%) |
6335 (9.1%) |
6381 (9.3%) |
||||||||||||
|
Charlson index score,† mean (SD) |
3.0 (2.2) |
2.9 (2.2) |
3.0 (2.2) |
||||||||||||
|
Clinical status |
|
|
|
||||||||||||
|
Heart rate (beats/min), mean (SD) |
82.6 (18.9) |
82.7 (18.6) |
82.2 (17.9) |
||||||||||||
|
Systolic blood pressure (mmHg), mean (SD) |
131.9 (22.0) |
131.1 (22.1) |
130.6 (21.9) |
||||||||||||
|
Oxygen saturation (%), mean (SD) |
96.9 (3.2) |
96.8 (3.1) |
96.8 (3.1) |
||||||||||||
|
Respiratory rate (breaths/min), mean (SD) |
17.2 (3.5) |
17.4 (3.6) |
17.4 (3.5) |
||||||||||||
|
Fever (≥ 38°C) |
2343 (3.8%) |
2830 (4.2%) |
2967 (4.5%) |
||||||||||||
|
Low Glasgow coma scale score(< 15) |
2042 (3.0%) |
3044 (4.2%) |
3686 (5.2%) |
||||||||||||
|
Pain scores (out of ten): |
|
|
|
||||||||||||
|
0–3 |
54 678 (81.7%) |
56 749 (80.4%) |
55 915 (81.5%) |
||||||||||||
|
4–7 |
10 656 (15.9%) |
12 033 (17.1%) |
10 934 (15.9%) |
||||||||||||
|
8–10 |
1604 (2.4%) |
1776 (2.5%) |
1729 (2.5%) |
||||||||||||
|
Year of presentation |
|
|
|
||||||||||||
|
2015 |
16 795 (38.9%) |
14 316 (33.1%) |
12 121 (28.0%) |
||||||||||||
|
2016 |
14 933 (34.0%) |
15 052 (34.3%) |
13 917 (31.7%) |
||||||||||||
|
2017 |
14 559 (30.6%) |
16 220 (34.1%) |
16 837 (35.3%) |
||||||||||||
|
2018 |
15 375 (30.1%) |
18 067 (35.3%) |
17 731 (34.6%) |
||||||||||||
|
2019 (January – June) |
7585 (27.5%) |
9454 (34.2%) |
10 582 (38.3%) |
||||||||||||
|
|
|||||||||||||||
|
IQR = interquartile range, SD = standard deviation. * Denominators for proportions are numbers of patients with available data for the variable; rates of missing data were lower than 5% for all variables, except temperature (8.9%) (Supporting Information, table 2). † Parameters available in the study data set: age, prior myocardial infarction, peripheral vascular disease, prior stroke, chronic obstructive pulmonary disease, chronic kidney disease, and diabetes mellitus. |
|||||||||||||||
Box 4 – Outcomes by ambulance offload tertile
|
|
Ambulance offload time |
||||||||||||||
|
Outcome |
Tertile 1 |
Tertile 2 |
Tertile 3 |
||||||||||||
|
|
|||||||||||||||
|
30‐day mortality |
|
|
|
||||||||||||
|
Deaths/patients |
854/69 247 |
1001/73 109 |
1060/71 188 |
||||||||||||
|
Unadjusted rate |
1.23% |
1.37% |
1.49% |
||||||||||||
|
Risk difference (percentage points) (95% CI) |
Reference |
0.14 (0.02–0.25) |
0.26 (0.13–0.38) |
||||||||||||
|
Adjusted rate* |
1.29% |
1.42% |
1.57% |
||||||||||||
|
Risk difference (percentage points) (95% CI) |
Reference |
0.13 (0.02–0.26) |
0.28 (0.16–0.42) |
||||||||||||
|
Number needed to harm† |
— |
769 |
357 |
||||||||||||
|
30‐day re‐attendances |
|
|
|
||||||||||||
|
Re‐attendances/patients |
5946/69 247 |
6964/73 109 |
7040/71 188 |
||||||||||||
|
Unadjusted rate |
8.59% |
9.53% |
9.89% |
||||||||||||
|
Risk difference (percentage points) (95% CI) |
Reference |
0.94 (0.64–1.24) |
1.30 (1.00–1.61) |
||||||||||||
|
Adjusted rate* |
8.15% |
8.57% |
9.03% |
||||||||||||
|
Risk difference (percentage points) (95% CI) |
Reference |
0.42 (0.13–0.71) |
0.87 (0.57–1.18) |
||||||||||||
|
Number needed to harm† |
— |
238 |
115 |
||||||||||||
|
|
|||||||||||||||
|
* Determined using the full dataset with multiple imputation (213 544 patients) and a multilevel logistic regression model with age, sex, comorbid conditions, clinical status, time of presentation, day of the week, season, year, and receiving hospital bed numbers as fixed effects, and hospital facility as a random effect to account for clustering. † Estimated number of patients treated in offload tertiles 2 or 3 that would result in one extra event (death or re‐attendance) within 30 days, compared with patients with tertile 1 offload times. |
|||||||||||||||
Box 5 – Thirty‐day mortality, by ambulance offload time as a continuous variable, with 95% confidence range (pale red)
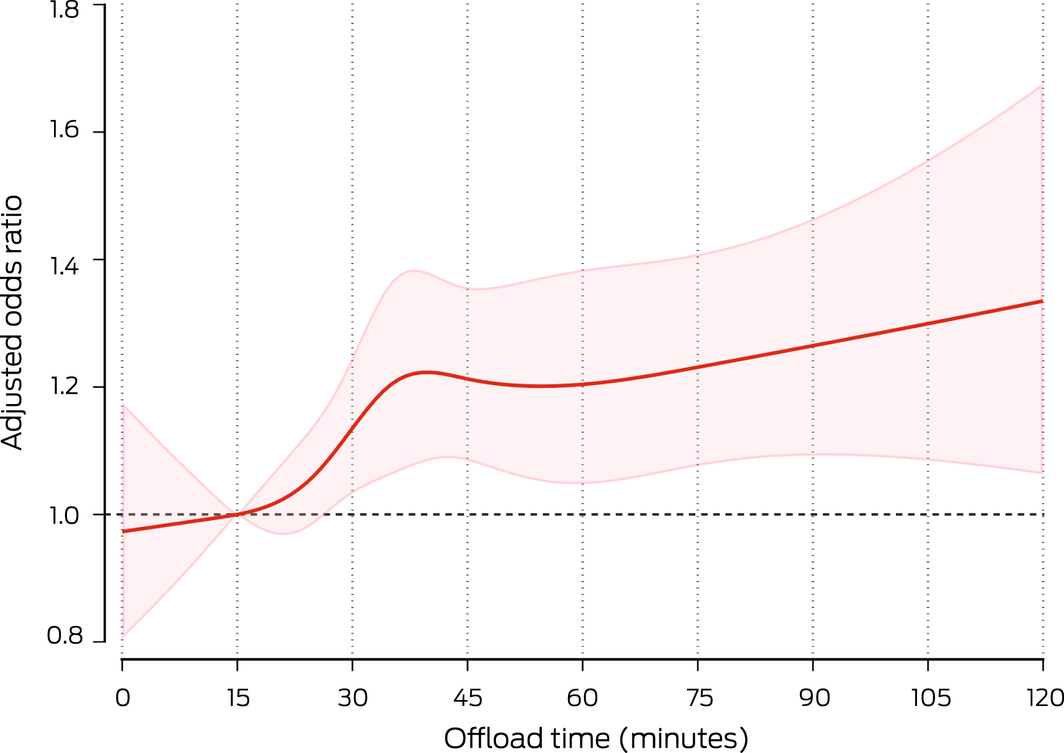
Restricted cubic splines with a complete case analysis (N = 192 791) for the relationship between offload time and the odds ratio of 30‐day mortality (reference: 15 minutes), adjusted for age, sex, comorbid conditions, clinical observations (except fever), day of the week, season, year, time of presentation (in‐ or out‐of‐hours), and hospital bed number category, and hospital included as a random effect to account for clustering. Adjusted 30‐day mortality at 15 minutes (reference) was 1.31%.
Received 25 October 2021, accepted 14 March 2022
- Luke P Dawson1,2,3
- Emily Andrew2,4
- Michael Stephenson2,5
- Ziad Nehme2,5
- Jason Bloom2,3
- Shelley Cox4
- David Anderson3,5
- Jeffrey Lefkovits1,2
- Andrew J Taylor2,3
- David Kaye3,6
- Karen Smith4,5
- Dion Stub2,3
- 1 Royal Melbourne Hospital, Melbourne, VIC
- 2 Centre for Research and Evaluation, Ambulance Victoria, Melbourne, VIC
- 3 Monash University, Melbourne, VIC
- 4 Ambulance Victoria, Melbourne, VIC
- 5 Alfred Health, Melbourne, VIC
- 6 Baker Heart Research Institute (BHRI), Melbourne, VIC
Open Access
Open access publishing facilitated by Monash University, as part of the Wiley – Monash University agreement via the Council of Australian University Librarians.
The study was supported by Ambulance Victoria and the Alfred Health Department of Cardiology. We acknowledge the Victorian Department of Health as the source of Victorian Emergency Minimum Dataset and Victorian Admitted Episodes Dataset data, the Victorian Department of Justice and Community Safety as the source of Victorian Death Index data, and the Centre for Victorian Data Linkage (Victorian Department of Health) for providing data linkage.
Luke Dawson is supported by National Health and Medical Research Council (NHMRC) and National Heart Foundation (NHF) postgraduate scholarships. Emily Andrew is supported by an NHMRC postgraduate scholarship, Jason Bloom by NHMRC and NHF postgraduate scholarships, Ziad Nehme by an NHMRC early career fellowship, Dion Stub by NHF grants, and Andrew Taylor by an NHMRC Investigator grant.
No relevant disclosures.
- 1. House J. What’s causing England’s A&E crisis? Lancet 2013; 382: 195‐196.
- 2. Kingswell C, Shaban RZ, Crilly J. Concepts, antecedents and consequences of ambulance ramping in the emergency department: a scoping review. Australas Emerg Nurs J 2017; 20: 153‐160.
- 3. Li M, Vanberkel P, Carter AJE. A review on ambulance offload delay literature. Health Care Manag Sci 2019; 22: 658‐675.
- 4. Crilly J, Keijzers G, Tippett V, et al. Improved outcomes for emergency department patients whose ambulance off‐stretcher time is not delayed. Emerg Med Australas 2015; 27: 216‐224.
- 5. Stewart D, Lang E, Wang D, Innes G. Are emergency medical services offload delay patients at increased risk of adverse outcomes? CJEM 2019; 21: 505‐512.
- 6. Dawson LP, Andrew E, Nehme Z, et al. Incidence, diagnoses and outcomes of ambulance attendances for chest pain: a population‐based cohort study. Ann Epidemiol 2022;72: 32‐39.
- 7. Scholz KH, Maier SKG, Maier LS, et al. Impact of treatment delay on mortality in ST‐segment elevation myocardial infarction (STEMI) patients presenting with and without haemodynamic instability: results from the German prospective, multicentre FITT‐STEMI trial. Eur Heart J 2018; 39: 1065‐1074.
- 8. Seymour CW, Gesten F, Prescott HC, et al. Time to treatment and mortality during mandated emergency care for sepsis. N Engl J Med 2017; 376: 2235‐2244.
- 9. Deharo P, Ducrocq G, Bode C, et al. Timing of angiography and outcomes in high‐risk patients with non‐ST‐segment‐elevation myocardial infarction managed invasively: insights from the TAO trial (Treatment of Acute Coronary Syndrome with Otamixaban). Circulation 2017; 136: 1895‐1907.
- 10. Andrew E, Cox S, Smith K. Linking ambulance records with hospital and death index data to evaluate patient outcomes. Int J Gen Med 2022; 15: 567‐572.
- 11. Australian Bureau of Statistics. Statistical geography, volume 1: Australian Standard Geographical Classification (ASGC). July 2006. https://www.ausstats.abs.gov.au/ausstats/subscriber.nsf/0/3E15ACB95DA01A65CA2571AA0018369F/$File/12160_2006.pdf (viewed June 2022).
- 12. Lederer DJ, Bell SC, Branson RD, et al. Control of confounding and reporting of results in causal inference studies. guidance for authors from editors of respiratory, sleep, and critical care journals. Ann Am Thorac Soc 2019; 16: 22‐28.
- 13. Rubin DB. Multiple imputation for nonresponse in surveys. New York: Wiley, 1987.
- 14. Cooney DR, Millin MG, Carter A, et al. Ambulance diversion and emergency department offload delay: resource document for the National Association of EMS Physicians position statement. Prehosp Emerg Care 2011; 15: 555‐561.
- 15. Australian Broadcasting Corporation. Third patient dies this year after ramping outside of Adelaide hospital. ABC News (Australia). Updated 19 Nov 2019. https://www.abc.net.au/news/2019‐11‐18/adelaide‐hospital‐ramping‐third‐patient‐dies/11712776 (viewed Oct 2021).
- 16. Yafasova A, Fosbøl EL, Johnsen SP, et al. Time to thrombolysis and long‐term outcomes in patients with acute ischemic stroke: a nationwide study. Stroke 2021; 52: 1724‐1732.
- 17. Kim DU, Park YS, Park JM, et al. Influence of overcrowding in the emergency department on return visit within 72 hours. J Clin Med 2020; 9: 1406.
- 18. National Health Services England. Transformation of urgent and emergency care: models of care and measurement (PAR122). Dec 2020. https://www.england.nhs.uk/wp‐content/uploads/2020/12/transformation‐of‐urgent‐and‐emergency‐care‐models‐of‐care‐and‐measurement.pdf (viewed May 2022).
- 19. Carter AJ, Gould JB, Vanberkel P, et al. Offload zones to mitigate emergency medical services (EMS) offload delay in the emergency department: a process map and hazard analysis. CJEM 2015; 17: 670‐678.
- 20. Crilly J, Johnston AN, Wallis M, et al. 2.6. Emerg Med Australas 2020; 32: 271‐280.
- 21. Walker KJ, Jiarpakdee J, Loupis A, et al; Australasian College for Emergency Medicine Clinical Trials Network. Predicting ambulance patient wait times: a multicenter derivation and validation study. Ann Emerg Med 2021; 78: 113‐122.
- 22. Shen YC, Hsia RY. Association between ambulance diversion and survival among patients with acute myocardial infarction. JAMA 2011; 305: 2440‐2447.
- 23. Cullen L, Greenslade J, Merollini K, et al. Cost and outcomes of assessing patients with chest pain in an Australian emergency department. Med J Aust 2015; 202: 427‐432. https://www.mja.com.au/journal/2015/202/8/cost‐and‐outcomes‐assessing‐patients‐chest‐pain‐australian‐emergency‐department
- 24. Berg LM, Ehrenberg A, Florin J, et al. Associations between crowding and ten‐day mortality among patients allocated lower triage acuity levels without need of acute hospital care on departure from the emergency department. Ann Emerg Med 2019; 74: 345‐356.
Abstract
Objective: To assess whether ambulance offload time influences the risks of death or ambulance re‐attendance within 30 days of initial emergency department (ED) presentations by adults with non‐traumatic chest pain.
Design, setting: Population‐based observational cohort study of consecutive presentations by adults with non‐traumatic chest pain transported by ambulance to Victorian EDs, 1 January 2015 – 30 June 2019.
Participants: Adults (18 years or older) with non‐traumatic chest pain, excluding patients with ST elevation myocardial infarction (pre‐hospital electrocardiography) and those who were transferred between hospitals or not transported to hospital (eg, cardiac arrest or death prior to transport).
Main outcome measures: Primary outcome: 30‐day all‐cause mortality (Victorian Death Index data). Secondary outcome: Transport by ambulance with chest pain to ED within 30 days of initial ED presentation.
Results: We included 213 544 people with chest pain transported by ambulance to EDs (mean age, 62 [SD, 18] years; 109 027 women [51%]). The median offload time increased from 21 (IQR, 15–30) minutes in 2015 to 24 (IQR, 17–37) minutes during the first half of 2019. Three offload time tertiles were defined to include approximately equal patient numbers: tertile 1 (0–17 minutes), tertile 2 (18–28 minutes), and tertile 3 (more than 28 minutes). In multivariable models, 30‐day risk of death was greater for patients in tertile 3 than those in tertile 1 (adjusted rates, 1.57% v 1.29%; adjusted risk difference, 0.28 [95% CI, 0.16–0.42] percentage points), as was that of a second ambulance attendance with chest pain (adjusted rates, 9.03% v 8.15%; adjusted risk difference, 0.87 [95% CI, 0.57–1.18] percentage points).
Conclusions: Longer ambulance offload times are associated with greater 30‐day risks of death and ambulance re‐attendance for people presenting to EDs with chest pain. Improving the speed of ambulance‐to‐ED transfers is urgently required.