


The known: The prevalence of ABO RhD blood groups published on the Australian Red Cross Lifeblood website is based on data for first‐time blood donors during 1993‒94. More recent national data have not been reported.
The new: The distribution of blood groups has changed since 1993‒94, reflecting changes in the demographic characteristics of the Australian population. In particular, the proportion of RhD‐positive first‐time blood donors has increased from 81% to 83.8%.
The implications: Our findings can support supply planning of blood and blood products, and also highlight the challenge of meeting the increasing demand for RhD‐negative red blood cells.
Australian Red Cross Lifeblood is the national supplier of fresh blood and blood products to the Australian community, produced from voluntary, non‐remunerated blood donations. In Australia, as elsewhere, overall demand for red blood cells (RBCs) has declined over the past ten years, but the demand for universal RBC units — ie, from group O RhD‐negative (RhD–) donors — has increased.1,2 To ensure an adequate supply of O RhD– RBC units, Lifeblood dedicates resources to recruiting and retaining O RhD– donors.
The only available data on ABO RhD blood group prevalence in Australia are based on information for first‐time blood donors during 1993–94.3 The demographic characteristics of Australia have changed substantially in the meantime, the population having increased by 7.5 million people to 2019,4 including three million migrants, predominantly from South East Asia, India, and China.5 Understanding migration patterns is important for blood collection planning, as the distribution of ABO RhD blood groups differs between ethnic groups.6,7 As recent national data on ABO RhD blood group prevalence in Australia are not available, it is unknown whether supply for high demand blood and blood products can be sustained.
The most recent information on ABO RhD blood group prevalence was collected in the Northern Territory and Western Australia to support clinical care for Indigenous Australians.8,9 However, data for these two jurisdictions cannot be generalised to all parts of Australia. National data are needed to provide accurate information for planning the supply of blood and blood products, to reduce clinical waste, and to ensure blood collection patterns match community demand.
We aimed to determine the distribution of ABO RhD blood groups in Australia. We analysed Lifeblood information for blood donors, but these data are biased by disproportionally high collection from certain donors to meet clinical demand for specific blood groups, such as group O RhD– for RBC units and group AB blood for plasma. We therefore also assessed blood group data provided by national pathology agencies.
Methods
We undertook our study during 1 January – 31 December 2019. The Lifeblood national transfusion scientific team contacted 41 pathology agencies (representing 324 health providers approved by the National Blood Authority to receive blood and blood products from Lifeblood) by email, using internal communications distribution lists. The pathology agencies covered all approved health providers in metropolitan, regional, and rural areas in all eight states and territories of Australia.
Participating agencies provided ABO RhD blood group data for all patients during 2019 for whom pathology analysis included blood typing. We did not collect information about the blood typing methods and equipment used by individual services. Patient age, sex assigned at birth, and residential postcode could also be supplied, but these details were optional. We specifically requested that duplicate results for patients be removed, but we could not check duplicate removal because the final datasets were de‐identified. Data were forwarded to the investigators by email to a secure centralised inbox.
ABO RhD blood group data for blood donors were extracted from the Lifeblood National Blood Donor Management System. To avoid duplicates, we included only the first blood group result recorded for each donor during 2019. Forward and reverse ABO group and RhD status of blood donors were determined at Lifeblood using an NEO analyser (Immucor) and standard operating procedures. Blood and blood product demand data were extracted from the Lifeblood data warehouse, Corporate Information Management and Reporting.
The remoteness of patient and donor residential postcodes was categorised using the Modified Monash Model as defined by the Australian Department of Health.10,11 Age data for blood donors and patients were grouped by decade (10–19, 20–29, 30–39, 40–49, 50–59, 60–69, 70–79, 80 or more years). People under the age of 18 years cannot donate blood in Australia, nor can those over 75 years become first‐time donors, but there are no age restrictions for current blood donors who fulfil the standard selection criteria.
Statistical analyses were performed in SPSS 23 (IBM) and GraphPad Prism 8.4.3. We summarise data as numbers and frequencies. The statistical significance of differences in blood type distribution was assessed in χ2 tests; P < 0.05 was deemed statistically significant.
Ethics approval
Our study was approved by the Australian Red Cross Lifeblood Human Research Ethics Committee (Hirani 20022020) and under the National Mutual Acceptance process with the Hunter New England Human Research Ethics Committee as the lead committee (2020/ETH01734). The study complied with the National Health and Medical Research Council National Statement on Ethical Conduct in Human Research (updated 2018).12
Results
A total of 1 318 751 ABO RhD data points for valid pathology blood group results during 2019 were available, reported by 28 of 41 invited pathology agencies, including 245 of 324 approved health providers (76%). Valid ABO RhD data were available for 490 491 blood donors, including 103 798 first‐time blood donors (21.2%).
ABO RhD groups: overall distribution and distribution by state
The distribution of ABO RhD groups of people whose blood groups were determined by the participating pathology agencies during 2019 was 6.5% for O RhD–, 11.8% for B RhD+, and 3.7% for AB RhD+; for first‐time blood donors it was 8.7% for O RhD–, 12.4% for B RhD+, and 3.9% for AB RhD+ (Box 1). A total of 85.9% of patients and 83.8% of first‐time blood donors were RhD+ (Box 2). The influence of remoteness of residence on ABO RhD distribution was not statistically significant for patients, blood donors, or first‐time blood donors (online Supporting Information, table 1).
The proportion of patients blood‐typed by pathology services who were RhD+ was slightly larger in the Northern Territory (89.4%) and slightly smaller in Tasmania (83.2%) than the national proportion (85.9%) (Box 2). However, the distributions of ABO RhD groups for patients, blood donors, first‐time donors did not differ significantly by state (Supporting Information, table 2).
ABO RhD groups: by age and sex
Of the people whose blood groups were determined at the participating pathology agencies during 2019, 876 245 were women (66.4%), 343 887 were men (26.1%), and sex was unknown or unspecified for 98 619 (7.5%). Among blood donors, 249 892 were women (50.9%) and 240 602 were men (49.1%); among first‐time blood donors, 57 797 were women (55.7%) and 46 001 were men (44.3%). ABO RhD prevalence was not influenced by sex in any of the three sample groups (each: P > 0.99) (Box 3).
Age did not significantly influence ABO RhD prevalence among patients, blood donors, or first‐time donors (Supporting Information, table 3).
Blood product demand
The proportion of B RhD+ RBC units issued declined from 7.7% in 2010–11 to 6.0% of all RBC units in 2019–20, and that of AB RhD+ RBC units from 2.1% to 0.9%. The proportion of O RhD– RBC units issued increased from 11.7% to 17.4%. The proportions for other ABO groups declined slightly or did not change (Box 4; Supporting Information, table 4).
Discussion
We report the first recent national study of the distribution of ABO RhD groups in Australia, based on data for more than 1.3 million people who underwent blood pathology testing and about half a million blood donors in 2019.
Prior to our study, the only national information on Australian ABO RhD blood group prevalence was based on data for first‐time blood donors during 1993–94, and was available only on the Lifeblood website.3 However, using blood donor data to determine blood group prevalence is subject to selection bias because clinical demand for certain ABO RhD blood groups (O RhD– RBC units, group AB blood for plasma) is relatively high and donors with these blood groups are often preferentially recruited. Further, the demographic characteristics of Australia have changed markedly during the past 30 years, following extensive immigration, particularly from South East Asia, India and China,5 where the prevalence of the B and AB blood groups is generally higher.5,6,7 Demand for RhD– blood products remained consistently high during 2010–20. The impact of migration on the supply of specific ABO RhD blood group types is important for blood collection planning.
The proportion of first‐time blood donors who were RhD+ was about three percentage points larger in 2019 than in 1993–94 (83.8% v 81%). The proportion of patients with RhD+ blood was largest in the Northern Territory, probably because RhD+ is more prevalent among Indigenous people than among other Australians.8 In 2019, the national proportions of first‐time blood donors with groups B RhD+ (12.4% v 9.3% ) or AB RhD+ (3.9% v 2.9%) were larger than for all 2019 blood donors. These findings suggest that the proportion of RhD+ blood group donations is increasing at the expense of RhD– RBC units. Finally, as 85.9% of patients blood‐typed by pathology services during 2019 were RhD+, diversifying blood holdings to encompass more RhD+ stock would be adequate for meeting clinical requirements.
In 2019, the proportion of blood donors who were RhD– was larger (20.5%) than that of people blood‐typed by pathology services (14.1%). Lifeblood actively recruits people with group O RhD– blood to meet the clinical demand for RBC units. But only 16.2% of first‐time blood donors in 2019 were RhD–, suggesting that it may be increasingly challenging to recruit new RhD– donors.
The proportion of O RhD– RBC units issued increased during 2010–20, and those of B RhD+ and AB RhD+ RBC units declined. This indicates substantial reliance by transfusion practitioners on RhD– RBC units, but our findings could encourage consideration of RhD+ options for some purposes.13 Among the reasons for the current reliance on RhD– RBC units is the fact that stocking O RhD– RBC units simplifies blood inventory management, particularly in regional and rural areas with limited staff numbers.1 However, there is increasing evidence that using O RhD– RBC units instead of group‐specific RBC units may not always be appropriate, as cross‐group transfusions can have unwanted ramifications, including production of antibodies to other clinically significant blood group systems, making blood provision even more challenging.14,15,16 Our findings and other information could encourage transfusion laboratories and practitioners to stock and transfuse more closely matched ABO RhD RBC units.
The distribution of ABO RhD blood groups did not differ by sex or age group. More pathology data were available for women than for men, at least partially because of routine ABO RhD typing and antibody screening during pregnancy. The proportion of first‐time blood donors aged 18 or 19 years who were RhD+ was slightly larger in 2019 than for other age groups; this may reflect changes in the diversity of blood donors.
Limitations
Not all pathology agencies provided data for our study, and some regional and rural areas and parts of larger cities may consequently not be well represented. We assumed that all patient data points were for unique persons, but if people attended more than one site they may have several medical record numbers, leading to duplication. We had no information about the ethnic backgrounds of patients or blood donors. As inferences based on residential postcode or self‐reported ethnic background would be unreliable, and there are no standard definitions in Australia for people with mixed backgrounds, we did not analyse blood groups by ethnic background. The data for people with pathology service blood typing results did not include all people who used blood pathology services, and our findings for this group may not be generalisable to the entire community. Finally, the first‐time donor data for 1993–94 were very limited in scope, and could not be used for comparisons by age or sex.
Conclusion
Our national study is the first recent assessment of the prevalence of ABO RhD blood groups among blood donors and people in Australia whose blood type was determined by pathology services. Our findings could support future planning for blood and blood product requirements in Australia, and can be used for evidence‐based forecasting of supply. Our findings also indicate the challenges of meeting the increasing demand for RhD– RBC units, as the proportion of RhD– first‐time blood donors has declined with the changing demographic characteristics of Australia.
Box 1 – ABO RhD distribution for patients undergoing blood pathology testing and blood donors, Australia, 2019
|
ABO RhD group |
2019 |
1993–94* |
|||||||||||||
|
|
All blood donors |
First‐time blood donors |
First‐time blood donors |
||||||||||||
|
|
|||||||||||||||
|
O RhD+ |
505 852 (38.4%) |
186 072 (37.9%) |
39 286 (37.8%) |
40% |
|||||||||||
|
O RhD– |
85 384 (6.5%) |
58 646 (12.0%) |
9060 (8.7%) |
9% |
|||||||||||
|
A RhD+ |
422 160 (32.0%) |
144 339 (29.4%) |
30 732 (29.6%) |
31% |
|||||||||||
|
A RhD– |
73 242 (5.6%) |
30 776 (6.3%) |
5525 (5.3%) |
7% |
|||||||||||
|
B RhD+ |
155 578 (11.8%) |
45 379 (9.3%) |
12 918 (12.4%) |
8% |
|||||||||||
|
B RhD– |
20 462 (1.5%) |
8251 (1.7%) |
1613 (1.6%) |
2% |
|||||||||||
|
AB RhD+ |
48 848 (3.7%) |
14 225 (2.9%) |
4087 (3.9%) |
2% |
|||||||||||
|
AB RhD– |
7225 (0.5%) |
2803 (0.6%) |
577 (0.6%) |
1% |
|||||||||||
|
Total number |
1 318 751 |
490 491 |
103 798 |
|
|||||||||||
|
|
|||||||||||||||
|
* 1993–94 distribution3 included for comparison. |
|||||||||||||||
Box 2 – ABO RhD distribution for patients undergoing blood pathology testing and blood donors, Australia, 2019, by state and territory*
|
RhD status |
New South Wales |
Victoria |
Queensland |
South Australia |
Western Australia |
Tasmania |
Northern Territory |
Australian Capital Territory |
Australia |
||||||
|
|
|||||||||||||||
|
First‐time blood donors (1993–94)† |
|
|
|
|
|
|
|
|
|
||||||
|
RhD+ |
— |
— |
— |
— |
— |
— |
— |
— |
81% |
||||||
|
RhD– |
— |
— |
— |
— |
— |
— |
— |
— |
19% |
||||||
|
Patients (pathology samples) (2019) |
|
|
|
|
|
|
|
|
|
||||||
|
RhD+ |
499 235 (86.4%) |
181 158 |
218 211 |
95 394 |
84 826 |
22 316 |
9711 |
21 587 |
1 132 438 |
||||||
|
RhD– |
78 395 (13.6%) |
28 092 |
38 866 |
17 054 |
14 670 |
4517 |
1142 |
3577 |
186 313 |
||||||
|
Total |
577 630 |
209 250 |
257 077 |
112 448 |
99 496 |
26 833 |
10 853 |
25 164 |
1 318 751 |
||||||
|
Blood donors (2019) |
|
|
|
|
|
|
|
|
|
||||||
|
RhD+ |
114 370 |
105 831 |
75 933 |
30 479 |
35 368 |
12 473 |
2748 |
12 675 |
389 877 |
||||||
|
RhD– |
28 190 |
26 819 |
20 067 |
8642 |
9382 |
3650 |
734 |
2969 |
100 453 |
||||||
|
Total |
142 560 |
132 650 |
96 000 |
39121 |
44 750 |
16 123 |
3482 |
15 644 |
490 330 |
||||||
|
First‐time blood donors (2019) |
|
|
|
|
|
|
|
|
|
||||||
|
RhD+ |
25 512 |
25 018 |
16 676 |
5834 |
8174 |
2542 |
586 |
2645 |
86 987 |
||||||
|
RhD– |
4588 |
4641 |
3418 |
1228 |
1707 |
606 |
110 |
474 |
16 772 |
||||||
|
Total |
30 100 |
29 659 |
20 094 |
7062 |
9881 |
3148 |
696 |
3119 |
103 759 |
||||||
|
|
|||||||||||||||
|
* Excludes missing location data for 161 blood donors and 39 first‐time blood donors. † 1993–94 national distribution3 included for comparison; state‐based information not available. |
|||||||||||||||
Box 3 – ABO RhD distribution for patients undergoing blood pathology testing and blood donors, Australia, 2019, by sex
|
ABO RhD group |
Patients (pathology samples)* |
All blood donors |
First‐time blood donors |
||||||||||||
|
Men |
Women |
Men |
Women |
Men |
Women |
||||||||||
|
|
|||||||||||||||
|
O RhD+ |
132 965 (38.7%) |
335 274 (38.3%) |
92 362 (38.4%) |
93 710 (37.5%) |
17 552 (38.2%) |
21 734 (37.6%) |
|||||||||
|
O RhD– |
23 880 (6.9%) |
54 783 (6.3%) |
25 960 (10.8%) |
32 686 (13.1%) |
3283 (7.1%) |
5777 (10.0%) |
|||||||||
|
A RhD+ |
111 871 (32.5%) |
278 061 (31.7%) |
71 000 (29.5%) |
73 339 (29.3%) |
13 575 (29.5%) |
17 157 (29.7%) |
|||||||||
|
A RhD– |
20 637 (6.0%) |
46 936 (5.4%) |
14 503 (6.0%) |
16 273 (6.5%) |
2269 (4.9%) |
3256 (5.6%) |
|||||||||
|
B RhD+ |
35 592 (10.3%) |
109 261 (12.5%) |
23 445 (9.7%) |
21 934 (8.8%) |
6428 (14.0%) |
6490 (11.2%) |
|||||||||
|
B RhD– |
5311 (1.5%) |
13 656 (1.6%) |
4075 (1.7%) |
4176 (1.7%) |
719 (1.6%) |
894 (1.5%) |
|||||||||
|
AB RhD+ |
11 660 (3.4%) |
33 598 (3.8%) |
7769 (3.2%) |
6456 (2.6%) |
1923 (4.2%) |
2164 (3.7%) |
|||||||||
|
AB RhD– |
1971 (0.6%) |
4676 (0.5%) |
1486 (0.6%) |
1317 (0.5%) |
252 (0.5%) |
325 (0.6%) |
|||||||||
|
Total |
343 887 (28.1%) |
876 245 (71.8%) |
240 600 (49.1%) |
249 891 (50.9%) |
46 001 (44.3%) |
57 797 (55.7%) |
|||||||||
|
|
|||||||||||||||
|
* Excludes missing data for 98 619 patients. |
|||||||||||||||
Box 4 – Demand for red blood cell (RBC) units, 2010–11* to 2019–20, by ABO RhD blood group
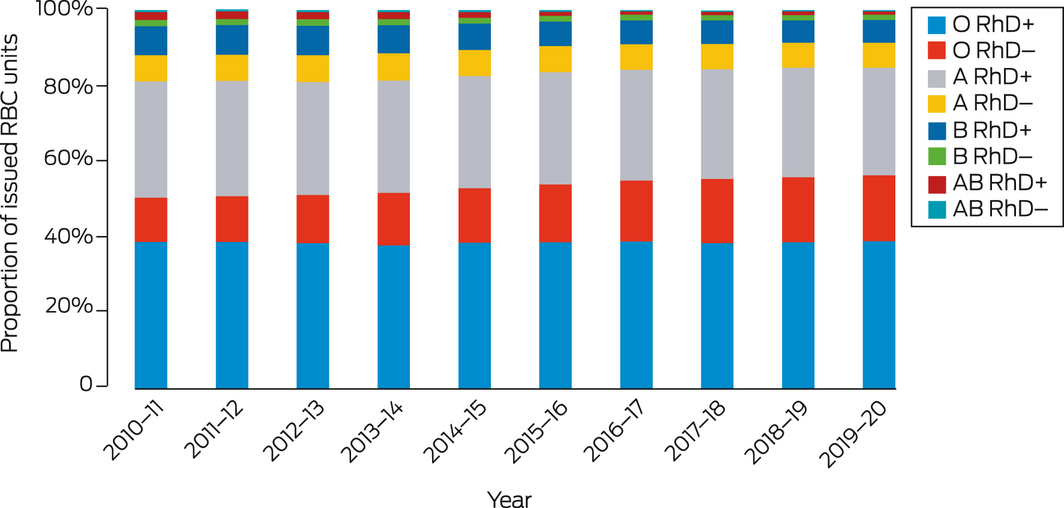
* Data available only for February–June 2011. The numbers of RBC units issued are provided in the online Supporting Information, table 4.
Received 16 September 2021, accepted 22 November 2021
- Rena Hirani1
- Natalie Weinert1
- David O Irving1
- Australian Red Cross Lifeblood (New South Wales and Australian Capital Territory), Sydney, NSW
Australian governments fund Australian Red Cross Lifeblood to provide blood, blood products, and services to the Australian community. We thank Australian blood donors who give their time and support to provide blood and blood products for the community and to enable research. We thank the pathology agencies and approved health providers who provided patient data: Abbott Pathology, Australian Clinical Labs, PathWest, Alfred Pathology, Territory Pathology, NSW Health Pathology, Pathology Queensland, Barratt and Smith Pathology, ACT Pathology, Capital Pathology, Monash Pathology, Clinpath Laboratories, Clinipath Pathology, Douglas Hanly Moir Pathology, SA Pathology, Hobart Pathology, Launceston General Hospital Pathology, Launceston Pathology, Mater Pathology, Melbourne Pathology, St Vincent's Pathology, North West Pathology, Northern Pathology, Women's and Children's Pathology, Royal Hobart Hospital Pathology, Melbourne Health Pathology, Sullivan Nicolaides Pathology, The Children's Hospital Westmead, and Southern IML Pathology. We also thank Perfecto Diaz for blood donor data analysis support, and the transfusion scientist team at Lifeblood: Liz Lennox, Francesca Hulme, Natalie Caldwell, and Sarah Kowalski.
No relevant disclosures.
- 1. Hirani R, Wong J, Diaz P, et al. A national review of the clinical use of group O D– red blood cell units. Transfusion 2017; 57: 1254–1261.
- 2. Hirani R, Wong J, Mondy P, et al. Region specific analysis for the use of “universal” donor group O D− red blood cell units within Australia. ISBT Science Series 2018; 13: 171–179.
- 3. Australian Red Cross Lifeblood. What should I donate? 2021. https://www.lifeblood.com.au/blood/making‐your‐donation/should‐i‐donate‐blood‐or‐plasma (viewed Sept 2021).
- 4. Australian Bureau of Statistics. National, state and territory population. Updated June 2021. https://www.abs.gov.au/statistics/people/population/national‐state‐and‐territory‐population (viewed Sept 2021).
- 5. Australian Bureau of Statistics. Migration, Australia. 23 Apr 2021. https://www.abs.gov.au/statistics/people/population/migration‐australia/2019‐20 (viewed Sept 2021).
- 6. Weinstock C. It is worthwhile filling in the remaining blank spots for blood group antigen frequencies. Blood Transfus 2014; 12: 3–6.
- 7. Mourant AE, Kopeć AC, Domaniewska‐Sobczak K. The distribution of the human blood groups and other polymorphisms; volume 2. London: Oxford University Press, 1976.
- 8. McLean A, Szabo F, Wang Z. ABO and Rhesus D blood groups in the Northern Territory of Australia. Intern Med J 2021; 51: 1485–1489.
- 9. Schoeman EM, Roulis EV, Perry MA, et al. Comprehensive blood group antigen profile predictions for Western Desert Indigenous Australians from whole exome sequence data. Transfusion 2019; 59: 768–778.
- 10. Australian Department of Health. Modified Monash Model (MMM) suburb and locality classification: Home Care Subsidy. July 2019. https://www.health.gov.au/resources/publications/modified‐monash‐model‐mmm‐suburb‐and‐locality‐classification‐home‐care‐subsidy (viewed Nov 2021).
- 11. Australian Department of Health. Modified Monash Model. July 2021. https://www.health.gov.au/health‐topics/health‐workforce/health‐workforce‐classifications/modified‐monash‐model (viewed Nov 2021).
- 12. National Health and Medical Research Council; Australian Research Council; Universities Australia. National statement on ethical conduct in human research (NHMRC publication E72). Updated 2018. https://www.nhmrc.gov.au/about‐us/publications/national‐statement‐ethical‐conduct‐human‐research‐2007‐updated‐2018#block‐views‐block‐file‐attachments‐content‐block‐1 (viewed Nov 2021).
- 13. Yazer MH, Delaney M, Doughty H, et al. It is time to reconsider the risks of transfusing RhD negative females of childbearing potential with RhD positive red blood cells in bleeding emergencies. Transfusion 2019; 59: 3794–3799.
- 14. Australian Red Cross Lifeblood; Department of Health (Victoria). Issue of O RhD negative emergency red cell units: not without risk (STIR Bulletin Number 6). 21 Jan 2021. https://www2.health.vic.gov.au/about/publications/researchandreports/stir‐bulletin‐number‐6 (viewed Sept 2021).
- 15. Mulay SB, Jaben EA, Johnson P, et al. Risks and adverse outcomes associated with emergency‐release red blood cell transfusion. Transfusion 2013; 53: 1416–1420.
- 16. Koelewijn J, Vrijkotte T, de Haas M, et al. Risk factors for the presence of non‐rhesus D red blood cell antibodies in pregnancy. BJOG 2009; 116: 655–664.
Abstract
Objective: To determine the distribution of ABO RhD blood groups in Australia in 2019.
Design: Retrospective analysis of blood group data for blood donors (Australian Red Cross Lifeblood National Blood Management System) and for people whose blood type was determined in samples submitted for analysis by hospital‐based or private pathology agencies.
Setting: All Australian states and territories, 1 January – 31 December 2019.
Main outcome measures: Proportions of donors and patients, by ABO blood group and RhD status. These proportions were compared with published data for 1993–94 first‐time blood donors.
Results: A total of 1 318 751 valid ABO RhD blood group results were provided by 28 of 41 invited pathology agencies (including 245 of 324 approved health providers, 76%). Valid ABO RhD data were available for 490 491 blood donors, including 103 798 first‐time donors (21.2%). Blood group prevalence based on samples typed by pathology services was O RhD+, 38.4%; O RhD–, 6.5%; A RhD+, 32.0%; A RhD–, 5.6%; B RhD+, 11.8%; B RhD–, 1.5%; AB RhD+, 3.7%; and AB RhD–, 0.5% (totals: RhD+, 85.9%; RhD–, 14.1%). The distribution based on typing of first‐time blood donors was similar. The overall proportion of RhD+ first‐time donors rose from 81% in 1993–94 to 83.8% in 2019; the proportion of groups B and AB RhD+ RBC units issued declined from 9.8% in 2010–11 to 6.9% of all RBC units in 2019–20, while that of O RhD– RBC units increased from 11.7% to 17.4%.
Conclusion: Our national assessment of ABO RhD prevalence in Australia provides updated information for re‐evaluating blood and blood product collection and holdings in light of changes in population demographic characteristics.