


The known: Considerable quantities of medications are not accounted for in public hospitals. Before the adoption of electronic medication records, assessing the extent of the problem required labour‐intensive audits.
The new: Electronic medication supply and usage data for twenty medications frequently used in four Melbourne hospitals indicated that almost one‐fifth of units supplied to medical and surgical wards and emergency department were not administered to patients. The missing quantity was greatest for medication useful for self‐treatment.
The implications: Inadequate oversight of the fate of hospital medications has implications for patient care, and health, social, and legal consequences should medications be stolen or misused.
The quantity of a medication supplied to a hospital ward should closely match the quantity administered to patients.1 A discrepancy between the amounts supplied and used may reflect medication expiry, wastage, after‐hours transfer to other wards, failure to document administration, or theft.2 In emergency department (EDs), discrepancies have been reported for medications commonly used for self‐treatment, and for oral alternatives to parenteral preparations.1 Unlawful diversion of controlled medications is also a recognised problem.3,4,5,6,7,8,9
Evaluating medication discrepancies was difficult when records were paper‐based, as collating administrative data required a labour‐intensive medical record audit. Electronic medication records, including medication supply and administration data, have facilitated the detection of medication discrepancies.1
In this study, we analysed electronic medication supply and administration data for a variety of inpatient wards and EDs. Our aim was to describe the nature, extent, and cost of medication discrepancies.
Methods
We undertook a multicentre, retrospective observational study in the Austin, Box Hill, Footscray, and Frankston Hospitals in Melbourne, Victoria. The four hospitals are public metropolitan teaching centres with 560, 300, 425, and 401 beds respectively, and their EDs received 90 000, 43 200, 64 604, and 100 616 people in 2019 (according to hospital records).
We assessed the quantities of selected medications supplied to two general medical wards, two surgical wards (one general, one orthopaedic) and the ED of each hospital, and the amounts administered to patients during the 2019 calendar year. Medication supply data were extracted from the pharmacy drug management system (MERLIN, PharmHos or iPharmacy, iSoft), and medication administration data from the electronic prescribing system (Millennium, Cerner). Data on doses that were lost, wasted, returned to the pharmacy, or destroyed were not available.
For this study, an emergency physician and senior hospital pharmacists purposively sampled medications that are frequently prescribed (eg, for simple analgesia), useful for self‐treatment (eg, anti‐emetics), are associated with illegal diversion (eg, benzodiazepines), and oral and parenteral preparations of the same or similar medications (eg, oral and parenteral ondansetron). The selection was informed by the results of a pilot study,1 and was not influenced by medication cost:
- • Antibiotics
- ► Phenoxymethylpenicillin (250 mg capsule), benzylpenicillin (1.2 g injection)
- ► Cefalexin (500 mg capsule), ceftriaxone (1 g vial)
- ► Amoxicillin (500 mg capsule), ampicillin (1 g vial), amoxicillin/clavulanate (500 mg/125 mg tablet)
- • Gastrointestinal medications
- ► Ondansetron (4 mg tablet, 4 mg ampoule)
- ► Metoclopramide (10 mg tablet, 10 mg ampoule)
- ► Pantoprazole (40 mg tablet, 40 mg vial)
- • Benzodiazepines
- ► Temazepam (10 mg tablet)
- ► Diazepam (5 mg tablet, 10 mg ampoule)
- • Analgesics
- ► Paracetamol (500 mg tablet, 665 mg tablet), paracetamol/codeine (500 mg/30 mg tablet)
- ► Oxycodone (immediate release 5 mg tablet)
Diazepam, temazepam, paracetamol/codeine, and oxycodone are potentially medications of dependence, and should be stored securely. Assumptions about administration quantities were made for some medications; for example, if 2.5 mg oral diazepam was given to a patient, it was assumed that a 5 mg tablet was broken and half the tablet discarded. A set of rules accounted for non‐standard or confusing administration practices (Supporting Information, table 1). Medication costs were extracted from the Common Catalogue of Health Services Victoria.10
Outcome measures
The primary outcome measure for each medication was the discrepancy between the amounts ordered (supplied to the ward) and administered, expressed as the proportion of the quantity supplied. The discrepancy value is directly related to the amount of medication not accounted for. The secondary outcome measure was the direct cost to the hospitals associated with the discrepancies, calculated from the unit cost for each medication. We did not examine reasons for medication discrepancies.
Statistical analysis
Data are summarised as absolute numbers and proportions (with 95% confidence intervals, CIs). Our sample size was based upon clinically significant differences in discrepancies between ward types and between different preparations of the same (or similar) medications. An absolute difference of 20% was deemed clinically significant. To detect this difference (power, 0.95; α = 0.05, two‐sided), at least 133 units of a medication item had to have been supplied.
Ethics approval
This project was approved by the Austin Health Human Research Ethics Committee (HREC/56840/Austin‐2019).
Results
The overall discrepancy rate (all medications, hospitals, ward types) was 19.2% (95% CI, 19.0–19.4%). The discrepancies were greatest for oral antibiotics (eg, phenoxymethylpenicillin 250 mg capsule, 86.8%; 95% CI, 83.1–89.9%) and gastrointestinal medications (eg, ondansetron 4 mg tablet, 53.3%; 95% CI, 52.9–53.7%). Discrepancies were greater for oral than for equivalent (or similar) parenteral formulations (eg, cefalexin 500 mg capsule, 31.6%; 95% CI, 31.0–32.2%; ceftriaxone 1 g vial, 10.4%; 95% CI, 10.1–10.8%).
Overall discrepancies for most controlled medications (ie, Schedules 4 or 811) were relatively low (eg, diazepam 5 mg tablet, 10.0%; 95% CI, 9.7–10.3%; oxycodone 5 mg tablet, 6.2%; 95% CI, 6.1–6.3%) (Box 1). However, the overall discrepancy for oxycodone at hospital 4 was 19.9% (Box 2), and the ED discrepancy 30.6% (Box 4). The overall discrepancy for temazepam was substantial (39.3%; 95% CI, 38.4–40.1%), but this result was attributable to hospital 3 reporting an overall discrepancy of 67.1% (and of 58.1% for its ED); at the other hospitals, the overall rates were less than 10% (Box 2, Box 4). The overall discrepancy for diazepam ampoules was negative (–21.8%; 95% CI, –28.0 to –16.6%); this outcome was largely attributable to the hospital 2 ED reporting that 20 units were supplied, but that 125 were administered (Box 4).
Discrepancies by hospital, ward type, and emergency department
The overall discrepancy rate differed between hospitals, ranging between 5.8% (95% CI, 5.7–5.9%) and 26.7% (95% CI, 26.6–26.9%). The rates by medication also differed between hospitals, but similar patterns were generally evident, including higher rates for oral antibiotics and gastrointestinal medications than for other preparations (Box 2).
The overall discrepancy rate differed between ward types: the rate for EDs (32.3%; 95% CI, 32.2–32.5%) was higher than for medical (16.0%; 95% CI, 15.8–16.1%) and surgical wards (12.1%; 95% CI, 12.0–12.2%). The rates by medication also differed between ward types, but similar patterns were generally evident, including higher rates for oral antibiotics and gastrointestinal medications than for other preparations (Box 3).
The overall discrepancy rate differed between the four EDs, ranging between 25.7% (95% CI, 25.5–26.0%) and 39.5% (95% CI, 39.2–39.7%). The rates by medication also differed between EDs, but similar patterns were evident, including generally higher rates for oral antibiotics and gastrointestinal medications than for other preparations (Box 4).
Medication discrepancies: direct cost to hospitals
The total estimated cost associated with the identified discrepancies was $27 800, or 0.02% of the 2019 medication budget of $124 979 795 for the included wards in the four hospitals. Ondansetron tablets ($0.36/unit) accounted for 44% of the discrepancy‐related cost, while the more expensive benzylpenicillin injection ($8.09/unit) accounted for 19% (Box 5).
Discussion
We found that 19.2% of units of the selected medications supplied to four hospital wards and EDs in each of the four participating hospitals were not administered to patients. In the United States, information management system analyses found 15.0%12 and 15.8%13 discrepancies between the dispensing of controlled substances and their administration in anaesthesiology departments; an earlier audit had identified a 20% discrepancy.5
Discrepancy patterns were similar for each of the four hospitals in our study. Differences for medications useful for self‐treatment or for treatment of friends or family, such as oral antibiotics, were relatively high. A study in Palestine similarly found high rates of “missing” cefalexin and amoxicillin.14 Our findings were also consistent with other reports that discrepancies were higher for oral than equivalent parenteral medications, whereby those for parenteral preparations were probably attributable to wastage.1
We did not investigate the reasons for the discrepancies. Medication theft by staff2,5,6,7 for self‐treatment in or outside the workplace has been reported.2,7 A 1985 American study2 found that 74% of ED nurses admitted stealing medications, and a subsequent analysis reported that they rationalised the theft and use of simple analgesics during their shifts.7 Our findings and those of other investigators1,2,7,14 suggest that medication discrepancies are partially explained by theft, typically for self‐treatment.
Diversion of controlled medications by hospital staff has been described, particularly in peri‐operative areas of hospital practice.3,4,5,8,9,12 One large American study of prescription medication diversion (Cincinnati, 1992–2002) found that opioids were involved in 67% of cases.6 The generally low discrepancy rates for controlled substances in our survey were encouraging, but the high rates for oxycodone and temazepam at individual hospitals are concerning and require investigation. The negative discrepancy for diazepam ampoules is probably related to the small total number supplied (216), as the effects of transfers between wards and similar factors would be amplified.
Earlier studies1,7 found relationships between medication diversion and accessibility. As controlled medications are associated with misuse,4,10 in Australia they are generally stored in a safe and need to be signed out by two authorised staff members. Transfers of these medications are monitored, making diversion difficult; a surveillance system for atypical medication transactions in an American anaesthesiology department prospectively identified two instances of diversion.13,15 Given the substantial discrepancies for non‐controlled medications we identified, a similar surveillance system and more secure storage (eg, BD Pyxis MedStation, Omnicell automated dispensing and monitoring software) may be advisable.
The large discrepancies for ED medications we found probably have several causes. Medication is often transferred from EDs to other wards or services, bypassing supply and administration systems, particularly outside normal working hours, when a medication may not be immediately available on a particular ward. Patients discharged to hospital in the home may be given parenteral medications to ensure continuity of treatment before a definitive source is secured, and doctors may provide discharged patients with starter packs or complete courses of medication instead of prescriptions. Further, prescription medications are occasionally supplied from the ED medication imprest instead of the after‐hours medication facility for discharged patients. The relatively hectic environment and larger staff numbers in EDs may also contribute to discrepancies.
Other possible explanations for discrepancies include failure to document medication administration, failure to document verbal orders, and temporary unavailability of the medication record system.1 Discrepancies may also result from undocumented preparation and administration errors, changes in imprest medication levels, stock recalls, spillage, waste, and medication expiry.
The estimated cost of medication discrepancies was small relative to overall hospital medication expenses. The medications we included are old and relatively inexpensive, particularly compared with some newer oncology medications. Our cost estimate, however, was incomplete; for example, we did not take into account that some “missing” medications may have been used appropriately (eg, in another ward, without documentation). In any case, our analysis was limited to a selection of imprest medications, and to a limited number of wards. Further, investigating discrepancies, patient care problems caused by suboptimal care or malpractice, diversion motivated by substance misuse, and other inappropriate medication use would incur additional, indirect costs.4
An important clinical implication of our study is that hospitals cannot accurately account for all medications, some use being invisible to electronic systems. This may result from electronic ordering and administration process errors. Failing to document medication use could result in an overdose should another staff member not be aware of previous administration. Inappropriate, unsupervised use of stolen medication may have health, social, and legal consequences.3,4 The large discrepancies for oral antibiotics in our study may reflect inappropriate use by staff members. Finally, using stolen medications can result in poor patient care by impaired staff or inadequate treatment or analgesia if medication intended for patients is misappropriated.3,4
We recommend that the integrity of electronic medication supply and administration data be validated, comparing electronic with manual audit data. Larger multicentre studies, including a broader range of wards, could examine changes in discrepancies over time and after improving the security of medication storage. Reasons for medication discrepancies should be examined to facilitate development of appropriate targeted interventions, including staff education, strict administration sign‐off procedures and audit, and improved tracking of medication transferred to wards, given to patients or other services, or not used for other reasons. Cameras in medication rooms could be considered, and procedures for averting diversion and harmonising supply and use reviewed.5,12,13 Our findings highlight the importance of monitoring discrepancies between electronic medication supply and administration data to improve the detection and prevention of medication loss.
Limitations
Our study is the first large analysis of electronic medication supply and administration data in Australia, examining a range of medications in three ward types over 12 months in four public teaching hospitals. Although some assumptions underlying the study rules may have been incorrect, they enhanced the consistency of data collection. Routine auditing of register books (separate from Cerner Millennium administration documentation) yielded data that were not always consistent with electronic data for controlled medications. The discrepancies for some medications were negative, but this generally involved low use medications, for which variations in use and transfer could have apparently anomalous consequences. We could not check medication inventories before and after the study, but imprest stocks at the four hospitals are relatively small and quantities do not vary greatly. At Western and Frankston hospitals, some prescribing (eg, of syringe driver‐injected medications) was recorded on paper charts and not captured electronically. Errors in medication dosage and other documentation errors were also possible. Only frequently used medications were assessed, and discrepancies for other preparations cannot be extrapolated from our data.
Conclusion
For the twenty commonly used medications we examined, about one‐fifth of units supplied to wards and EDs in four Melbourne public hospitals were not recorded as being administered to patients. The discrepancies between supply and use were greatest for medications useful for self‐treatment, and were typically greater for oral preparations than equivalent parenteral formulations. Discrepancies for controlled medications, however, were relatively small. The gaps between supply and use were greater for EDs than inpatient wards. The overall direct cost of medication discrepancies was moderate.
Box 1 – Medication discrepancies for all hospitals and ward types combined, by medication
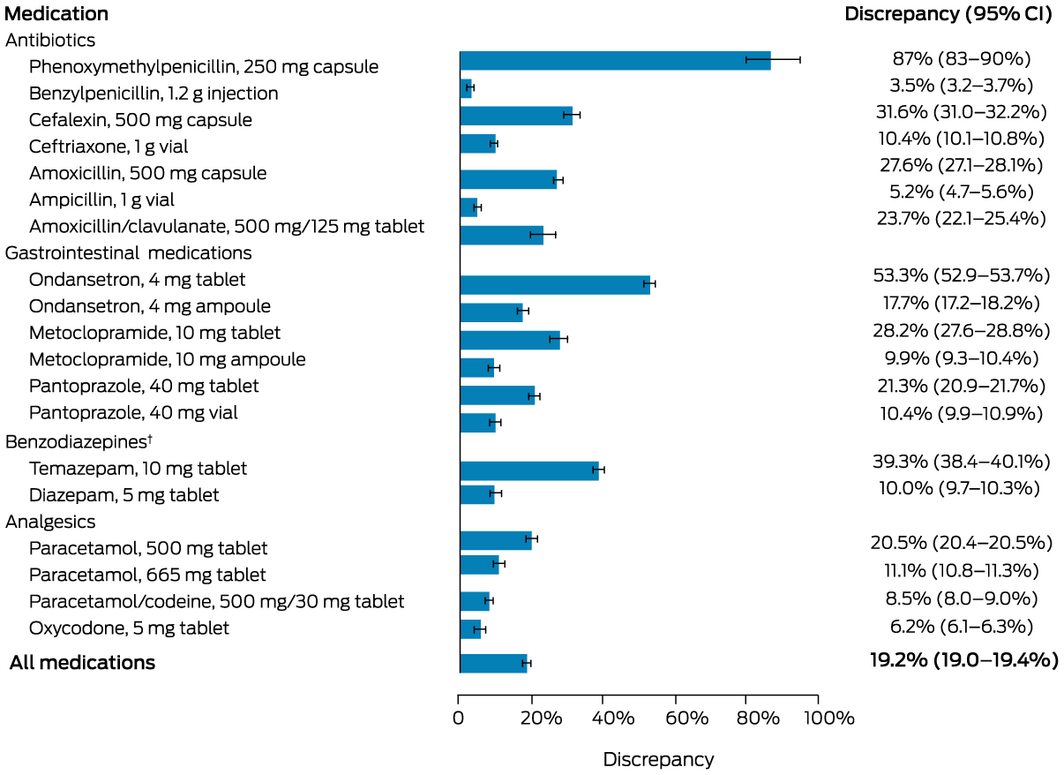
* The numbers of supplied and administered units for each medication are provided in the online Supporting Information, table 2. † Not shown: diazepam, 10 mg ampoule; discrepancy, –21.8%; 95% CI, –28.0% to –16.6%.
Box 2 – Medication discrepancies for all ward types combined, by hospital and medication
|
|
Discrepancy (units administered/units supplied) |
||||||||||||||
|
Medication |
Hospital 1 |
Hospital 2 |
Hospital 3 |
Hospital 4 |
|||||||||||
|
|
|||||||||||||||
|
Antibiotics |
|
|
|
|
|||||||||||
|
Phenoxymethylpenicillin, 250 mg capsule |
75% |
NA |
87% |
96% |
|||||||||||
|
Benzylpenicillin, 1.2 g injection |
2.0% |
7.1% |
14.1% |
5.7% |
|||||||||||
|
Cefalexin, 500 mg capsule |
24.8% |
24.9% |
45.5% |
32.7% |
|||||||||||
|
Ceftriaxone, 1 g vial |
32.2% |
6.0% |
10.2% |
9.3% |
|||||||||||
|
Amoxicillin, 500 mg capsule |
16.9% |
31.1% |
33.5% |
36.5% |
|||||||||||
|
Ampicillin, 1 g vial |
4.4% |
6.1% |
NA |
NA |
|||||||||||
|
Amoxicillin/clavulanate, 500 mg/125 mg tablet |
NA |
29.7% |
18.6% |
25.4% |
|||||||||||
|
Gastrointestinal medications |
|
|
|
|
|||||||||||
|
Ondansetron, 4 mg tablet |
51.3% |
23.9% |
74.8% |
49.7% |
|||||||||||
|
Ondansetron, 4 mg ampoule |
16.8% |
6.1% |
25.9% |
20.2% |
|||||||||||
|
Metoclopramide, 10 mg tablet |
27.7% |
20.3% |
37.9% |
27.3% |
|||||||||||
|
Metoclopramide, 10 mg ampoule |
7.5% |
5.4% |
13.8% |
15.0% |
|||||||||||
|
Pantoprazole, 40 mg tablet |
20.5% |
12.1% |
29.6% |
19.9% |
|||||||||||
|
Pantoprazole, 40 mg vial |
9.4% |
5.5% |
16.7% |
NA |
|||||||||||
|
Benzodiazepines |
|
|
|
|
|||||||||||
|
Temazepam, 10 mg tablet |
9.7% |
9.6% |
67.1% |
6.2% |
|||||||||||
|
Diazepam, 5 mg tablet |
7.3% |
4.7% |
12.7% |
13.1% |
|||||||||||
|
Diazepam, 10 mg ampoule |
24% |
–520% |
26% |
58% |
|||||||||||
|
Analgesics |
|
|
|
|
|||||||||||
|
Paracetamol, 500 mg tablet |
18.7% |
5.9% |
29.4% |
24.2% |
|||||||||||
|
Paracetamol, 665 mg tablet |
16.0% |
1.4% |
18.9% |
NA |
|||||||||||
|
Paracetamol/codeine, 500 g/30 mg tablet |
8.7% |
1.3% |
9.6% |
10.5% |
|||||||||||
|
Oxycodone, 5 mg tablet |
7.0% |
6.1% |
5.5% |
19.9% |
|||||||||||
|
All medications (with 95% CI) |
18.3% (18.2–18.4%) |
5.8% (5.7–5.9%) |
26.7% (26.6–26.9%) |
23.7% (23.5–23.8%) |
|||||||||||
|
|
|||||||||||||||
|
CI = confidence interval; NA = not applicable (medication neither supplied nor administered). * Supplied only to emergency department. † Supplied only to stationary wards. |
|||||||||||||||
Box 3 – Medication discrepancies for all hospitals combined, by ward type and medication
|
|
Discrepancy (units administered/units supplied) |
||||||||||||||
|
Medication |
Medical wards |
Surgical wards |
Emergency departments |
||||||||||||
|
|
|||||||||||||||
|
Antibiotics |
|
|
|
||||||||||||
|
Phenoxymethylpenicillin, 250 mg capsule |
NA |
NA |
87% |
||||||||||||
|
Benzylpenicillin, 1.2 g injection |
1.2% |
–0.4% |
11.8% |
||||||||||||
|
Cefalexin, 500 mg capsule |
26.3% |
24.4% |
70.0% |
||||||||||||
|
Ceftriaxone, 1 g vial |
8.1% |
6.8% |
14.2% |
||||||||||||
|
Amoxicillin, 500 mg capsule |
18.0% |
50.4% |
59.1% |
||||||||||||
|
Ampicillin, 1 g vial |
6.5% |
0.1% |
11.6% |
||||||||||||
|
Amoxicillin/clavulanate, 500 mg/125 mg tablet |
22.6% |
37.6% |
–70% |
||||||||||||
|
Gastrointestinal medications |
|
|
|
||||||||||||
|
Ondansetron, 4 mg tablet |
61.7% |
49.7% |
51.5% |
||||||||||||
|
Ondansetron, 4 mg ampoule |
22.4% |
7.1% |
26.7% |
||||||||||||
|
Metoclopramide, 10 mg tablet |
27.8% |
25.7% |
42.9% |
||||||||||||
|
Metoclopramide, 10 mg ampoule |
14.5% |
5.6% |
15.1% |
||||||||||||
|
Pantoprazole, 40 mg tablet |
17.0% |
20.1% |
46.3% |
||||||||||||
|
Pantoprazole, 40 mg vial |
11.3% |
–1.3% |
31.1% |
||||||||||||
|
Benzodiazepines |
|
|
|
||||||||||||
|
Temazepam, 10 mg tablet |
32.4% |
45.4% |
42.9% |
||||||||||||
|
Diazepam, 5 mg tablet |
2.1% |
2.4% |
17.5% |
||||||||||||
|
Diazepam, 10 mg ampoule |
90% |
NA |
–32% |
||||||||||||
|
Analgesics |
|
|
|
||||||||||||
|
Paracetamol, 500 mg tablet |
16.6% |
11.2% |
39.1% |
||||||||||||
|
Paracetamol, 665 mg tablet |
5.8% |
15.5% |
45.7% |
||||||||||||
|
Paracetamol/codeine, 500 g/30 mg tablet |
4.3% |
–2.2% |
10.6% |
||||||||||||
|
Oxycodone, 5 mg tablet |
4.2% |
1.8% |
11.9% |
||||||||||||
|
All medications (with 95% CI) |
16.0% (15.8–16.1%) |
12.1% (12.0–12.2%) |
32.3% (32.2–32.5%) |
||||||||||||
|
|
|||||||||||||||
|
CI = confidence interval; NA = not applicable (medication neither supplied nor administered). |
|||||||||||||||
Box 4 – Medication discrepancies for emergency departments, by hospital and medication
|
|
Discrepancy (units administered/units supplied) |
||||||||||||||
|
Medication |
Hospital 1 |
Hospital 2 |
Hospital 3 |
Hospital 4 |
|||||||||||
|
|
|||||||||||||||
|
Antibiotics |
|
|
|
|
|||||||||||
|
Phenoxymethylpenicillin, 250 mg capsule |
75% |
NA |
87% |
96% |
|||||||||||
|
Benzylpenicillin, 1.2 g injection |
11.2% |
0.4% |
22.1% |
9.8% |
|||||||||||
|
Cefalexin, 500 mg capsule |
51.8% |
22.8% |
84.1% |
77.7% |
|||||||||||
|
Ceftriaxone, 1 g vial |
32.2% |
0.1% |
17.6% |
9.5% |
|||||||||||
|
Amoxicillin, 500 mg capsule |
24.1% |
23.3% |
79.6% |
61.7% |
|||||||||||
|
Ampicillin, 1 g vial |
11.5% |
11.6% |
NA |
NA |
|||||||||||
|
Amoxicillin/clavulanate, 500 mg/125 mg tablet |
NA |
NA |
–70% |
NA |
|||||||||||
|
Gastrointestinal medications |
|
|
|
|
|||||||||||
|
Ondansetron, 4 mg tablet |
56.4% |
28.0% |
69.1% |
47.6% |
|||||||||||
|
Ondansetron, 4 mg ampoule |
18.2% |
27.2% |
32.1% |
27.6% |
|||||||||||
|
Metoclopramide, 10 mg tablet |
44.2% |
14.3% |
57.7% |
46.1% |
|||||||||||
|
Metoclopramide, 10 mg ampoule |
6.7% |
–0.7% |
25.4% |
23.8% |
|||||||||||
|
Pantoprazole, 40 mg tablet |
47.7% |
14.8% |
63.7% |
32.9% |
|||||||||||
|
Pantoprazole, 40 mg vial |
23.4% |
39.8% |
29.9% |
NA |
|||||||||||
|
Benzodiazepines |
|
|
|
|
|||||||||||
|
Temazepam, 10 mg tablet |
43% |
–0.8% |
58.1% |
42% |
|||||||||||
|
Diazepam, 5 mg tablet |
13.9% |
4.3% |
22.3% |
21.5% |
|||||||||||
|
Diazepam, 10 mg ampoule |
24% |
–520.0% |
26% |
–30% |
|||||||||||
|
Analgesics |
|
|
|
|
|||||||||||
|
Paracetamol, 500 mg tablet |
25.9% |
48.7% |
46.5% |
38.7% |
|||||||||||
|
Paracetamol, 665 mg tablet |
68.2% |
12.4% |
41.7% |
NA |
|||||||||||
|
Paracetamol/codeine, 500 g/30 mg tablet |
7.5% |
–4.2% |
14.4% |
14.3% |
|||||||||||
|
Oxycodone, 5 mg tablet |
8.6% |
–22.0% |
14.1% |
30.6% |
|||||||||||
|
All medications (with 95% CI) |
25.7% (25.5–26.0%) |
29.1% (28.8–29.5%) |
39.5% (39.2–39.7%) |
34.3% (34.0–34.7%) |
|||||||||||
|
|
|||||||||||||||
|
CI = confidence interval; NA = not applicable (medication neither supplied nor administered). |
|||||||||||||||
Box 5 – Cost of the medication discrepancies
|
Medication |
Unit cost ($) |
Discrepancy (units) |
Discrepancy cost ($) |
||||||||||||
|
|
|||||||||||||||
|
Antibiotics |
|
|
|
||||||||||||
|
Phenoxymethylpenicillin, 250 mg capsule |
0.080 |
356 |
28.48 |
||||||||||||
|
Benzylpenicillin, 1.2 g injection |
8.090 |
643 |
5201.87 |
||||||||||||
|
Cefalexin, 500 mg capsule |
0.084 |
6797 |
570.95 |
||||||||||||
|
Ceftriaxone, 1 g vial |
0.400 |
3106 |
1242.40 |
||||||||||||
|
Amoxicillin, 500 mg capsule |
0.003 |
8122 |
24.37 |
||||||||||||
|
Ampicillin, 1 g vial |
1.080 |
496 |
535.68 |
||||||||||||
|
Amoxicillin/clavulanate, 500 mg/125 mg tablet |
0.180 |
612 |
110.16 |
||||||||||||
|
Gastrointestinal medications |
|
|
|
||||||||||||
|
Ondansetron, 4 mg tablet |
0.360 |
33 644 |
12 111.84 |
||||||||||||
|
Ondansetron, 4 mg ampoule |
0.430 |
4594 |
1975.42 |
||||||||||||
|
Metoclopramide, 10 mg tablet |
0.039 |
5634 |
219.73 |
||||||||||||
|
Metoclopramide, 10 mg ampoule |
0.220 |
1180 |
259.60 |
||||||||||||
|
Pantoprazole, 40 mg tablet |
0.049 |
10 257 |
502.59 |
||||||||||||
|
Pantoprazole, 40 mg vial |
1.710 |
1661 |
2840.31 |
||||||||||||
|
Benzodiazepines |
|
|
|
||||||||||||
|
Temazepam, 10 mg tablet |
0.024 |
4889 |
117.34 |
||||||||||||
|
Diazepam, 5 mg tablet |
0.027 |
3406 |
91.96 |
||||||||||||
|
Diazepam, 10 mg ampoule |
3.290 |
‒47 |
‒154.63 |
||||||||||||
|
Analgesics |
|
|
|
||||||||||||
|
Paracetamol, 500 mg tablet |
0.008 |
155 152 |
1241.22 |
||||||||||||
|
Paracetamol, 665 mg tablet |
0.036 |
7058 |
254.09 |
||||||||||||
|
Paracetamol/codeine, 500 g/30 mg tablet |
0.035 |
1185 |
41.48 |
||||||||||||
|
Oxycodone, 5 mg tablet |
0.055 |
10 646 |
585.53 |
||||||||||||
|
Total cost |
— |
— |
27 800.37 |
||||||||||||
|
|
|||||||||||||||
|
|
|||||||||||||||
Received 3 August 2021, accepted 10 November 2021
- Kimberly Walker1
- Andrew M Harding2
- Julina Tran1
- Paul Wembridge3
- Kent Garrett2
- Kent MacMillan1
- Olivia Rofe3
- Nicholas Jones4
- David Taylor2
- 1 Western Health, Melbourne, VIC
- 2 Austin Health, Melbourne, VIC
- 3 Eastern Health, Melbourne, VIC
- 4 Peninsula Health, Melbourne, VIC
No relevant disclosures.
- 1. Hendarto A, Harding AM, Kant JA, et al. Misappropriation of medication and equipment in the emergency department. Aust Emerg Care 2019; 22: 92–96.
- 2. Jones JW. Attitudinal correlates of employee theft of drugs and hospital supplies among nursing personnel. Nurs Res 1981; 30: 349–351.
- 3. Berge KH, Dillon KR, Sikkink KM, et al. Diversion of drugs within health care facilities, a multiple‐victim crime: patterns of diversion, scope, consequences, detection, and prevention. Mayo Clinic Proc 2012; 87: 674–682.
- 4. Fan M, Tscheng D, Hamilton M, et al. Diversion of controlled drugs in hospitals: a scoping review of contributors and safeguards. J Hosp Med 2019; 14: 419–428.
- 5. Adler GR, Potts FE, Kirby RR, et al. Narcotics control in anesthesia training. JAMA 1985; 253: 3133–3136.
- 6. Inciardi JA, Surratt HL, Kurtz SP, Burke JJ. The diversion of prescription drugs by health care workers in Cincinnati, Ohio. Subst Use Misuse 2006; 41: 255–264.
- 7. Dabney D. Neutralization and deviance in the workplace: theft of supplies and medicines by hospital nurses. Deviant Behavior 1995; 16: 313–331.
- 8. Hughes Hempstead LA. Narcotics diversion: a director’s experience. J Emerg Nurs 2007; 33: 175–178.
- 9. Trinkoff AM, Storr CL, Wall MP. Prescription‐type drug misuse and workplace access among nurses. J Addict Dis 1999; 18: 9–17.
- 10. Health Share Victoria. Health Purchasing Victoria: common catalogue. https://healthsharevic.org.au/supply‐chain/catalogues/common‐catalogue (viewed June 2021).
- 11. Department of Health (Victoria). Scheduled medicines. https://www2.health.vic.gov.au/public‐health/drugs‐and‐poisons/scheduled‐medicines (viewed June 2021).
- 12. Vigoda MM, Gencorelli FJ, Lubarsky DA. Discrepancies in medication entries between anesthetic and pharmacy records using electronic databases. Anesth Analg 2007; 105: 1061–1065.
- 13. Epstein RH, Dexter F, Gratch DM, et al. Controlled substance reconciliation accuracy improvement using near real‐time drug transaction capture from automated dispensing cabinets. Anesth Analg 2016; 122: 1841–1855.
- 14. Al Adham M, Abu Hamad B. Drug dispensing systems in Gaza hospitals: a comparative study. East Mediterr Health J 2011; 17: 722–729.
- 15. Epstein RH, Gratch DM, McNulty S, Grunwald Z. Validation of a system to detect scheduled drug diversion by anesthesia care providers. Anesth Analg 2011; 113: 160–164.
Abstract
Objective: To determine the nature, extent, and cost of discrepancies between the quantities of medications supplied to medical departments and administered to patients in public hospitals.
Design: Multicentre, retrospective observational study; analysis of electronic pharmacy drug management system (medication supply) and medication administration data for twenty frequently used medications.
Setting, participants: Medical, surgical, and emergency department (ED) wards in each of four public hospitals in Melbourne, Victoria, during the 2019 calendar year.
Main outcome measures: Discrepancy between the quantity of medication supplied and administered to patients (as proportion of medication supplied), overall and by hospital and ward type; direct cost to the hospitals of the discrepancies.
Results: The overall discrepancy rate (all medications, hospitals, ward types) was 19.2% (95% CI, 19.0–19.4%); overall rates by hospital ranged from 5.8% (95% CI, 5.7–5.9%) to 26.7% (95% CI, 26.6–26.9%). The discrepancies were largest for medications useful for self‐treatment: oral antibiotics (eg, phenoxymethylpenicillin 250 mg capsule, 86.8%; 95% CI, 83.1–89.9%) and gastrointestinal medications (eg, ondansetron 4 mg tablet, 53.3%; 95% CI, 52.9–53.7%). Discrepancies were larger for oral than equivalent (or similar) parenteral formulations; they were generally low for controlled medications (temazepam, diazepam, oxycodone). Overall discrepancies were larger for EDs (32.3%; 95% CI, 32.2–32.5%) than for admitted patient wards, but differed between EDs (range: 25.7%; 95% CI, 25.5–26.0% to 39.5%; 95% CI, 39.2–39.7%). The estimated direct cost to hospitals of the discrepancies for the selected medications was $27 800.
Conclusion: Substantial quantities of medications supplied to hospital wards and EDs are not accounted for in electronic administration records.