


The known: Hospital‐acquired complications are frequent events, and variation in rates between hospitals is often interpreted as indicating differences in quality of health care, despite the complex interactions between hospital‐ and patient‐related factors.
The new: During 2015–2018, hospital‐acquired complications were reported for 9.7% of major hospital episodes in South Australia and Victoria. Patient characteristics on admission were the major determinant, explaining 55% of overall variance in rates, compared with 5% for hospital characteristics.
The implications: Hospital‐acquired complication rates reflect casemix and patient characteristics more than hospital factors and quality of care. Clinical validation of our findings and revision of our interpretation of complications are warranted.
Every health care intervention entails risks of preventable human and system errors, and every disease includes risks of serious complications, some avertible. In both cases, serious adverse events during hospital care can ensue, increasing morbidity, delaying recovery, and increasing costs (Box 1). Examples of complications related to health care error include anaphylaxis following administration of a known allergen, venous thrombo‐embolism because prophylaxis was neglected, and bowel perforation during diagnostic endoscopy. Complications related to patient factors include anaphylaxis elicited by a previously unrecognised allergen, thrombo‐embolism despite optimal prophylaxis, and spontaneous bowel perforation caused by occult cancer.
To improve “safety and quality in the provision of health care services”,1 the Australian Commission on Safety and Quality in Health Care (ACSQHC), in collaboration with Australian health policy institutes,2,3 developed their hospital‐acquired complication classification system, now endorsed by all Australian health departments. The ACSQHC system focuses on 41 serious adverse clinical events grouped into 16 classes “for which clinical risk mitigation strategies may reduce the risk of that complication occurring”.4 Health services are encouraged to evaluate hospital‐acquired complications, identify gaps in health care, and implement risk mitigation measures.4
Complications related to patient or hospital factors have similar consequences for morbidity, hospital stay, and costs5 (Box 1), but distinguishing between the two types is essential for clinical interpretation and risk mitigation.
The influence of patient factors (age, diagnosis, comorbidity) and hospital factors (site, type, standard of care) on hospital‐acquired complication rates has not been examined in Australia. We therefore analysed administrative data from two Australian states (South Australia, Victoria) to quantify the prevalence and to determine the influence of these factors on hospital‐acquired complication rates.
Methods
We extracted data for acute care episodes in public hospitals for the period 1 January 2015 – 31 December 2018 from the Integrated South Australian Activity Collection6 and the Victorian Admitted Episodes Dataset.7 Each dataset includes demographic, diagnostic, and clinical information abstracted from medical records by health information managers.
A maximum of forty diagnosis codes (International Classification of Diseases, tenth revision, Australian modification [ICD‐10‐AM]) are recorded for each hospital episode. The condition onset flag assigned to each diagnosis distinguishes on‐admission diagnoses from post‐admission complications.8,9 From each record we extracted diagnosis codes, demographic data (age, sex, clinical urgency, year of separation), and source of admission (home, hospital transfer, aged care facility). We applied published algorithms, modified for the ICD‐10‐AM, to identify chronic disease10 and clinical frailty status.11
Hospital‐acquired complications were identified in post‐admission diagnoses data and classified with the national hospital‐acquired complications algorithm, version 3.12 Information about complication onset time was not available, precluding causal inferences. Patient outcomes examined were survival and length of stay.
Hospital factors recorded for each complication included treating site, type of hospital (tertiary referral, major metropolitan, major regional), which differ in their referral patterns, clinical services, and resources;13 and state, which differ in governance, funding, and population. We also undertook a subgroup analysis of episodes that included treatment in an intensive care unit (ICU).
We included data for multiple‐day acute care episodes for adults (18 years or older) in all major public hospitals, defined as those with on‐site ICUs. We excluded day‐care procedures, non‐acute (palliative, rehabilitative) care, and hospital episodes for which the length of stay exceeded 200 days. The dataset precluded three classes of hospital‐acquired complications from being included in the primary analysis: 5. unplanned ICU admission (not defined in the national algorithm), 15. perineal tear during delivery (fifteen hospitals did not have obstetric services), and 16. neonatal birth trauma (age exclusion).
Statistical analysis
Analyses were performed in Stata/MP 16.1. Group data are summarised as means with standard deviations (SDs) or medians with interquartile ranges (IQRs). Event rates (with 95% confidence intervals, CIs) were calculated from episode numbers and length of stay data. Between‐group differences are reported as standardised mean differences (SMDs); inter‐hospital variation in rates was quantified as the coefficient of variation (CV).
The influence of patient and hospital factors on hospital complication rates was estimated in two stages. First, explanatory models were fitted to data for each complication class (binary dependent outcome) with probit regression estimators, and covariates selected from patient factors recorded on admission (demographic characteristics, diagnoses, comorbid conditions), with errors adjusted for clustering within hospitals. Calendar year was included as a fixed covariate to adjust for temporal changes in reporting. The final explanatory model was selected on the basis of the Akaike (AIC) and Bayesian information criteria (BIC),14 estimated with the Stata fitstat command.15 Propensity scores for the predicted risk (at the time of admission) of a subsequent hospital‐acquired complication were estimated for each episode.
Second, a four‐level random intercept (probit) regression model was fitted to data for each complication class using the Stata meprobit command, with patients (propensity scores) nested in hospitals nested in peer groups as random intercepts. The form of the estimator was:
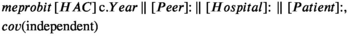
where HAC = hospital‐acquired complication class; Year = year of separation; Peer = hospital peer group and jurisdiction; Hospital = treating hospital; Patient = on‐admission propensity score; cov = variance–covariance structure of the random effects; and || = random intercept logical operator.
This model estimates variance (reported as the intra‐class correlation coefficient,16 ICC) at the patient, hospital, and peer group levels, and thereby the influence of each level on the likelihood of complications. The maximum ICC value of 1.0 indicates substantial influence, an ICC of zero indicates no influence on the likelihood of complications. To test the sensitivity of ICC to identify clinically significant hospital variance, we also estimated the ICC for class 15 (perineal tear during delivery) for the 23 hospitals with and the 15 hospitals without obstetric services. ICC values are probability estimates and not additive.
We selected a low clinical significance limit for SMDs, CVs, and ICCs (0.20) to reduce the risk of type II errors (missing clinically important variation). As the admission diagnosis is itself subject to clinician error, increasing the likelihood of later complications, sensitivity analyses of hospital variance were undertaken in which we excluded admission diagnoses and all patient factors.
Ethics approval
The Eastern Health Human Research Ethics Committee (LNR2020‐199585) approved the study. The South Australian Ministry of Health and the Victorian Agency for Health Information provided the datasets, and each approved publication of this article. Hospital identity was removed prior to analysis, and the requirement for patient consent was waived.
Results
We analysed data for 1 558 978 public hospital episodes (10 029 918 bed‐days) in 38 major public hospitals with on‐site ICUs (Supporting Information, table 1): 369 725 episodes in 12 South Australian hospitals, and 1 189 253 episodes in 26 Victorian hospitals (Box 2). In total, 151 486 episodes (9.72%; 95% CI, 9.67–9.77%) included diagnosis codes for 214 286 hospital‐acquired complication events (2.14 [95% CI, 2.13–2.15] events per 100 bed‐days) (Box 3).
All 38 hospitals reported complications; rates ranged from 3.22 to 16.5 events per 100 episodes (CV, 0.59) and from 0.31 to 3.17 events per 100 bed‐days (CV, 0.92) (data not shown). The most frequent complications were hospital‐associated infections (3.64 [95% CI, 3.61–3.67] events per 100 episodes) and renal failure (2.13 [95% CI, 2.11–2.15] events per 100 episodes) (Box 3). Multiple complications were recorded for 43 050 hospital episodes (2.8%; mean, 1.4 [SD, 0.9] complications per episode).
The median age of patients with complications (72 [IQR, 59–82] years) was higher than for those without complications (62 [IQR, 39–77] years), and larger proportions of patients who experienced complications were frail (40% v 1%) or had other clinical diagnoses (83% v 4%). Further, their median hospital stay was longer (10 [IQR, 6–18] days v 4 [IQR, 2–6] days), and a larger proportion died during their hospital stay than for patients without reported complications (8.1% v 1.4%) (Box 4).
The combined complication rate was higher for the nine tertiary referral hospitals (12.7 [95% CI, 12.6–12.8] events per 100 episodes) than for the fifteen major metropolitan (7.3 [95% CI, 7.2–7.4] events per 100 episodes) and the twelve regional hospitals (7.9 [95% CI, 7.8–8.0] events per 100 episodes) (Supporting Information, table 2).
A total of 84 279 events (39.3% of all complications) were recorded for the 126 277 episodes that included treatment in an ICU (8.1% of all separations); the complication rates for these episodes were 37.1 (95% CI, 36.7–37.4) events per 100 separations and 5.24 (95% CI, 5.20–5.27) events per 100 hospital bed‐days. We had no information about whether complications arose before, during, or after ICU care.
In our first stage models, a mean of 58 (SD, 22) on‐admission patient factors per complication class were significant predictors of later complications (Supporting Information, tables 3 and 4). These models generated a mean of 328 676 (SD, 171 843) distinct (propensity score) subgroups per complication class. In the second stage random effects models, mean variance at the patient level was substantial (ICC, 0.55; 95% CI, 0.53–0.57), while mean variance at the hospital (ICC, 0.04; 95% CI, 0.02–0.07) and peer group levels (ICC, 0.01; 95% CI, 0.001–0.03) was low (Box 5).
In sensitivity analyses, removing admission diagnosis as a factor reduced mean variance at the patient level (mean ICC, 0.33; 95% CI, 0.30–0.37), but removing all patient factors did not affect variance at the hospital level (ICC, 0.05; 95% CI, 0.02–0.09) (Supporting Information, table 5; figures 1–3). In contrast, variance at the hospital level was substantial for class 15 (ICC, 0.58; 95% CI, 0.26–0.86) when the 15 hospitals without obstetric services were included (Box 5).
A small but significant decline in the complication rate between 2015 and 2018 was noted after adjusting for patient admission risk score (by 0.45 [95% CI, 0.42–0.49] events per 100 episodes per year). Rates also declined for nine complication classes (1, 3, 6–8, 10–12, 14), most markedly in class 3, hospital‐acquired infections (decline of 0.10 [95% CI, 0.09–0.13] events per 100 episodes per year); rates rose for class 2 (falls resulting in injury: increase of 0.007 [95% CI, 0.004–0.011] events per 100 episodes per year) and class 4 (surgical complications: increase of 0.13 [95% CI, 0.12–0.15] events per 100 episodes per year) (Supporting Information, figure 4 and table 6).
Discussion
In our analysis of 1.6 million multiple‐day adult acute care episodes over 10 million bed‐days in 38 major hospitals in South Australia and Victoria, we found that hospital‐acquired complications were recorded for 9.7% of hospital episodes; hospital rates ranged from 3.2 to 16.5 events per 100 episodes. Complications were more frequently reported in tertiary referral hospitals than other hospital types, and the rate was greater for episodes including ICU care (37.1 v 7.3 events per 100 episodes). Variation in complication rates per bed‐day (exposure) were similar.
Complication rates declined for nine of 13 complication classes during 2015–2018. Whether the incidence of complications actually dropped or the declines reflected changes in the documentation and coding of events warrants further investigation. The absence of major rate fluctuations suggests that coding was consistent, despite the ICD‐10‐AM being revised in 2017.
Patient‐related factors influenced the risk of hospital‐acquired complications, but the degree of influence differed by complication class (Supporting Information, table 2). The median age of patients who experienced complications was higher than for those who did not, larger proportions were frail or had other clinical conditions, their median hospital stay was longer, and in‐hospital mortality was greater for these patients (Box 4).
The importance of patient‐related factors for hospital complication rates has been reported in Australia,3,17 New Zealand,18 the United Kingdom,19 the Netherlands,20 Canada,21 and the United States.22 Our finding that hospital factors had little influence on complication rates was, however, unexpected.1,2,3,4,8 For all complication classes, variation in rates between hospitals and hospital types (Supporting Information, table 4) was chiefly determined by patient‐related factors at the time of hospital admission rather than by hospital factors (Box 5).
Similar findings23,24 have received little attention, despite their clinical implications. First, the influence of patient‐related factors should be further examined in a multi‐centre clinical audit of reported hospital‐acquired complications.20,25 We support the ACSQHC focus on patient safety and encourage all health services to evaluate local complications data25 and to develop effective mitigation strategies.
Second, the distinction between antecedent patient and hospital factors is neither a semantic exercise nor a convenient excuse for health services and clinicians. Failure to differentiate between the two groups of factors may lead to practice changes that are clinically sound but ineffective in reducing complication rates. Increasing the funding of health care, improved clinical guidelines, and training and education may reduce rates of complications attributable to hospital factors and health care errors, but are unlikely to reduce those linked with patient‐related factors. These require different solutions, including improved patient selection and risk assessment (using, for example, the Grattan Institute hospital complications calculator: https://grattan.shinyapps.io/all‐complications‐should‐count), more informed discussion of treatment risks and patient consent, and the investigation of therapeutic alternatives with lower risks and fewer side effects.
Third, we recommend that clinicians be engaged in developing clinical indicators, including access to the source data and methodology. Expert interpretation of metadata, selection of appropriate statistical methods, and clinical validation are crucial elements if ineffective or costly approaches are to be avoided.3
Fourth, that hospital complication rates are too high is recognised, but it is widely assumed that they are inversely related to the quality of care provided by hospitals.1,2,3,4,23,24,26 Clinical20,25,27 and epidemiological evidence23,24 suggests that rates are not necessarily lower in better performing health services. Complications are often anticipated and surveillance instituted, and most are identified and remedied, as required by national standards;28 all are coded as post‐admission diagnoses. Higher rates are therefore expected in better performing health services and in those caring for patients with more complex needs.
Several caveats must, however, be considered. While the definition of “hospital‐acquired complication” is agnostic2,3,4 and possibly insensitive to health care errors, it does not exclude them.23,25 Higher complication rates may reflect more complex casemix and high performance, or health care errors and poor performance. Consequently, we should not abandon our national hospital‐acquired complications model. The ACSQHC algorithm12 furnishes a clinical tool for screening, monitoring, and research, while clinical practice guidelines3 establish minimum clinical standards.
Limitations
We have previously reported that complications are under‐reported,25 but we did not draw on source documents for this analysis. The dataset excluded patients under 18 years of age and admissions to hospitals without ICUs. We did not explore length of stay as an endogenous covariate,29 which may have increased the numbers of complications in our analyses. An ICC derived from a small number of groups (fewer than six) may underestimate effect size.16 Our findings may not be generalisable to other health services, or to periods of high demand or limited hospital resources.
Conclusion
Complications were frequent events in all hospitals (9.7% of hospital episodes), and were more frequent in tertiary referral hospitals and during hospital episodes including an intensive care component. We found that complication rates were determined more by patient than hospital factors. This has implications for interpreting hospital‐acquired complication reports and mitigating risk. Current approaches to quantifying hospital‐acquired complications assess hospital admission complexity rather than quality of care.
Box 1 – Categorisation of hospital‐associated complications
|
|
Dominant aetiology of hospital‐acquired complication |
||||||||||||||
|
|
Hospital factors |
Patient factors |
|||||||||||||
|
|
|||||||||||||||
|
Description |
Complication linked to suboptimal care |
Complication of disease or treatment despite optimal care |
|||||||||||||
|
Effect on length of hospital stay |
↑ |
↑ |
|||||||||||||
|
Effect on mortality risk |
↑ |
↑ |
|||||||||||||
|
Effect on health care costs |
↑ |
↑ |
|||||||||||||
|
Predictable on admission |
No |
Yes |
|||||||||||||
|
Influenced by standard care |
Yes |
No |
|||||||||||||
|
Indicator |
Safety and quality of care |
Complexity of patient needs |
|||||||||||||
|
Method of identification |
Clinical audit, adverse and sentinel events |
Clinical audit, ACSQHC hospital‐acquired complication classification system |
|||||||||||||
|
Interventions to reduce rate |
Training, education, health care resources |
Informed consent, patient selection, clinical research |
|||||||||||||
|
|
|||||||||||||||
|
ACSQHC = Australian Commission for Safety and Quality in Health Care. |
|||||||||||||||
Box 2 – Selection of hospital episodes in 38 major hospitals with intensive care units in South Australia and Victoria, 2015–2018
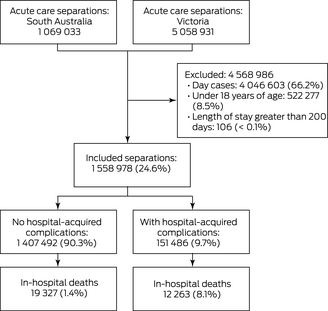
* [Correction added on 6 January 2022 after first online publication: Box 2 image has been replaced.]
Box 3 – Numbers and rates (with 95% confidence intervals) of hospital‐acquired complication events during 1 558 978 public hospital episodes in 38 major hospitals in South Australia and Victoria, 2015–2018
|
Class* |
Number of episodes† |
Number of events‡ |
Events |
Events |
|||||||||||
|
|
|||||||||||||||
|
1. Severe pressure injury |
3360 |
7015 |
0.216 (0.208–0.223) |
0.034 (0.032–0.035) |
|||||||||||
|
2. Fall resulting in injury |
1187 |
1986 |
0.076 (0.072–0.081) |
0.012 (0.011–0.013) |
|||||||||||
|
3. Hospital‐associated infection |
56 788 |
106 696 |
3.643 (3.613–3.673) |
0.566 (0.562–0.571) |
|||||||||||
|
4. Surgical complications |
21 854 |
38 060 |
1.402 (1.383–1.421) |
0.218 (0.215–0.221) |
|||||||||||
|
6. Respiratory complications |
17 676 |
37 391 |
1.134 (1.117–1.151) |
0.176 (0.173–0.179) |
|||||||||||
|
7. Venous thrombo‐embolism |
5571 |
11 560 |
0.357 (0.348–0.367) |
0.056 (0.054–0.057) |
|||||||||||
|
8. Renal failure |
33 200 |
35 039 |
2.130 (2.107–2.153) |
0.331 (0.327–0.335) |
|||||||||||
|
9. Gastrointestinal bleeding |
6706 |
12 520 |
0.430 (0.420–0.441) |
0.067 (0.065–0.068) |
|||||||||||
|
10. Medication complications |
5810 |
10 913 |
0.373 (0.363–0.382) |
0.058 (0.056–0.059) |
|||||||||||
|
11. Delirium |
28 006 |
53 357 |
1.796 (1.775–1.818) |
0.279 (0.276–0.283) |
|||||||||||
|
12. Persistent incontinence |
3640 |
7021 |
0.233 (0.226–0.241) |
0.036 (0.035–0.037) |
|||||||||||
|
13. Malnutrition |
15 425 |
27 793 |
0.989 (0.974–1.005) |
0.154 (0.151–0.156) |
|||||||||||
|
14. Cardiac complications |
2286 |
5711 |
0.147 (0.141–0.153) |
0.023 (0.022–0.024) |
|||||||||||
|
Total for classes 1–4, 6–14 |
151 486† |
214 286‡ |
9.717 (9.668–9.766) |
2.136 (2.127–2.146) |
|||||||||||
|
15. Perineal tear during delivery§* |
4778 |
4878 |
2.964 (2.881–3.050) |
0.897 (0.872–0.922) |
|||||||||||
|
|
|||||||||||||||
|
* Not included: 5. Unplanned intensive care unit admission; 16. Neonatal birth trauma. † Number of hospital episodes coded with this complication class. ‡ Number of complication events from any class coded in this subgroup. § For 23 hospitals with obstetric services and women admitted for childbirth. |
|||||||||||||||
Box 4 – Patient demographic and admission characteristics, by coding of hospital‐associated complication events for admission
|
Characteristic |
Hospital‐acquired complications reported |
No hospital‐acquired complications reported |
Standardised mean difference |
||||||||||||
|
|
|||||||||||||||
|
Episodes |
151 486 [9.7%] |
1 407 492 [90.3%] |
— |
||||||||||||
|
Hospital‐acquired complication events |
214 286 |
0 |
— |
||||||||||||
|
Patient characteristics |
|
|
|
||||||||||||
|
Age (years), median (IQR) |
72 (59–82) |
62 (39–77) |
0.505 |
||||||||||||
|
Sex (men) |
80 034 (52.8%) |
631 392 (44.8%) |
0.160 |
||||||||||||
|
Elective admissions |
41 180 (27.2%) |
259 703 (18.5%) |
0.209 |
||||||||||||
|
Indigenous Australians |
2216 (1.5%) |
23 420 (1.7%) |
–0.053 |
||||||||||||
|
In residential care |
2108 (1.4%) |
11 721 (0.8%) |
0.053 |
||||||||||||
|
Comorbid conditions |
125 317 (82.7%) |
547 117 (3.9%) |
0.500 |
||||||||||||
|
Frailty |
54 468 (40.0%) |
174 774 (1.2%) |
0.571 |
||||||||||||
|
Admission characteristics |
|
|
|
||||||||||||
|
Length of stay (days), median (IQR) |
10 (6–18) |
4 (2–6) |
0.789 |
||||||||||||
|
Intensive care during admission |
46 819 (30.9%) |
79 458 (5.6%) |
–0.692 |
||||||||||||
|
In‐hospital deaths |
12 263 (8.1%) |
19 327 (1.4%) |
0.321 |
||||||||||||
|
|
|||||||||||||||
|
IQR = interquartile range. |
|||||||||||||||
Box 5 – Conditional intra‐class correlation coefficients (with 95% confidence intervals) for patient and hospital levels, by hospital‐acquired complication class*
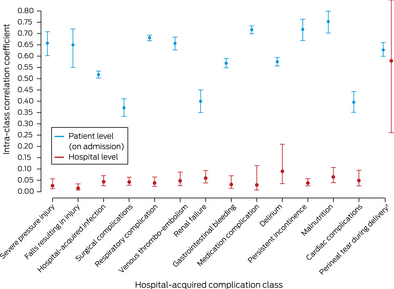
* Hospital peer group ICC values not depicted because of the graph scale; see online Supporting Information, table 5). † Includes 15 hospitals without on‐site obstetric services. [Correction added on 6 January 2022 after first online publication: Box 5 image has been replaced.]
Received 24 February 2021, accepted 8 October 2021
- Graeme J Duke1,2
- John L Moran3
- Andrew D Bersten4
- Shailesh Bihari4
- Owen Roodenburg2,5
- Jonathan Karnon6
- Steven Hirth5
- Paul Hakendorf7
- John D Santamaria8
- 1 Box Hill Hospital, Melbourne, VIC
- 2 Eastern Health Clinical School, Monash University, Melbourne, VIC
- 3 Queen Elizabeth Hospital, Adelaide, SA
- 4 Flinders Medical Centre, Adelaide, SA
- 5 Eastern Health, Melbourne, VIC
- 6 Flinders University, Adelaide, SA
- 7 Flinders Medical Centre, Adelaide, SA
- 8 St Vincent's Hospital Melbourne, Melbourne, VIC
We are grateful to Terri Jackson (Melbourne Institute of Applied Social and Economic Research, University of Melbourne) for her comments and advice, to all health information managers who undertook the coding of patient records, and to the health departments in South Australia and Victoria and the Victorian Agency for Health Information for granting access to the data we analysed.
No relevant disclosures.
- 1. Australian Commission on Safety and Quality in Health Care. National set of high priority hospital complications. 19 Dec 2013. http://www.safetyandquality.gov.au/sites/default/files/migrated/National‐set‐of‐high‐priority‐hospital‐complications‐Dec‐2013.pdf (viewed Aug 2021).
- 2. Australian Institute of Health and Welfare. Admitted patient care 2017–18. Australian hospital statistics (Cat. no. HSE 225; Health Services Series number 90). Canberra: AIHW, 2019. https://www.aihw.gov.au/getmedia/df0abd15‐5dd8‐4a56‐94fa‐c9ab68690e18/aihw‐hse‐225.pdf (viewed Aug 2021).
- 3. Independent Hospital Pricing Authority. Pricing and funding for safety and quality. Risk adjustment model for hospital acquired complications. National efficient price determination 2020–21. Mar 2020. https://www.ihpa.gov.au/sites/default/files/publications/pricing_and_funding_for_safety_and_quality_‐_hacs.pdf (viewed Aug 2021).
- 4. Australian Commission on Safety and Quality in Health Care. HACs information kit. 2019. https://www.safetyandquality.gov.au/our‐work/indicators‐measurement‐and‐reporting/complications/hacs‐information‐kit (viewed Aug 2021).
- 5. Trentino KM, Swain SG, Burrows SA, et al. Measuring the incidence of hospital‐acquired complications and their effect on length of stay using CHADx. Med J Aust 2013; 199: 543–547. https://www.mja.com.au/journal/2013/199/8/measuring‐incidence‐hospital‐acquired‐complications‐and‐their‐effect‐length‐stay
- 6. SA Health. Integrated South Australian Activity Collection. 2018. https://www.sahealth.sa.gov.au/wps/wcm/connect/public+content/sa+health+internet/about+us/our+performance/our+data+collections/admitted+patient+care/admitted+patient+care (viewed Aug 2021).
- 7. Department of Health and Human Services (Victoria). Victorian admitted episodes dataset. Updated 4 July 2019. https://www2.health.vic.gov.au/hospitals‐and‐health‐services/data‐reporting/health‐data‐standards‐systems/data‐collections/vaed (viewed Aug 2021).
- 8. Jackson T, Duckett S, Shepheard J, Baxter K. Measurement of adverse events using “incidence flagged” diagnosis codes. J Health Serv Res Policy 2006; 11: 21–26.
- 9. Michel J, Nghiem HD, Jackson TJ. Using ICD‐10‐AM codes to characterise hospital‐acquired complications. Health Inf Manag 2009; 38: 18–25.
- 10. van Walraven C, Austin PC, Jennings A, et al. A modification of the Elixhauser comorbidity measures into a point system for hospital death using administrative data. Med Care 2009; 47: 626–633.
- 11. Gilbert T, Neuburger J, Kraindler J, et al. Development and validation of a Hospital Frailty Risk Score focusing on older people in acute care settings using electronic hospital records: an observational study. Lancet 2018; 391: 1775–1782.
- 12. Australian Commission on Safety and Quality in Health Care. Hospital‐acquired complications (HACs): specifications; version 3.0. https://www.safetyandquality.gov.au/publications‐and‐resources/resource‐library/hospital‐acquired‐complications‐hacs‐list‐specifications‐version‐31 (viewed Aug 2021).
- 13. Australian Institute of Health and Welfare. Australian hospital peer groups 2015 (Cat. no. HSE 170). Nov 2015. http://www.aihw.gov.au/reports/hospitals/australian‐hospital‐peer‐groups (viewed Aug 2021).
- 14. Kuha J. AIC and BIC: comparisons of assumptions and performance. Sociological Methods & Research 2016; 33: 188–229.
- 15. Long JS, Freese J. FITSTAT: Stata module to compute fit statistics for single equation regression models (Statistical Software Components S407201; Boston College Department of Economics). Ideas, revised 22 Feb 2001. https://ideas.repec.org/c/boc/bocode/s407201.html (viewed Aug 2021).
- 16. Liljequist D, Elfving B, Skavberg Roaldsen K. Intraclass correlation: discussion and demonstration of basic features. PLoS One 2019; 14: e0219854.
- 17. Badgery‐Parker T, Pearson SA, Dunn S, Elshaug AG. Measuring hospital‐acquired complications associated with low‐value care. JAMA Intern Med 2019; 179: 499–505.
- 18. Davis P, Lay‐Yee R, Briant R, et al. Adverse events in New Zealand public hospitals II: preventability and clinical context. N Z Med J 2003; 116: U624.
- 19. Panagioti M, Khan K, Keers RN, et al. Prevalence, severity, and nature of preventable patient harm across medical care settings: systematic review and meta‐analysis. BMJ 2019; 366: l4185.
- 20. Baines R, Langelaan M, de Bruijne M, et al. How effective are patient safety initiatives? A retrospective patient record review study of changes to patient safety over time. BMJ Qual Saf 2015; 24: 561–571.
- 21. Baker GR, Norton PG, Flintoft V, et al. The Canadian Adverse Events Study: the incidence of adverse events among hospital patients in Canada. CMAJ 2004; 170: 1678–1686.
- 22. Agency for Healthcare Research and Quality. AHRQ national scorecard on hospital‐acquired conditions :final results for 2014 through 2017. July 2020. https://www.ahrq.gov/sites/default/files/wysiwyg/professionals/quality‐patient‐safety/pfp/Updated‐hacreportFInal2017data.pdf (viewed Aug 2021).
- 23. Danks L, Duckett S. All complications should count: using our data to make hospitals safer (methodological supplement). Melbourne: The Grattan Institute, 2018. https://grattan.edu.au/wp‐content/uploads/2018/02/897‐All‐complications‐should‐count‐methodological‐supplement.pdf (viewed Aug 2021).
- 24. Zhang X, Hauck K, Zhao X. Patient safety in hospitals: a Bayesian analysis of unobserved hospital and specialty level risk factors. Health Econ 2013; 22: 1158–1174.
- 25. Duke GJ, Loughan D, De Frietas M, et al. Clinical evaluation of the national hospital acquired complication program. Intern Med J 2021; https://doi.org/10.1111/imj.15468 [online ahead of print].
- 26. Hauck K, Zhao X, Jackson T. Adverse event rates as measures of hospital performance. Health Policy 2012; 104: 146–154.
- 27. Duke GJ, Shann F, Knott C, Oberender F. Hospital‐acquired complications in critically ill patients. Crit Care Resusc 2021; 23: 285–291.
- 28. Australian Commission on Safety and Quality in Health Care. Recognising and responding to acute deterioration standard (National Safety and Quality Health Service standards). 2019. http://www.safetyandquality.gov.au/standards/nsqhs‐standards/recognising‐and‐responding‐acute‐deterioration‐standard (viewed Aug 2021).
- 29. Hauck K, Zhao X. How dangerous is a day in hospital? A model of adverse events and length of stay for medical inpatients. Med Care 2011; 49: 1068–1075.
Abstract
Objective: To quantify the prevalence of hospital‐acquired complications; to determine the relative influence of patient‐ and hospital‐related factors on complication rates.
Design, participants: Retrospective analysis of administrative data (Integrated South Australian Activity Collection; Victorian Admitted Episodes Dataset) for multiple‐day acute care episodes for adults in public hospitals.
Setting: Thirty‐eight major public hospitals in South Australia and Victoria, 2015–2018.
Main outcome measures: Hospital‐acquired complication rates, overall and by complication class, by hospital and hospital type (tertiary referral, major metropolitan service, major regional service); variance in rates (intra‐class correlation coefficient, ICC) at the patient, hospital, and hospital type levels as surrogate measures of their influence on rates.
Results: Of 1 558 978 public hospital episodes (10 029 918 bed‐days), 151 486 included a total of 214 286 hospital‐acquired complications (9.72 [95% CI, 9.67–9.77] events per 100 episodes; 2.14 [95% CI, 2.13–2.15] events per 100 bed‐days). Complication rates were highest in tertiary referral hospitals (12.7 [95% CI, 12.6–12.8] events per 100 episodes) and for episodes including intensive care components (37.1 [95% CI, 36.7–37.4] events per 100 episodes). For all complication classes, inter‐hospital variation was determined more by patient factors (overall ICC, 0.55; 95% CI, 0.53–0.57) than by hospital factors (ICC, 0.04; 95% CI, 0.02–0.07) or hospital type (ICC, 0.01; 95% CI, 0.001–0.03).
Conclusions: Hospital‐acquired complications were recorded for 9.7% of hospital episodes, but patient‐related factors played a greater role in determining their prevalence than the treating hospital.