


The known: Clinical outcomes for people hospitalised with peripheral arterial disease (PAD) are often poor and patients may require early unplanned readmission. Their frequency and the reasons for these readmissions are relatively unexplored.
The new: About one in ten PAD‐related hospitalisations in Australia and New Zealand were followed within 30 days of discharge by unplanned readmissions. The likelihood of readmission was influenced by several patient and hospitalisation factors, including potentially preventable procedural complications, cardiovascular events, and infections.
The implications: Reducing the unplanned readmission rate is important, both to minimise healthcare costs and to improve clinical outcomes for people with PAD.
More than 200 million people around the world have peripheral arterial disease (PAD), including more than 12% of people over 60 years of age.1,2 Early symptoms include limb pain during movement (claudication), and progression of atherosclerosis can lead to chronic limb‐threatening ischaemia — manifested as rest pain, ischaemia with ulceration, gangrene, and infection — that often necessitates limb amputation.3,4 People with PAD typically have poor clinical outcomes, including substantial loss of mobility1,5 and elevated risks of stroke, myocardial infarction, and death.3,4,6 In particular, the 10‐year risks of major coronary events and death (cardiovascular and all‐cause) are twice as high for people with PAD.3,4,6
Patients hospitalised with PAD are at high risk of post‐discharge complications, but few population studies have examined the frequency or causes of associated hospital readmissions.7 Unplanned readmission rates after vascular surgery are among the highest for any surgery type.8 Arterial occlusions often require endovascular or surgical revascularisation, and the risks of complications are high.9,10 In a recent American study, about one in six people hospitalised with PAD were readmitted within 30 days of discharge; procedural complications, sepsis, and diabetes were the most frequent primary readmission diagnoses.9
The 30‐day unplanned readmission rate is increasingly regarded as a measure of hospital quality of care.11,12 As little is known about the characteristics of unplanned readmissions after hospitalisation with PAD outside the United States, we investigated the characteristics of all unplanned readmissions within 30 days of hospitalisation with PAD in Australia and New Zealand, and compared these characteristics for readmissions after acute and elective PAD hospitalisations. We also assessed the patient and hospitalisation factors associated with early readmission.
Methods
We analysed hospitalisations data in the Admitted Patient Collection for each Australian state and territory and the New Zealand National Minimum Dataset (Hospital Events). These datasets include data collected by all public and most private hospitals (80%) for a standard set of variables, including hospitalisation type (elective, acute), admission and discharge dates, primary and secondary diagnoses, procedures, and patient status at discharge. In both countries, diagnoses and procedures are coded according to the International Classification of Diseases, tenth revision, Australian modification (ICD‐10‐AM) and the Australian Classification of Health Interventions (ACHI).13 An audit of discharge medical records found that accuracy of ICD‐10 coding in Australia exceeded 85%.14
Study population
We included hospitalisations of adults (18 years or older) during the period 1 January 2010 ‒ 31 December 2015 for which the primary diagnosis was PAD, or the secondary diagnosis was PAD and the primary diagnosis was diabetes with vascular complications, other peripheral vessel disease, arterial embolism and thrombosis, or ulcers. These criteria have been used previously to identify PAD‐related hospitalisations.15 Diagnoses were defined by ICD‐10‐AM codes (Supporting Information, table 1). Hospitalisations were excluded if the patients had discharged themselves against medical advice (as readmission may not reflect quality of care) or died during the hospitalisation, or had been transferred to another hospital, hospitalised with PAD during the final 30 days of the study period, or hospitalised with PAD within 30 days of an earlier hospitalisation (to ensure that the hospitalisation with PAD was not itself a readmission).
Study outcomes
The primary outcome was unplanned readmission for any reason within 30 days of hospitalisation with PAD. Secondary outcomes were the rates of all‐cause (planned and unplanned) readmissions, planned readmissions, and out‐of‐hospital deaths. Readmissions to any hospital and death within 30 days of discharge were identified by linking hospitalisations data with data for subsequent hospitalisations and deaths registry data. In Australia, records were linked by state‐specific data linkage units applying probabilistic matching (reported accuracy greater than 99%16); in New Zealand, all hospitalisations and deaths are recorded and linked by unique, person‐specific National Health Index numbers.
Statistical analysis
We summarised data for continuous variables as means with standard deviations (SDs) or medians with interquartile ranges (IQRs), and categorical variables as counts and proportions. We assessed the statistical significance of differences between patient group characteristics in χ2, t, and Wilcoxon rank‐sum tests. We identified predictors of unplanned readmission using logistic regression. Candidate variables included age, sex, hospital status (private or public), acute PAD hospitalisation, region, presentation with chronic limb‐threatening ischaemia, PAD‐related interventions (endovascular or surgical revascularisation, or hybrid procedure), and comorbid conditions. Comorbid conditions were grouped according to the hierarchical condition category model;17 we combined the ICD‐10‐AM diagnosis codes for selected secondary diagnoses during the PAD hospitalisation and the primary and secondary diagnoses for all hospitalisations during the preceding 12 months into 180 clinically meaningful categories. Variables in the final multivariable model were selected by backward stepwise regression (P < 0.05). Goodness of model fit was quantified with the concordance statistic (C‐statistic). Odds ratios (ORs) with 95% confidence intervals (CIs) were calculated for each variable. Statistical analyses were conducted in Stata SE 13.
Ethics approval
Our study was approved by the NSW Population and Health Services Research Ethics Committee (2015/06/591), the ACT Health Department Human Research Ethics Committee (HREC) (ETH.7.15.143), the ACT Calvary Hospital HREC (20‐2015), the South Australian Department of Health and Ageing HREC (HREC/15/SAH/102), the Western Australian Department of Health HREC (2016/47), the Tasmanian Department of Health HREC (H0016011), the Northern Territory Department of Health and Menzies School of Health Research HREC (2017‐2944), and Queensland Health (Public Health Act approval, RD008025). Queensland Health and the Victorian Department of Health accepted the NSW Population and Health Services Research Ethics Committee approval. New Zealand data were analysed under a data user agreement with the Ministry of Health. A waiver of individual informed consent by patients was granted for our analysis of de‐identified data.
Results
After assessing the eligibility of 140 820 hospitalisations with PAD for our analysis, we included data for 104 979 admissions: 26 304 acute (25.1%) and 78 675 elective (scheduled) hospitalisations (74.9%). The reasons for excluding hospitalisations (multiple reasons possible) were prior hospitalisation within 30 days of index hospitalisation (23 563 hospitalisations), transfer to another hospital (11 838), in‐hospital death (2278), 30‐day follow‐up data not available (1757), and discharge against medical advice (777).
Patient and hospitalisation characteristics
The mean age of patients was higher for PAD admissions followed by unplanned readmissions (73.7 years; SD, 12.4 years) than for those that were not (73.0 years; SD, 11.7 years); the proportions of women in the two groups were similar (about 36%). The median length of stay was longer for hospitalisations followed by unplanned readmissions (5 days; IQR, 1–12 days v 1 day; IQR, 1–6 days), a smaller proportion were admissions to private hospitals (19.7% v 39.3%), and larger proportions had been of patients who presented with chronic limb‐threatening ischaemia (61.4% v 36.8%), or who had undergone surgical (18.3% v 12.5%) or hybrid procedures (5.4% v 3.5%). All examined comorbid conditions were more frequent for PAD admissions followed by unplanned readmissions (Box 1).
The median hospital length of stay was longer for acute than elective PAD hospitalisations, and the proportions involving patients with most comorbid conditions (including chronic limb‐threatening ischaemia and heart failure) larger, both for hospitalisations followed by unplanned readmissions and those that were not (Box 1).
Primary outcome
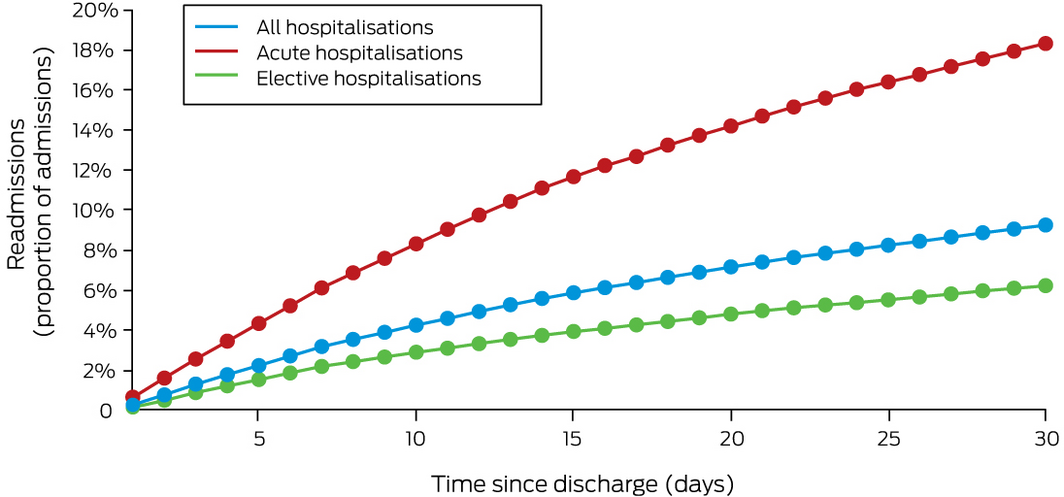
A total of 9765 hospitalisations (9.3%) were followed by at least one unplanned readmission within 30 days. Early readmissions were more frequent after acute than elective PAD hospitalisations (18.4% v 6.3%) (Box 2).
Secondary outcomes
A total of 21 193 hospitalisations (20.2%) were followed by at least one planned or unplanned readmission within 30 days; readmissions were more frequent after acute than elective PAD hospitalisations (28.3% v 17.5%). Of these readmissions, 11 428 were elective (10.9% of all hospitalisations); elective readmissions were less frequent after acute than elective PAD hospitalisations (9.9% v 11.2%). Out‐of‐hospital death within 30 days (without readmission) followed 1190 hospitalisations (1.1%); deaths were more frequent after acute than elective PAD hospitalisations (3.5% v 0.3%) (Box 2).
Time to unplanned readmission
Of 9765 unplanned readmissions within 30 days, 3395 were within one week (34.8%) and 7828 within three weeks of discharge (80.2%). The temporal distribution after acute and elective PAD hospitalisations was similar (Box 3).
Diagnoses associated with 30‐day unplanned readmissions
The 9765 unplanned readmissions were associated with more than 450 primary diagnoses, of which the twenty most frequent accounted for 6369 readmissions (65.2%). The leading primary diagnoses were atherosclerosis (1477 unplanned readmissions, 15.3%), type 2 diabetes (1057, 10.8%) and “complications of procedures not elsewhere classified” (963, 9.9%); less frequent were other procedural complications (569, 5.8%) and infections such as cellulitis (302, 3.1%), pneumonia (204, 2.1%), and sepsis (177, 1.8%) (Box 4). Readmission diagnoses following acute and elective PAD hospitalisations were similar (Supporting Information, tables 2 and 3).
Predictors of unplanned readmission
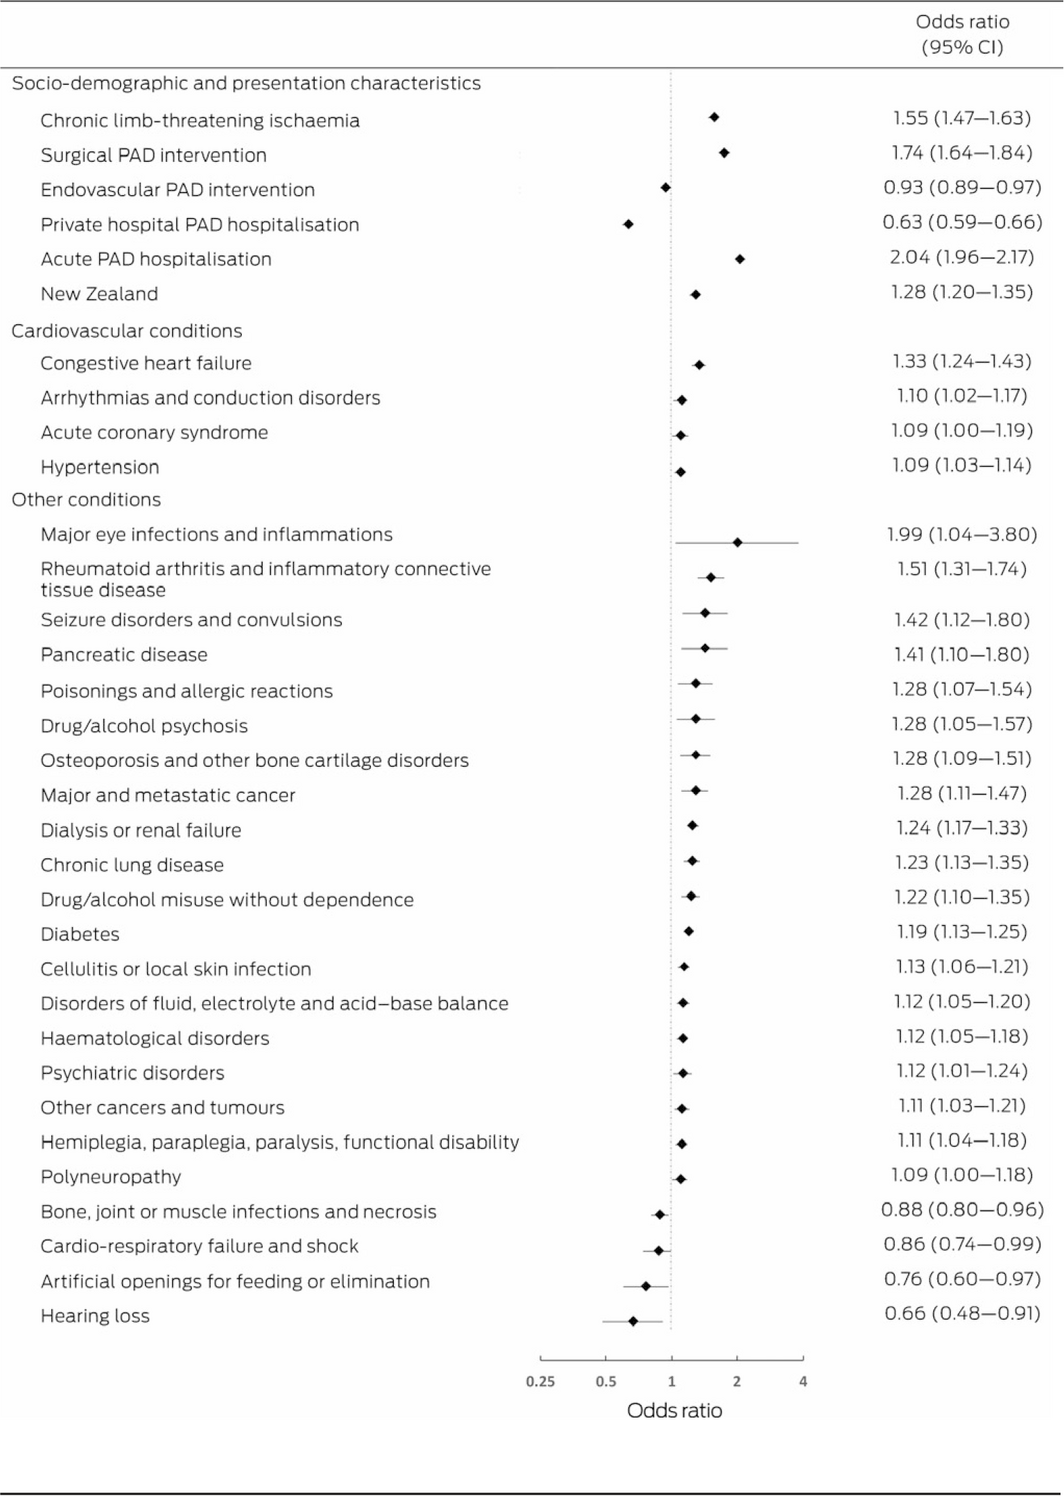
Thirty‐three patient and hospitalisation characteristics were independently associated with the risk of unplanned readmission (C‐statistic, 0.727). Acute PAD hospitalisation (OR, 2.04; 95% CI, 1.96–2.17), surgical intervention during PAD hospitalisation (OR, 1.74; 95% CI, 1.64–1.84), and chronic limb‐threatening ischaemia (OR, 1.55; 95% CI, 1.47–1.63) were associated with increased likelihood of readmission; treatment in a private hospital was associated with reduced likelihood (OR, 0.63; 95% CI, 0.59–0.66) (Box 5).
Cardiovascular conditions, including congestive heart failure (OR, 1.33; 95% CI, 1.24–1.43), arrhythmias and conduction disorders (OR, 1.10; 95% CI, 1.02–1.17), acute coronary syndrome (OR, 1.09; 95% CI, 1.00–1.19), and hypertension (OR, 1.09; 95% CI, 1.03–1.14), were each associated with increased likelihood of readmission. Other conditions associated with greater likelihood of readmission included drug/alcohol psychosis (OR, 1.28; 95% CI, 1.05–1.57), drug/alcohol misuse without dependence (OR, 1.22; 95% CI, 1.10–1.35), major eye infections and inflammations (OR, 1.99; 95% CI, 1.04–3.80), and rheumatoid arthritis and inflammatory connective tissue disease (OR, 1.51; 95% CI, 1.31–1.74) (Box 5).
Predictors of readmission were similar for acute and elective PAD hospitalisations, except that the influence of chronic limb‐threatening ischaemia (OR, 1.69; 95% CI, 1.58–1.80 v OR, 1.19; 95% CI, 1.10–1.28) and surgical PAD intervention (OR, 2.20; 95% CI, 2.05–2.36 v OR, 1.22; 95% CI, 1.10–1.35) were each greater for elective than acute PAD hospitalisations (Supporting Information, figures 1 and 2).
Discussion
Our study is the first to assess unplanned readmissions within 30 days of hospitalisation for the treatment of PAD in Australia and New Zealand, and the most recent regarding such readmissions in any country. We found that 9.3% of hospitalisations for PAD during 2010‒2015 were followed within 30 days by unplanned readmissions; four in five readmissions were within three weeks of discharge, and readmission was three times as frequent after acute than elective hospitalisations. Many readmissions were potentially avoidable, with reasons such as procedural complications, cardiovascular events, and infections.
Previously reported 30‐day readmission rates of 11.7–21.3% referred to patients with PAD who had undergone arterial revascularisation or had chronic limb‐threatening ischaemia.9,18,19,20 In contrast, we report the unplanned 30‐day readmission rate for all patients hospitalised with PAD, regardless of disease severity and medical intervention. Population studies of predictors of readmission after hospitalisation with PAD outside Canada and the United States have not been reported. Procedural complications after PAD revascularisation are the most frequent causes of early unplanned readmission in the United States, followed by sepsis, gangrene, and complications of diabetes.9 A 2018 Canadian study found that congestive heart failure, obstructive pulmonary disease, and diabetes mellitus were associated with early readmission and death after elective bypass surgery for PAD.20 Our finding that hospitalisations for the treatment of PAD in Australia and New Zealand are often followed by readmissions linked with procedural complications, infections, and cardiovascular events complement these North American reports.
We found that almost three times as many acute as elective PAD hospitalisations are followed by early unplanned readmission. We also found that one‐third of unplanned readmissions were within one week and about 80% within three weeks of discharge. An American study found that readmissions within seven days of discharge were often associated with premature discharge or incorrect decision making during the PAD hospitalisation, and that multidisciplinary follow‐up and continuity of care were crucial for averting unplanned readmissions 8‒30 days after discharge.21 Despite the difference in readmission incidence, we found that time to and the reasons for unplanned readmission after acute and elective PAD hospitalisations were similar.
Many readmission diagnoses in our study were of potentially avoidable conditions. Type 2 diabetes was the primary diagnosis for 10.8% of readmissions, reflecting the large proportion of people with PAD who have diabetes and the adverse clinical outcomes associated with poor glycaemic control.22 The primary diagnosis was “complications of procedures, not elsewhere classified” for 9.9% of readmissions and “complications of cardiac and vascular prosthetic devices, implants and grafts” for 4.2%. The incidence of these complications could be reduced by improving post‐operative care;9 for instance, routine early follow‐up of discharged patients reduces the incidence of procedural complications in people treated for heart failure.23 Infections such as cellulitis, pneumonia, and sepsis were also frequent readmission diagnoses, and targeted interventions could avert these potentially avoidable conditions.24 For a large proportion of readmissions the major diagnoses were heart failure, acute myocardial infarction, angina, or stroke, reflecting the risk of cardiovascular events associated with PAD. Aggressive primary and secondary prevention of cardiovascular disease could improve outcomes for patients with PAD.
A broad range of patient and hospitalisation factors were associated with the risk of early unplanned readmission, several of which could be modified by lifestyle changes and improved health care. Surgical intervention during the PAD hospitalisation and chronic limb‐threatening ischaemia were associated with increased risk of rehospitalisation, possibly reflecting high rates of infection, cardiovascular events, and need for debridement in patients who are urgently hospitalised.3 Early multidisciplinary follow‐up for patients with chronic limb‐threatening ischaemia is needed to reduce the risks of unplanned readmission and poor clinical outcomes.25 In contrast, endovascular revascularisation was associated with a lower readmission rate, suggesting fewer short term complications.26 Cardiac conditions were associated with higher readmission risk, indicating that patients with PAD with cardiovascular disease require more intensive care during and after hospitalisation. Care at a private hospital was associated with lower readmission risk; differences in quality of care in public and private hospitals should be investigated. Finally, improving discharge and hospital‐to‐homecare transition practices, supported by general practice liaison officers, has been reported to reduce readmission and emergency department visit rates by 30%, and accompanied by substantial cost savings.27
Limitations
Administrative data are less specific than data collected for research purposes, but were the only national data available for assessing our research question. Further, administrative data do not capture certain patient factors that may influence readmission rates, such as pharmacotherapy and socio‐economic status. We did not account for the competing risk of out‐of‐hospital death, and may therefore have underestimated readmission risk. Clinical outcomes for people with PAD are influenced by patient factors, clinician experience, institutional care practices, and policy; further analyses are needed to fully assess the influence of these factors on clinical outcomes and the effectiveness of interventions for improving care.
Conclusion
In Australia and New Zealand, 9.3% of admissions for the treatment of PAD during 2010–2015, including 18.4% of acute admissions, were followed by unplanned readmissions within 30 days of discharge. The reasons for many readmissions were potentially preventable, including procedural complications, cardiovascular events, and infections. The number of unplanned readmissions should be reduced to improve clinical outcomes for people with PAD and to reduce health care costs.
Box 1 – Baseline characteristics of 104 979 admissions in Australia and New Zealand with peripheral arterial disease (PAD), by hospitalisation type and 30‐day unplanned readmission status
|
|
All admissions |
Acute admissions |
Elective admissions |
||||||||||||
|
Characteristic |
Unplanned readmission |
No readmission |
P |
Unplanned readmission |
No readmission |
P |
Unplanned readmission |
No readmission |
P |
||||||
|
|
|||||||||||||||
|
Number of admissions |
9765 |
95 214 |
|
4830 |
21 474 |
|
4935 |
73 740 |
|
||||||
|
Age (years), mean (SD) |
73.7 (12.4) |
73.0 (11.7) |
< 0.001 |
73.5 (13.1) |
73.8 (13.4) |
0.13 |
74 (11.7) |
72.8 (11.2) |
< 0.001 |
||||||
|
Sex (women) |
3531 (36.2%) |
33 750 (35.5%) |
0.16 |
1734 (35.9%) |
8044 (37.5%) |
0.043 |
1797 (36.4%) |
25 706 (34.9%) |
0.027 |
||||||
|
Length of stay (days), median (IQR) |
5 (1–12) |
1 (1–6) |
< 0.001 |
8 (4–15) |
8 (3–15) |
0.001 |
2 (1–7) |
1 (1–3) |
< 0.001 |
||||||
|
Hospital type (private) |
1919 (19.7%) |
37 458 (39.3%) |
< 0.001 |
360 (7.4%) |
2666 (12.4%) |
< 0.001 |
1559 (31.6%) |
34 792 (47.2%) |
< 0.001 |
||||||
|
Presentation characteristics |
|
|
|
|
|
|
|
|
|
||||||
|
Region |
|
|
< 0.001 |
|
|
< 0.001 |
|
|
< 0.001 |
||||||
|
New South Wales/Australian Capital Territory |
2693 (27.6%) |
29 526 (31.0%) |
|
1361 (28.2%) |
7257 (33.8%) |
|
1332 (27.0%) |
22 269 (30.2%) |
|
||||||
|
Western Australia |
1071 (11%) |
11 855 (12.5%) |
|
463 (9.6%) |
1755 (8.2%) |
|
608 (12.3%) |
10 100 (13.7%) |
|
||||||
|
South Australia/Northern Territory |
616 (6.3%) |
4219 (4.4%) |
|
351 (7.3%) |
1658 (7.7%) |
|
265 (5.4%) |
2561 (3.5%) |
|
||||||
|
Queensland |
1478 (15.1%) |
13 858 (14.6%) |
|
754 (15.6%) |
3170 (14.8%) |
|
724 (14.7%) |
10 688 (14.5%) |
|
||||||
|
Victoria |
1986 (20.3%) |
23 809 (25.0%) |
|
860 (17.8%) |
4055 (18.9%) |
|
1126 (22.8%) |
19 754 (26.8%) |
|
||||||
|
Tasmania |
119 (1.2%) |
962 (1.0%) |
|
67 (1.4%) |
297 (1.4%) |
|
52 (1.0%) |
665 (0.9%) |
|
||||||
|
New Zealand |
1802 (18.5%) |
10 985 (11.5%) |
|
974 (20.2%) |
3 282 (15.3%) |
|
828 (16.8%) |
7703 (10.5%) |
|
||||||
|
Chronic limb‐threatening ischaemia |
5991 (61.4%) |
35 000 (36.8%) |
< 0.001 |
3630 (75.2%) |
14 822 (69.0%) |
< 0.001 |
2361 (47.8%) |
20 178 (27.4%) |
< 0.001 |
||||||
|
Intervention |
|
|
|
|
|
|
|
|
|
||||||
|
Surgery |
1787 (18.3%) |
11 871 (12.5%) |
< 0.001 |
552 (11.4%) |
2199 (10.2%) |
0.015 |
1235 (25.0%) |
9672 (13.1%) |
< 0.001 |
||||||
|
Endovascular |
4064 (41.6%) |
52 647 (55.3%) |
< 0.001 |
1498 (31.0%) |
7600 (35.4%) |
< 0.001 |
2566 (52.0%) |
45 047 (61.1%) |
< 0.001 |
||||||
|
Hybrid |
531 (5.4%) |
3306 (3.5%) |
< 0.001 |
242 (5.0%) |
984 (4.6%) |
0.20 |
289 (5.9%) |
2322 (3.2%) |
< 0.001 |
||||||
|
PAD intervention in preceding year |
2459 (25.2%) |
23 937 (25.1%) |
0.93 |
970 (20.1%) |
4163 (19.4%) |
0.27 |
1489 (30.2%) |
19 774 (26.8%) |
< 0.001 |
||||||
|
Cardiac disease history |
|
|
|
|
|
|
|
|
|
||||||
|
Acute coronary syndrome |
834 (8.5%) |
4648 (4.9%) |
< 0.001 |
436 (9.0%) |
1424 (6.6%) |
< 0.001 |
398 (8.1%) |
3224 (4.4%) |
< 0.001 |
||||||
|
Ischaemic heart disease |
1189 (12.2%) |
8541 (9.0%) |
< 0.001 |
597 (12.4%) |
2118 (9.9%) |
< 0.001 |
592 (12.0%) |
6423 (8.7%) |
< 0.001 |
||||||
|
Heart failure |
1705 (17.5%) |
7337 (7.7%) |
< 0.001 |
1042 (21.6%) |
3278 (15.3%) |
< 0.001 |
663 (13.4%) |
4059 (5.5%) |
< 0.001 |
||||||
|
Valvular/rheumatic heart disease |
351 (3.6%) |
1952 (2.0%) |
< 0.001 |
181 (3.8%) |
648 (3.0%) |
< 0.001 |
170 (3.4%) |
1304 (1.8%) |
< 0.001 |
||||||
|
Hypertension |
4025 (41.2%) |
25 874 (27.2%) |
< 0.001 |
2187 (45.3%) |
8239 (38.4%) |
< 0.001 |
1838 (37.2%) |
17 635 (23.9%) |
< 0.001 |
||||||
|
Arrhythmia, conduction disorders |
1432 (14.7%) |
8220 (8.6%) |
< 0.001 |
765 (15.8%) |
2 781 (13%) |
< 0.001 |
667 (13.5%) |
5439 (7.4%) |
< 0.001 |
||||||
|
Stroke, transient ischaemic attack, cerebral haemorrhage |
426 (4.4%) |
2845 (3.0%) |
< 0.001 |
213 (4.4%) |
827 (3.8%) |
0.07 |
213 (4.3%) |
2018 (2.7%) |
< 0.001 |
||||||
|
Vascular disease |
4152 (42.5%) |
34 670 (36.4%) |
< 0.001 |
1875 (38.8%) |
7467 (34.8%) |
< 0.001 |
2277 (46.1%) |
27 203 (36.9%) |
< 0.001 |
||||||
|
Comorbid conditions |
|
|
|
|
|
|
|
|
|
||||||
|
Chronic lung disease |
852 (8.7%) |
4194 (4.4%) |
< 0.001 |
478 (9.9%) |
1535 (7.2%) |
< 0.001 |
374 (7.6%) |
2659 (3.6%) |
< 0.001 |
||||||
|
Pneumonia |
876 (9.0%) |
4240 (4.4%) |
< 0.001 |
497 (10.3%) |
1809 (8.4%) |
< 0.001 |
379 (7.7%) |
2431 (3.3%) |
< 0.001 |
||||||
|
Diabetes mellitus |
4008 (41.0%) |
26 344 (27.7%) |
< 0.001 |
2251 (46.6%) |
8353 (38.9%) |
< 0.001 |
1757 (35.6%) |
17 991 (24.4%) |
< 0.001 |
||||||
|
Major and metastatic cancer |
264 (2.7%) |
1470 (1.5%) |
< 0.001 |
162 (3.4%) |
578 (2.7%) |
0.012 |
102 (2.1%) |
892 (1.2%) |
< 0.001 |
||||||
|
Other cancer |
790 (8.1%) |
6892 (7.2%) |
0.002 |
385 (8.0%) |
1503 (7.0%) |
0.018 |
405 (8.2%) |
5389 (7.3%) |
0.019 |
||||||
|
Renal failure or dialysis |
2275 (23.3%) |
10 515 (11.0%) |
< 0.001 |
1309 (27.1%) |
4138 (19.3%) |
< 0.001 |
966 (19.6%) |
6377 (8.6%) |
< 0.001 |
||||||
|
Chronic liver disease |
99 (1.0%) |
399 (0.4%) |
< 0.001 |
67 (1.4%) |
196 (0.9%) |
0.003 |
32 (0.6%) |
203 (0.3%) |
< 0.001 |
||||||
|
Anaemia, other haematological disorders |
2457 (25.2%) |
12 830 (13.5%) |
< 0.001 |
1391 (28.8%) |
5046 (23.5%) |
< 0.001 |
1066 (21.6%) |
7784 (10.6%) |
< 0.001 |
||||||
|
Psychiatric disorders |
513 (5.2%) |
2445 (2.6%) |
< 0.001 |
328 (6.8%) |
1127 (5.2%) |
< 0.001 |
185 (3.8%) |
1318 (1.8%) |
< 0.001 |
||||||
|
Hemiplegia, paraplegia, paralysis, functional disability |
1888 (19.3%) |
9294 (9.8%) |
< 0.001 |
1214 (25.1%) |
4470 (20.8%) |
< 0.001 |
674 (13.7%) |
4824 (6.5%) |
< 0.001 |
||||||
|
Dementia and senility |
499 (5.1%) |
2698 (2.8%) |
< 0.001 |
370 (7.7%) |
1610 (7.5%) |
0.70 |
129 (2.6%) |
1088 (1.5%) |
< 0.001 |
||||||
|
Protein‐calorie malnutrition |
878 (9.0%) |
4443 (4.7%) |
< 0.001 |
562 (11.6%) |
2251 (10.5%) |
0.019 |
316 (6.4%) |
2192 (3.0%) |
< 0.001 |
||||||
|
|
|||||||||||||||
|
IQR = interquartile range; SD = standard deviation. |
|||||||||||||||
Box 2 – Primary and secondary study outcomes, by peripheral arterial disease hospitalisation type
|
|
All hospitalisations |
Acute hospitalisation |
Elective hospitalisation |
P* |
|||||||||||
|
|
|||||||||||||||
|
Hospitalisations |
104 979 |
26 304 |
78 675 |
|
|||||||||||
|
Thirty‐day outcomes |
|
|
|
|
|||||||||||
|
Primary outcome |
|
|
|
|
|||||||||||
|
Unplanned readmission |
9765 (9.3%) |
4830 (18.4%) |
4935 (6.3%) |
< 0.001 |
|||||||||||
|
Secondary outcomes |
|
|
|
|
|||||||||||
|
All‐cause readmission |
21 193 (20.2%) |
7438 (28.3%) |
13 755 (17.5%) |
< 0.001 |
|||||||||||
|
Elective readmission |
11 428 (10.9%) |
2608 (9.9%) |
8820 (11.2%) |
< 0.001 |
|||||||||||
|
Out‐of‐hospital death (no readmission) |
1190 (1.1%) |
931 (3.5%) |
259 (0.3%) |
< 0.001 |
|||||||||||
|
|
|||||||||||||||
|
* Acute v elective hospitalisations. |
|||||||||||||||
Box 3 – Cumulative proportions of unplanned readmissions following 104 979 peripheral arterial disease hospitalisations
Box 4 – Twenty most frequent primary diagnoses for 9765 unplanned readmissions within 30 days of peripheral arterial disease hospitalisation
|
Readmission primary diagnosis (ICD‐10‐AM code) |
Readmissions |
||||||||||||||
|
|
|||||||||||||||
|
Atherosclerosis (I70) |
1477 (15.1%) |
||||||||||||||
|
Type 2 diabetes mellitus (E11) |
1057 (10.8%) |
||||||||||||||
|
Complications of procedures, not elsewhere classified (T81) |
963 (9.9%) |
||||||||||||||
|
Complications of cardiac and vascular prosthetic devices, implants and grafts (T82) |
407 (4.2%) |
||||||||||||||
|
Heart failure (I50) |
337 (3.4%) |
||||||||||||||
|
Cellulitis (L03) |
302 (3.1%) |
||||||||||||||
|
Acute myocardial infarction (I21) |
252 (2.6%) |
||||||||||||||
|
Pneumonia, organism unspecified (J18) |
204 (2.1%) |
||||||||||||||
|
Other sepsis (A41) |
177 (1.8%) |
||||||||||||||
|
Complications peculiar to reattachment and amputation (T87) |
162 (1.7%) |
||||||||||||||
|
Osteomyelitis (M86) |
155 (1.6%) |
||||||||||||||
|
Other chronic obstructive pulmonary disease (J44) |
137 (1.4%) |
||||||||||||||
|
Ulcer of lower limb, not elsewhere classified (L97) |
131 (1.3%) |
||||||||||||||
|
Pain in throat and chest (R07) |
118 (1.2%) |
||||||||||||||
|
Angina pectoris (I20) |
105 (1.1%) |
||||||||||||||
|
Other disorders of urinary system (N39) |
103 (1.0%) |
||||||||||||||
|
Cerebral infarction (I63) |
97 (1.0%) |
||||||||||||||
|
Type 1 diabetes mellitus (E10) |
95 (1.0%) |
||||||||||||||
|
Arterial embolism and thrombosis (I74) |
90 (0.9%) |
||||||||||||||
|
Acute kidney failure (N17) |
90 (0.9%) |
||||||||||||||
|
|
|||||||||||||||
|
ICD‐10‐AM = International Classification of Diseases, tenth revision, Australian modification. |
|||||||||||||||
Received 1 February 2021, accepted 28 July 2021
- Vanessa Woelk1
- Peter Speck2
- Billingsley Kaambwa2
- Robert A Fitridge3,4
- Isuru Ranasinghe5,6
- 1 International Centre for Point‐of‐Care Testing, Flinders University, Adelaide, SA
- 2 Flinders University, Adelaide, SA
- 3 Royal Adelaide Hospital, Adelaide, SA
- 4 University of Adelaide, Adelaide, SA
- 5 The University of Queensland, Brisbane, QLD
- 6 The Prince Charles Hospital, Brisbane, QLD
Isuru Ranasinghe is supported by a National Heart Foundation of Australia Future Leader Fellowship (10186). Peter Speck is supported by a general grant from Diabetes Australia.
No relevant disclosures.
- 1. Fowkes FGR, Rudan D, Rudan I, et al. Comparison of global estimates of prevalence and risk factors for peripheral artery disease in 2000 and 2010: a systematic review and analysis. Lancet 2013; 382: 1329–1340.
- 2. Ostchega Y, Paulose‐Ram R, Dillon CF, et al. Prevalence of peripheral arterial disease and risk factors in persons aged 60 and older: Data from the National Health and Nutrition Examination Survey 1999–2004. J Am Geriatr Soc 2007; 55: 583–589.
- 3. Conte MS, Bradbury AW, Kolh P, et al; GVG Writing Group for the Joint Guidelines of the Society for Vascular Surgery, European Society for Vascular Surgery, and World Federation of Vascular Societies. Global vascular guidelines on the management of chronic limb‐threatening ischemia. Eur J Vasc Endovasc Surg 2019; 58 (1 Suppl): S1–S109.e33.
- 4. Michelson A. Peripheral vascular disease. In: Michelson A, editor. Platelets. 3rd ed. London: Elsevier, 2012; pp. 699–710.
- 5. Hardman RL, Jazaeri O, Yi J, et al. Overview of classification systems in peripheral artery disease. Semin Intervent Radiol 2014; 31: 378–388.
- 6. Ankle Brachial Index Collaboration; Fowkes FG, Murray GD, Butcher I, et al. Ankle brachial index combined with Framingham Risk Score to predict cardiovascular events and mortality: a meta‐analysis. JAMA 2008; 300: 197–208.
- 7. Labrosciano C, Air T, Tavella R, et al. Readmissions following hospitalisations for cardiovascular disease: a scoping review of the Australian literature. Aust Health Rev 2020; 44: 93–103.
- 8. Wiseman JT, Guzman AM, Fernandes‐Taylor S, et al. General and vascular surgery readmissions: a systematic review. J Am Coll Surg 2014; 219: 552–569.e2.
- 9. Secemsky EA, Schermerhorn M, Carroll BJ, et al. Readmissions after revascularization procedures for peripheral arterial disease: a nationwide cohort study. Ann Intern Med 2018; 168: 93–99.
- 10. Knighton A, Martin G, Sounderajah V, et al. Avoidable 30‐day readmissions in patients undergoing vascular surgery. BJS Open 2019; 3: 759–766.
- 11. Jencks SF, Williams MV, Coleman EA. Rehospitalizations among patients in the Medicare fee‐for‐service program. N Engl J Med 2009; 360: 1418–1428.
- 12. Hamar GB, Coberley C, Pope JE, et al. Effect of post‐hospital discharge telephonic intervention on hospital readmissions in a privately insured population in Australia. Aust Health Rev 2018; 42: 241–247.
- 13. Independent Hospital Pricing Authority. Classification of diseases and interventions. 2021. https://www.ihpa.gov.au/what‐we‐do/classification‐of‐diseases‐and‐interventions (viewed Jan 2021).
- 14. Henderson T, Shepheard J, Sundararajan V. Quality of diagnosis and procedure coding in ICD‐10 administrative data. Med Care 2006; 44: 1011–1019.
- 15. Reinecke H, Unrath M, Freisinger E, et al. Peripheral arterial disease and critical limb ischaemia: still poor outcomes and lack of guideline adherence. Eur Heart J 2015; 36: 932–938.
- 16. Holman CD, Bass AJ, Rouse IL, Hobbs MS. Population‐based linkage of health records in Western Australia: development of a health services research linked database. Aust N Z J Public Health 1999; 23: 453–459.
- 17. Pope GC, Kautter J, Ellis RP, et al. Risk adjustment of Medicare capitation payments using the CMS‐HCC model. Health Care Financ Rev 2004; 25: 119–141.
- 18. Martinez RA, Shnayder M, Parreco J, et al. Nationally representative readmission factors in patients with claudication and critical limb ischemia. Ann Vasc Surg 2018; 52: 96–107.
- 19. Kolte D, Kennedy KF, Shishehbor MH, et al. Thirty‐day readmissions after endovascular or surgical therapy for critical limb ischemia: analysis of the 2013 to 2014 nationwide readmissions databases. Circulation 2017; 136: 167–176.
- 20. de Mestral C, Salata K, Hussain MA, et al. Evaluating quality metrics and cost after discharge: a population‐based cohort study of value in health care following elective major vascular surgery. Ann Surg 2018; 270: 378–383.
- 21. Graham KL, Auerbach AD, Schnipper JL, et al. Preventability of early versus late hospital readmissions in a national cohort of general medicine patients. Ann Intern Med 2018; 168: 766–774.
- 22. Singh S, Armstrong EJ, Sherif W, et al. Association of elevated fasting glucose with lower patency and increased major adverse limb events among patients with diabetes undergoing infrapopliteal balloon angioplasty. Vasc Med 2014; 19: 307–314.
- 23. Bradley EH, Curry L, Horwitz LI, et al. Hospital strategies associated with 30‐day readmission rates for patients with heart failure. Circ Cardiovasc Qual Outcomes 2013; 6: 444–450.
- 24. Melvin JC, Smith JB, Kruse RL, Vogel TR. Risk factors for 30‐day hospital re‐admission with an infectious complication after lower‐extremity vascular procedures. Surg Infect (Larchmt) 2017; 18: 319–326.
- 25. Aydin K, Isildak M, Karakaya J, Gürlek A. Change in amputation predictors in diabetic foot disease: effect of multidisciplinary approach. Endocrine 2010; 38: 87–92.
- 26. Tsai TT, Rehring TF, Rogers RK, et al. The contemporary safety and effectiveness of lower extremity bypass surgery and peripheral endovascular interventions in the treatment of symptomatic peripheral arterial disease. Circulation 2015; 132: 1999–2011.
- 27. Jack BW, Chetty VK, Anthony D, et al. A reengineered hospital discharge program to decrease rehospitalization: a randomized trial. Ann Intern Med 2009; 150: 178–187.
Abstract
Objective: To evaluate the characteristics and predictors of unplanned readmission within 30 days of hospitalisation for the treatment of peripheral arterial disease (PAD) in Australia and New Zealand.
Design: Analysis of hospitalisations data in the Admitted Patient Collection for each Australian state and territory and the New Zealand National Minimum Dataset (Hospital Events).
Setting: All public and 80% of private hospitals in Australia and New Zealand.
Participants: Adults (18 years or older) hospitalised with a primary or conditional secondary diagnosis of PAD during 1 January 2010 ‒ 31 December 2015.
Main outcome measure: Rate of unplanned readmission (any cause) within 30 days of hospitalisation with PAD.
Results: Of 104 979 admissions included in our analysis (mean patient age, 73.7 years; SD, 12.4 years), 9765 were followed by at least one unplanned readmission within 30 days of discharge (9.3%): 3395 within one week (34.8%) and 7828 within three weeks (80.2%). The most frequent readmission primary diagnoses were atherosclerosis (1477, 15.3%), type 2 diabetes (1057, 10.8%), and “complications of procedures not elsewhere classified” (963, 9.9%). Readmission was more frequent after acute (4830 of 26 304, 18.4%) than elective PAD hospitalisations (4935 of 78 675, 6.3%), but the readmission characteristics were similar. Factors associated with greater likelihood of readmission included acute PAD hospitalisations (odds ratio [OR], 2.04; 95% CI, 1.96‒2.17), surgical intervention during the PAD hospitalisation (OR, 1.74; 95% CI, 1.64–1.84), and chronic limb‐threatening ischaemia (OR, 1.55; 95% CI, 1.47–1.63).
Conclusion: Unplanned readmissions within 30 days of hospitalisation for PAD are often for potentially preventable reasons. Their number should be reduced to improve clinical outcomes for people with PAD.