


The known: In temperate zones, influenza transmission outside winter is generally low. Unprecedented influenza case numbers were reported in NSW during the 2018–19 summer. The role of travel in influenza spread is increasingly evident, but few studies have investigated transmission “out of season”.
The new: Travel was an early driver of the 2018‒19 NSW summer epidemic; local transmission continued until season end despite the unfavourable summer conditions.
The implications: Our findings prompted a local health campaign promoting influenza vaccination before travelling overseas during the Australian summer. Influenza vaccination practices in other temperate zones could also be re‐examined.
Influenza causes a substantial proportion of the morbidity and mortality burden of vaccine‐preventable disease in Australia.1 In temperate regions such as New South Wales, the incidence of influenza follows a seasonal pattern, with an annual epidemic peak in winter (June–August) and generally low transmission at other times. An unusually high number of laboratory‐confirmed influenza cases were notified in NSW during the summer of December 2018 – February 2019: 5455 cases, almost double the number for the summer of 2017–18 (2803 cases), and three times the preceding five‐year mean of 1491 cases.2
In NSW, rapid polymerase chain reaction (PCR) testing, widely available since 2017, may have led to greater testing during the 2018–19 interseasonal period, increasing influenza detection. This does not explain, however, the concurrent rises in the numbers of emergency department presentations with influenza‐like‐illness,3 influenza outbreaks in institutions (18; preceding five‐year mean: eight), and influenza‐related deaths (27; 2017–18: three; source: unpublished NSW Health data).
Apart from the investigation of a 1998 off‐season epidemic in Alaska and Canada (linked with tourists),4 little has been published on temperate summertime influenza epidemics. The role of international travel in the global spread of influenza more generally, however, is increasingly clear. Pre‐travel vaccination during the interseasonal period in the country of origin is restricted by the limited availability of the recommended vaccine for the other geographic hemisphere and of the current local vaccine.5 Together with the waning immunity conferred by the most recent seasonal vaccine,5 this leaves a critical gap in influenza protection for summer travellers.
We assessed the extent to which the 2018–19 summer influenza epidemic in NSW was associated with recent overseas or domestic travel, or with prior vaccination against seasonal influenza, using a questionnaire built into the NSW Notifiable Conditions Information Management System (NCIMS).
Methods
New South Wales (population [2018], 7.95 million) includes a diversity of climate zones, ranging from cool temperate regions in the south to subtropical zones in the northeast. The 2018‒19 NSW summer was the warmest on record and the driest since 1984‒85.6
We conducted an unmatched case‒control study. A case was defined as a person with laboratory‐confirmed influenza and onset of illness between 1 December 2018 and 21 March 2019 notified to NSW Health. People with notified pertussis infections (confirmed or probable) during the same time period were selected as controls. As most pathology laboratories routinely test respiratory swabs for both influenza and pertussis, most people with notified pertussis are known to be influenza‐negative. Surveillance case definitions are included in the corresponding Australian guidelines.7,8
Study procedures
We excluded people for whom mobile telephone numbers were not included in their notification records, those with notifications for both influenza and pertussis, and people with multiple influenza notifications. Exploratory telephone interviews with 12 people (cases) were conducted in March 2019. To assess feasibility and response rates, the online survey questionnaire (built into the NCIMS) was pilot‐tested in April 2019 with about 30% of cases and controls; the survey link was sent to prospective participants by SMS. In May 2019, the other eligible participants were forwarded a link to a refined survey, but the key study questions were unchanged. The survey was introduced broadly as a respiratory illness investigation to reduce differential response bias. The survey was available to participants for two weeks; a reminder text message was sent to non‐responders after one week.
Study measures
Participants were asked whether they had travelled interstate or overseas in the week prior to their becoming ill, followed by questions about whether travel was overseas, interstate, or both, and a prompt to list the countries and states visited. We also asked whether in the week prior to becoming ill they had contact with anyone visiting from overseas or who had recently travelled overseas, and then similarly requested their countries of origin and travel.
For participants more than six months of age at symptom onset, we asked whether they had received an influenza vaccine during 2018. Infants under six months of age were deemed to have been vaccinated against influenza if their mother had been vaccinated during pregnancy.
We extracted participant age and sex from the notification data. “Date of onset” was the date of symptom onset (if known), and the specimen collection date otherwise.
Statistical analyses
Data were extracted from the NCIMS, de‐identified and exported to Stata 13 for cleaning and analysis. We estimated the associations between influenza notification and exposures (expressed as odds ratios [ORs] with 95% confidence intervals [CIs]), and after adjustment for potential confounders, in logistic regression analyses; multivariable model goodness of fit was assessed with Hosmer–Lemeshow tests. To detect an effect size of two (ie, OR, 2.0) with 80% power, an exposure prevalence estimate of 0.2 (for travel overseas in the control group), and α = 0.05, we calculated that a sample size of 169 participants per group was required.
Ethics approval
This investigation was conducted under the NSW Public Health Act (2010) with human research ethics committee approval for outbreak investigations by Master of Philosophy (Applied Epidemiology) scholars from the Australian National University (protocol number, 2017/909).
Results
We identified 7251 influenza notifications with date of onset during the study period, including 6743 with influenza type A (93%), of which 993 had been subtyped (15%; A/H1N1, 566 [57%]; A/H3N2, 427 [43%]). By five‐year age group, the highest notification rates were for children under 5 years of age (866 cases; rate, 1.8 per 100 000 population; complete age data not shown). A total of 2254 pertussis infections with date of onset during the study period had been notified.
Characteristics of the unmatched survey respondent samples
The survey was distributed to a total of 2806 people with notified influenza (648 valid responses received, 23%) and 796 controls (257 valid responses, 32%) in the pilot and main phases of the study. The reported age group for 45 respondents did not match that in their linked NCIMS records; two could be matched to another family member (by address and name), but 43 were excluded from our analysis (online Supporting Information, figure). The distributions of respondents by illness onset date were similar to those of the respective epidemic curves (Box 1, Box 2).
The proportion of people aged 20 to less than 60 years was larger for the cases than the controls (56% v 37%), and the proportion aged five to less than 20 years was smaller (15% v 38%). The median age for cases was 36 years (interquartile range [IQR], 11–54 years; range, one month to 86 years); for controls, it was 15 years (IQR, 7–14 years; range, two months to 78 years). More than half the respondents in each group were females (cases, 61%; controls, 58%) (Box 3).
The proportion of case respondents with influenza type A only (611 of 648, 94%) was similar to that for all notified cases. A larger proportion of cases than of controls reported travelling overseas (134, 21% v 17, 7%) or interstate (46, 7% v 7, 3%) in the week preceding onset of symptoms. A larger proportion of cases recalled contact with an overseas traveller or visitor (74, 11% v 13, 5%); 35 cases and eight controls stated that their contacts had been unwell. The proportions of respondents who received the seasonal influenza vaccine during 2018 were similar for cases (241, 37%) and controls (91, 35%). There were seven infants under six months of age (two cases, five controls); the mother of one of the infants with influenza had received an influenza vaccine during her pregnancy (Supporting Information, table).
Association of demographic and travel‐related factors with influenza notification
Age group, stage of season (December/January v February/March: OR, 0.30; 95% CI, 0.23–0.41), overseas travel (OR, 3.70; 95% CI, 2.18–6.25), interstate travel (OR, 2.73; 95% CI, 1.22–6.13), and contact with overseas visitors (OR, 2.71, 95% CI, 1.47–5.02) were each associated with increased odds of a notified influenza infection, but not sex, contact with an ill overseas visitor, or influenza vaccination (Box 4).
As the interaction between overseas travel and stage of season was statistically significant (OR, 3.55; 95% CI, 1.23–10.3), we stratified the multivariable model by stage of season (early and late summer). We included covariates for which univariate associations were evident (P < 0.25): age group, the main exposure combination variable (travel overseas or contact with an ill overseas traveller), and interstate travel.
In the first two months of summer, notified influenza was more likely among people who had travelled overseas or had contact with an ill overseas visitor or traveller in the week before symptom onset (OR, 6.67; 95% CI, 3.50–12.7); this association was more marked after adjusting for age group and interstate travel (adjusted OR [aOR], 6.99; 95% CI, 3.59–13.6). Interstate travel was also associated with notified influenza in early summer (aOR, 5.43; 95% CI, 1.81–16.3). The association between travel overseas or contact with ill overseas visitors and notified influenza was statistically significant in the second half of summer (OR, 2.09; 95% CI, 1.03–4.20), but not after adjusting for age group and interstate travel (aOR, 1.63; 95% CI, 0.79–3.35) (Box 4). The odds of notified influenza varied by age group in each of the adjusted multivariable models (post hoc joint effect tests: P < 0.001).
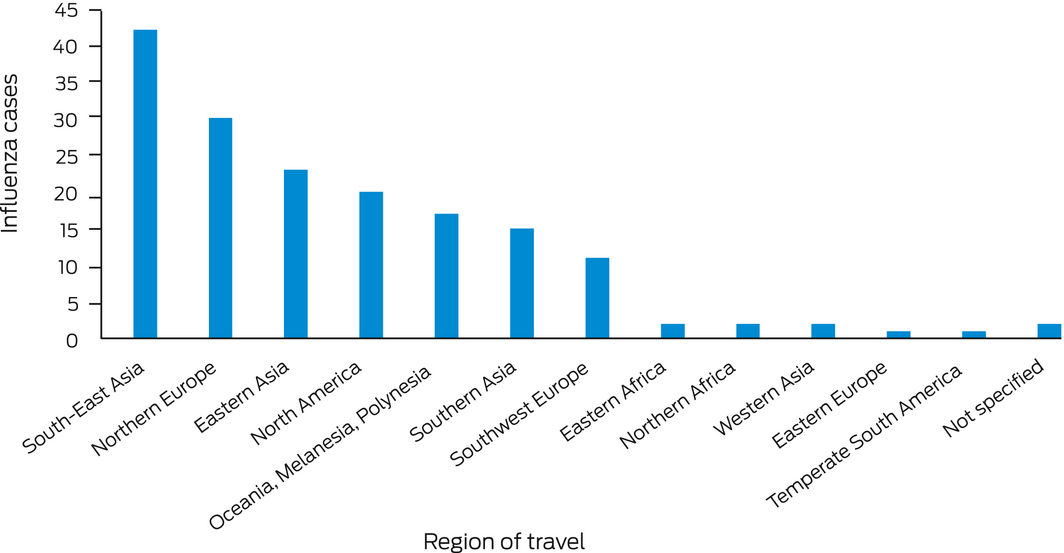
South‐East Asia was the most frequently visited of the World Health Organization (WHO) influenza transmission zones9 by people with notified influenza (42 of 134 respondents); 29 cases had visited two or more zones (Box 5). The most frequently visited countries were Singapore (20 travellers), New Zealand (15), the United States (15), and United Kingdom, Japan and Indonesia (12 each). Interstate travel was reported by 46 people with notified influenza, including to Queensland by 23 and to Victoria by 13.
Discussion
The 2018‒19 summer was marked by the largest summer influenza epidemic ever recorded in NSW; this period also saw unusually high influenza case notification rates in other Australian states and territories.10 Previous rises in influenza notifications during interseasonal periods have been attributed to higher testing rates,11,12 but this is unlikely to have been the sole factor in 2018‒19 given the simultaneous increases in influenza‐related impacts, including deaths.10 Further, the proportion of influenza tests with positive results reached 7.7% in 2018–19, higher than in previous interseasonal periods (5‐year mean, 2013‒14 to 2017‒18, 2.1%; source: unpublished NSW Health data).
In December 2018 and January 2019, people with notified influenza were seven times as likely to have travelled overseas or to have had contact with an ill overseas traveller in the week before the onset of illness than people with notified pertussis infections; this association did not apply during later summer months (February–March 2019). This could indicate that the epidemic was initially linked to influenza importation, and that local transmission played a larger role in epidemic propagation in later months.
Travel
In 2018, December was the busiest month for traveller movement into and out of Australia; 1.1 million visitors arrived for short term stays, and the most frequent destination was NSW. NSW was also home to the largest proportion of Australians returning from short term overseas trips (34%).13
Airline travel has substantially increased around the world over the past few decades with increasingly large airplanes and shorter travel times.14 Crowding on flights and in airports, as well as rapid aircraft turnaround, probably increase influenza transmission, including via fomite transmission.15
Several studies have found influenza to be the most commonly acquired vaccine‐preventable disease in travellers,16 particularly among those visiting subtropical and tropical regions.17 It has been reported that 8% of short term travellers returning to the Netherlands from tropical or subtropical zones had influenza infections,18 as did 1.2–2.8% of travellers returning to Switzerland17 and 1% of Australian travellers returning from Asia.19 In our study, South‐East Asia, a largely tropical region, was the influenza transmission zone most frequently travelled to by people with notified influenza, although some travellers may only have transited through the region. Other regions visited by people with notified influenza infections in our study included northern Europe and the United States. The 2018–19 (winter) US influenza season was described by the Centers for Disease Control and Prevention (CDC) as moderately severe and the longest in a decade.20
Interstate travel could increase exposure risk through contact with overseas travellers in airports, accommodation, tourist sites, and restaurants. In addition, tropical areas of Queensland experienced a major wet season influenza epidemic from November 2018.10
Local transmission
Local circulation of influenza during temperate summers is generally minimal because climatic conditions are less favourable for respiratory and aerosol droplet transmission.21 Our findings suggest that travel did not continue to support the epidemic throughout the summer of 2018‒19; the virus could apparently circulate locally during the persistent heat of February and March 2019, an interpretation supported by phylogenetic analyses of circulating A/H1N1 and A/H3N2 viruses throughout Australia between November 2018 and May 2019.10
Vaccination
Low population immunity may have played a role in the NSW epidemic, which followed a relatively mild 2018 winter influenza season.10 A large pool of susceptible hosts could allow transmission in warm conditions.
Vaccination during 2018 was not associated with less frequent influenza notification among our survey responders. Immunity following seasonal influenza vaccination wanes by three to six months.5 An appropriately timed pre‐travel southern hemisphere vaccine would probably have afforded some protection, even if not precisely matched to viruses circulating at the travel destination. However, stocks of the previous winter vaccine may be low by summer. The CDC recommends that travellers over six months of age not vaccinated during the preceding local influenza season be vaccinated against influenza before travelling.22 The Australian Immunisation Handbook advises that people travelling from Australia to countries experiencing an influenza epidemic can receive a second dose of the Australian seasonal influenza vaccine prior to travel.23 This recommendation, however, is little publicised. As the influenza vaccine is the most frequently refused travel vaccine,24 travel vaccination recommendations should be accompanied by an awareness‐raising campaign.
Limitations
Selection bias is inherent to case‒control studies; it will apply to our study in particular because influenza case ascertainment is incomplete. Further selection bias could result from using pertussis notifications to define controls; as the pertussis cough can persist for some time, people may have trouble recalling the illness onset date, which would result in our underestimating the prevalence of travel‐related factors in this group. Further, we included only people with recorded mobile telephone numbers, and this probably meant we undersampled older people, who are less likely to have travelled; however, this would have affected the selection of both groups.
We did not control for socio‐economic status, recognising the limitations of using residential postcodes to do so; differences in socio‐economic status between the two groups may have contributed to differences in travel behaviour.
Online survey response rates are typically low.25 We attempted to maximise the rate by keeping the survey short and by sending reminder messages. Despite the low response rate, the sample size was large enough to achieve the statistical power needed to detect relevant differences between the two groups.
Recall bias may have differed between the pilot and main study phases (one month apart), but travel recall, unlike recalling contacts with overseas visitors and travellers, would usually be supported by booking records.
Conclusions
Globalisation and high travel volumes play roles in influenza transmission and should be considered key factors for interseasonal infections and pandemic propagation. Our findings suggest that travel‐related factors were early drivers of the 2018‒19 summer epidemic in NSW and that local transmission continued despite unfavourable summer conditions. These findings informed public health messages in NSW that aimed to increase pre‐travel influenza vaccination during the summer of 2019‒20. This approach could curb import‐driven influenza transmission in future interseasonal periods.
Box 1 – Epidemic curve for influenza notifications (cases), New South Wales, 2 December 2018 – 16 March 2019, by influenza type and illness onset week, and survey responders (cases) by illness onset week*
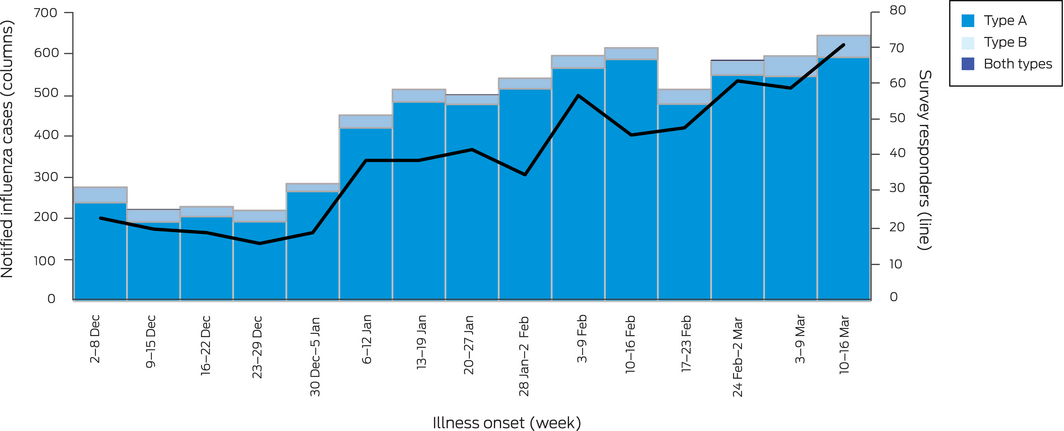
* The figure includes only notifications during standard whole reporting weeks (N = 6783); that is, notifications for 1 December and 17–21 March are not depicted, but are included in our overall analyses.
Box 2 – Epidemic curve for pertussis (probable and confirmed cases) notifications (controls), New South Wales, 2 December 2018 – 16 March 2019, and survey responders (controls), by illness onset week*
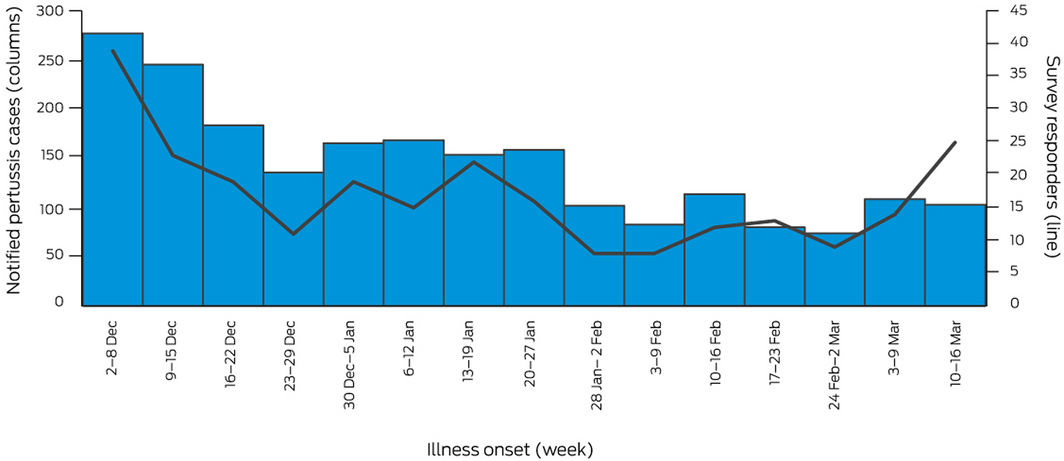
* The figure includes only notifications during standard whole reporting weeks (N = 2157); that is, notifications for 1 December and 17–21 March are not depicted, but are included in our overall analyses.
Box 3 – Demographic characteristics of cases and controls, by sampling stage
|
Characteristic |
Cases |
Controls |
|||||||||||||
|
All cases |
Invited to survey* |
Valid responses |
Proportion of all cases |
All controls |
Invited to survey* |
Valid responses |
Proportion of all controls |
||||||||
|
|
|||||||||||||||
|
Total |
7251 |
2806 |
648 |
9% |
254 |
796 |
257 |
11% |
|||||||
|
Age group (years) |
|
|
|
|
|
|
|
|
|||||||
|
0 to under 5 |
866 (12%) |
384 (14%) |
75 (12%) |
9% |
324 (14%) |
97 (12%) |
38 (15%) |
12% |
|||||||
|
5 to under 20 |
1328 (18%) |
533 (19%) |
99 (15%) |
7% |
1178 (52%) |
372 (47%) |
98 (38%) |
8% |
|||||||
|
20 to under 40 |
1775 (24%) |
820 (29%) |
187 (29%) |
11% |
272 (12%) |
135 (17%) |
42 (16%) |
15% |
|||||||
|
40 to under 60 |
1618 (22%) |
675 (24%) |
172 (27%) |
11% |
312 (14%) |
136 (17%) |
53 (21%) |
17% |
|||||||
|
60 or more |
1664 (23%) |
394 (14%) |
115 (18%) |
7% |
168 (7%) |
56 (7%) |
26 (10%) |
15% |
|||||||
|
Sex |
|
|
|
|
|
|
|
|
|||||||
|
Female |
3763 (52%) |
1459 (52%) |
396 (61%) |
11% |
1188 (53%) |
435 (55%) |
148 (58%) |
12% |
|||||||
|
Male |
3479 (48%) |
1346 (48%) |
252 (39%) |
7% |
1065 (47%) |
360 (45%) |
109 (42%) |
10% |
|||||||
|
Not stated/other |
9 (0.1%) |
1 (< 0.1%) |
0 |
— |
1 (< 0.1%) |
1 (< 0.1%) |
0 |
— |
|||||||
|
|
|||||||||||||||
|
* Invitees had mobile telephone numbers recorded with their notification data, did not have multiple influenza notifications or notifications for both pertussis and influenza with dates of onset during the study period. |
|||||||||||||||
Box 4 – Notified influenza: unadjusted and adjusted logistic regression analyses of associations with demographic and travel‐related factors, and with prior seasonal influenza vaccination
|
Characteristic |
Study period (1 Dec 2018 ‒ 21 Mar 2019) |
Early summer (December/January) |
Late summer (February/March) |
||||||||||||
|
OR (95% CI) |
aOR* (95% CI) |
OR (95% CI) |
aOR* (95% CI) |
OR (95% CI) |
aOR* (95% CI) |
||||||||||
|
|
|||||||||||||||
|
Sex (male) |
0.86 (0.64–1.16) |
— |
0.84(0.56 –1.25) |
— |
0.88 (0.55–1.40) |
— |
|||||||||
|
Age group (years) |
|
|
|
|
|
|
|||||||||
|
0 to under 5 |
1 |
1 |
1 |
1 |
1 |
1 |
|||||||||
|
5 to under 20 |
0.51 (0.31–0.83) |
0.63 (0.37–1.05) |
0.46 (0.23–0.95) |
0.60 (0.28–1.31) |
0.64 (0.32–1.30) |
0.67 (0.33–1.35) |
|||||||||
|
20 to under 40 |
2.26 (1.35–3.77) |
2.41 (1.40–4.20) |
2.74 (1.30–5.80) |
2.97 (1.33–6.65) |
2.01 (0.95–4.26) |
1.91 (0.90–4.05) |
|||||||||
|
40 to under 60 |
1.64 (1.00–2.70) |
1.96 (1.14–3.37) |
1.84 (0.91–3.71) |
2.00 (0.93–4.28) |
2.13 (0.97–4.71) |
1.96 (0.88–4.37) |
|||||||||
|
60 or more |
2.74 (1.26–4.00) |
2.24 (1.20–4.19) |
2.11 (0.95–4.69) |
1.99 (0.84–4.74) |
3.21 (1.23–8.35) |
2.85 (1.08–7.53) |
|||||||||
|
Stage of season |
|
|
|
|
|
|
|||||||||
|
Early (December/January) |
0.30 (0.23–0.41) |
0.21 (0.15–0.20) |
— |
— |
— |
— |
|||||||||
|
Late (February/March) |
1 |
1 |
— |
— |
— |
— |
|||||||||
|
Travel (overseas) |
3.70 (2.18–6.25) |
— |
6.89 (3.33–14.3) |
— |
1.94 (0.89–4.20) |
— |
|||||||||
|
Travel (interstate) |
2.73 (1.22–6.13) |
3.41 (1.46–8.00) |
5.02 (1.72–14.7) |
5.43 (1.81–16.3) |
1.44 (0.42–4.96) |
1.20 (0.34–4.29) |
|||||||||
|
Travel (interstate or overseas) |
3.86 (2.43–6.13) |
— |
7.59 (4.07–14.1) |
— |
2.03 (1.00–4.08) |
|
|||||||||
|
Contact with overseas visitor |
2.71 (1.47–5.02) |
— |
3.03 (1.34–6.86) |
— |
2.44 (0.93–6.39) |
— |
|||||||||
|
Contact with ill overseas visitor |
2.43 (0.71–8.37) |
— |
2.92 (0.54–15.6) |
— |
2.10 (0.31–14.2) |
— |
|||||||||
|
Travel overseas or contact with overseas visitor |
3.66 (2.41–5.59) |
— |
6.37 (3.58–11.3) |
— |
2.11 (1.12–3.95) |
— |
|||||||||
|
Travel overseas or contact with ill overseas visitor |
3.75 (2.34–6.00) |
4.06 (1.53–10.8) |
6.67 (3.50–12.7) |
6.99 (3.59–13.6) |
2.09 (1.03–4.20) |
1.63 (0.79–3.35) |
|||||||||
|
Overseas travel × stage of season |
3.55 (1.23–10.3) |
— |
— |
— |
— |
— |
|||||||||
|
Influenza vaccination |
1.03 (0.78–1.35) |
— |
0.99 (0.69–1.44) |
— |
1.04 (0.67–1.62) |
— |
|||||||||
|
|
|||||||||||||||
|
aOR = adjusted odds ratio; CI = confidence interval; OR = odds ratio. * Adjusted for the covariates age group, travel overseas or contact with an ill overseas traveller, and interstate travel. |
|||||||||||||||
Received 15 January 2021, accepted 22 June 2021
- Celeste K Marsh1
- Vicky Sheppeard2
- Sean Tobin2
- Robin Gilmour2
- Ross M Andrews3
- 1 Australian Department of Health, Canberra, ACT
- 2 NSW Health, Sydney, NSW
- 3 Menzies School of Health Research, Brisbane, QLD
The contribution of Celeste Marsh to this study was supported by an Australian National University Master of Philosophy (Applied Epidemiology) program scholarship, funded by her placement at the Australian Department of Health.
No relevant disclosures.
- 1. Li‐Kim‐Moy J, Yin JK, Patel C, et al. Australian vaccine preventable disease epidemiological review series: influenza 2006 to 2015. Commun Dis Intell Q Rep 2016; 40: E482–E495.
- 2. NSW Health Communicable Diseases Branch. Influenza (A, B, not specified) notifications in NSW residents, by month of disease onset. Sydney: NSW Health, 2019. https://www1.health.nsw.gov.au/IDD/#/FLU/period/%257B%2522prDisease%2522%253A%2522FLU%2522%252C%2522prLHD%2522%253A%2522X700%252CX710%252CX720%252CX730%252CX740%252CX750%252CX760%252CX770%252CX800%252CX810%252CX820%252CX830%252CX840%252CX850%252CX860%252CX910%2522%252C%2522prReportPeriod%2522%253A%25223%2522%252C%2522prStrain%2522%253A%2522A%252CB%252CNot%2520specified%2522%252C%2522prFrom%2522%253A%25221%252F2017%2522%252C%2522prTo%2522%253A%25228%252F2021%2522%257D
- 3. NSW Health. Influenza monthly epidemiology reports (December 2018; January, February, March 2019). https://www.health.nsw.gov.au/Infectious/Influenza/Pages/reports.aspx (viewed June 2019).
- 4. Uyeki TM, Zane SB, Bodnar Ulana R, et al; Alaska/Yukon Territory Respiratory Outbreak Investigation Team. Large summertime influenza A outbreak among tourists in Alaska and the Yukon Territory. Clin Infect Dis 2003; 36: 1095–1102.
- 5. Young B, Sadarangani S. Rapidly waning vaccine effectiveness for influenza: how often should we revaccinate? J Travel Med 2019; 26: tay154.
- 6. Australian Bureau of Meteorology. New South Wales in summer 2018‒19: record warm summer; very dry. Mar 2019. http://www.bom.gov.au/climate/current/season/nsw/archive/201902.summary.shtml (viewed July 2019).
- 7. Australian Department of Health. Seasonal influenza infection (CDNA national guidelines for public health units). Updated Jan 2019. https://www1.health.gov.au/internet/main/publishing.nsf/Content/cdna‐song‐influenza.htm (viewed Apr 2020).
- 8. Australian Department of Health. Pertussis (CDNA national guidelines for public health units). Updated May 2015. https://www1.health.gov.au/internet/main/publishing.nsf/Content/cdna‐song‐pertussis.htm (viewed Apr 2020).
- 9. World Health Organization. Influenza transmission zones. Updated Sept 2018. https://www.who.int/influenza/surveillance_monitoring/updates/Influenza_Transmission_Zones20180914.pdf (viewed June 2019).
- 10. Barr IG, Deng YM, Grau ML, et al. Intense interseasonal influenza outbreaks, Australia, 2018/19. Euro Surveill 2019; 24: 1900421.
- 11. Kelly HA, Grant KA, Tay EL, et al. The significance of increased influenza notifications during spring and summer of 2010–11 in Australia. Influenza Other Respir Viruses 2013; 7: 1136–1141.
- 12. Moa AM, Adam DC, MacIntyre CR. Inter‐seasonality of influenza in Australia. Influenza Other Respir Viruses 2019; 13: 459–464.
- 13. Australian Bureau of Statistics. 3401.0. Overseas arrivals and departures, Australia, Dec 2018. Feb 2019. https://www.abs.gov.au/ausstats/abs@.nsf/Previousproducts/3401.0Feature%20Article1Dec%202018?opendocument&tabname=Summary&prodno=3401.0&issue=Dec%202018&num=&view= (viewed July 2019).
- 14. Houghton F. Geography, global pandemics and air travel: faster, fuller, further and more frequent. J Infect Public Health 2019; 12: 448.
- 15. Browne A, Ahmad SS, Beck CR, Nguyen‐Van‐Tam JS. The roles of transportation and transportation hubs in the propagation of influenza and coronaviruses: a systematic review. J Travel Med 2016; 23: tav002.
- 16. Steffen R, Behrens RH, Hill DR, et al. Vaccine‐preventable travel health risks: what is the evidence; what are the gaps? J Travel Med 2014; 22: 1–12.
- 17. Mutsch M, Tavernini M, Marx A, et al. Influenza virus infection in travelers to tropical and subtropical countries. Clin Infect Dis 2005; 40: 1282–1287.
- 18. Belderok SM, Rimmelzwaan GF, van den Hoek A, Sonder GJ. Effect of travel on influenza epidemiology. Emerg Infect Dis 2013; 19: 925.
- 19. Ratnam I, Black J, Leder K, et al. Incidence and risk factors for acute respiratory illnesses and influenza virus infections in Australian travellers to Asia. J Clin Virol 2013; 57: 54–58.
- 20. Garten R, Blanton L, Elal AIA, et al. Update: influenza activity in the United States during the 2017–18 season and composition of the 2018–19 influenza vaccine. MMWR Morb Mortal Wkly Rep 2018; 67: 634.
- 21. Tamerius JD, Shaman J, Alonso WJ, et al. Environmental predictors of seasonal influenza epidemics across temperate and tropical climates. PLoS Pathog 2013; 9: e1003194.
- 22. Centers for Disease Control and Prevention. Influenza prevention: information for travellers. Updated May 2021. https://www.cdc.gov/flu/travelers/travelersfacts.htm (viewed May 2021).
- 23. Australian Technical Advisory Group on Immunisation. Influenza (flu). In: Australian immunisation handbook. Canberra: Australian Government Department of Health, 2018. https://immunisationhandbook.health.gov.au/vaccine‐preventable‐diseases/influenza‐flu (viewed June 2019).
- 24. Lammert SM, Rao SR, Jentes ES, et al. Refusal of recommended travel‐related vaccines among US international travellers in Global TravEpiNet. J Travel Med 2016; 24: taw075.
- 25. Van Gelder MMHJ, Bretveld RW, Roeleveld N. Web‐based questionnaires: the future in epidemiology? Am J Epidemiol 2010; 172: 1292–1298.
Abstract
Objectives: To assess the extent to which the 2018–19 New South Wales summer influenza epidemic was associated with overseas or domestic travel and with seasonal influenza vaccination status.
Design, setting: Unmatched case–control study, based on an online survey distributed from the NSW Notifiable Conditions Information Management System (NCIMS) to people for whom mobile phone numbers were available.
Participants: A case was defined as a person with notified laboratory‐confirmed influenza with onset of illness between 1 December 2018 and 21 March 2019. People with notified pertussis infections (confirmed or probable) were selected as controls.
Main outcome measures: Notified influenza infection, by travel and contact with unwell overseas travellers in the week before onset of illness and seasonal influenza vaccination status (as the primary exposures).
Results: Valid survey responses were provided by 648 of 2806 invited people with notified influenza (23%) and 257 of 796 invited people with notified pertussis (32%). The demographic characteristics of the respondents were similar to those of the source population (7251 cases, 2254 controls). During the first two months of the summer of 2018‒19, notified influenza was more likely for people who had travelled overseas or had contact with an ill overseas traveller in the week before symptom onset (adjusted OR [aOR], 6.99; 95% CI, 3.59–13.6), but not during the second two months (aOR, 1.63; 95% CI, 0.79–3.35). Influenza vaccination status was not associated with the likelihood of notified influenza.
Conclusions: Travel‐related factors were early drivers of the 2018‒19 NSW summer influenza epidemic; local transmission sustained the outbreak despite unfavourable conditions later in summer. Our findings prompted re‐evaluation of recommendations for pre‐travel vaccination in NSW. The role of travel in out‐of‐season influenza outbreaks should be considered in other temperate zones.