


The known: Firearm‐related violence — self‐harm, assaults, accidents, family violence —causes both injury and death, but has not been extensively studied in Australia.
The new: During 2002‒2016, the NSW firearm‐related injury rate was more than 13 times as high for men as for women. Self‐harm injuries and deaths were more frequent among older people, men, and people living outside major cities; assault‐related injuries were more frequent among younger people, men, and people in major cities.
The implications: Strategies focused on people at particular risk of self‐harm and assault with firearms could reduce the associated injury and death rates in Australia.
An estimated 251 000 people died from firearm‐related injuries in 2016.1 Gun violence is frequently viewed through the lens of the American experience, with mass killings that attract international attention. In 2018, more than 14 000 firearm homicides were recorded in the United States.2
The Australian experience of preventing firearm‐related deaths is quite different from that of the US, and has influenced gun control debates around the world. In April 1996, 35 people were killed in Port Arthur, Tasmania, by a gunman using military‐style semi‐automatic rifles. Within 12 days, the Australian government and all state and territory governments agreed to a new national gun law standard and to initiate a mandatory buyback of newly prohibited firearms. Within a year, 659 940 semi‐automatic rifles and shotguns had been purchased and destroyed.3 Between 1996 and 2015, at least one million privately owned firearms — one‐third of the estimated national total — were seized or surrendered, and decommissioned.4
The Australian policy response was followed by a decline in the number of gun‐related deaths, from a mean rate of 3.6 per 100 000 population during 1979–1996 to 1.2 per 100 000 during 1997–2013.3 While homicides garner more attention, 70% of firearm‐related deaths in Australia are suicides.5
An even larger number of people are injured but not killed by firearms, causing pain, disability, psychological distress, and substantial medical and rehabilitation costs.6,7 Most studies of gun‐related violence have focused on deaths, disregarding non‐fatal injuries and the related use of health care. Assessing these elements are critical to understanding the overall impact of gun‐related violence.
Analyses of the immediate health care use and outcomes of firearm‐related injuries have generally been based on emergency department presentations or hospital admissions at single sites. Most studies were undertaken in the United Kingdom or the United States and were based on data sources that did not differentiate between admissions and presentations per person, so that double counting was possible.8,9,10,11,12
In this study, we investigated the burden, geographic distribution, and outcomes of firearm‐related violence in New South Wales during 2002–2016. We used multiple data sources, including data on hospitalisations, mental health care admissions, and other health encounters.
Methods
We conducted a population‐based record linkage cohort study of people injured by firearms in New South Wales during 1 January 2002 – 31 December 2016. Our data sources were the NSW Admitted Patient Data Collection, death registrations from the NSW Register of Births Deaths and Marriages, and the NSW Mental Health Ambulatory Data Collection (further details: online Supporting Information).13 Firearms licence data were derived from the 2019 annual report of the NSW Police Force Firearms Registry, which includes information on firearms licensing and ownership, including numbers of firearm licence holders by postcode.14
Study population
The NSW Centre for Health Record Linkage (CHeReL) provided de‐identified data for our analysis. CHeReL identified people with recorded diagnoses of firearm injuries in the NSW Admitted Patient Data Collection (International Classification of Diseases, revision 10, Australian modification [ICD‐10‐AM] codes W32–W34, X72–X74, X93–X95, Y22–Y24, Y35.0, Y36.4; injuries caused by air rifles were excluded) or in cause of death fields in death registrations during 2002–2016, and probabilistically linked their health records to records for hospital admissions, mental health ambulatory care, and death registrations.
Data analysis
We classified firearm‐related injuries by intent as assault, intentional self‐harm, accidental, or undetermined or “other” (legal intervention or military operations) according to ICD‐10‐AM codes. We identified the number of people admitted to hospital, the body regions injured and type of firearm used (according to ICD‐10‐AM codes), and admission characteristics (length of stay, intensive care admission) in records for hospital admissions at the time of their injuries. We also determined the numbers and proportions of people who were admitted to hospital or had contact with mental health ambulatory services, the numbers of admissions, and the proportions of people with recorded mental health or behavioural conditions (ICD‐10‐AM codes F00–F99) during the two years preceding and the two years following the injury (from date of index firearm injury admission).
We report the frequencies, proportions, and rates of firearm injuries by intent category and by socio‐demographic characteristics (age, sex, postcode‐based remoteness15 and socio‐economic status [Index of Relative Socio‐economic Disadvantage16]). When more than one firearm‐related injury was recorded, we included the first injury if the intent category was the same for all injuries; injuries with different intent were each included in the relevant intent categories. Rates of injury were defined as the mean annual number of injured persons divided by the relevant estimated population at the midpoint of the study period, using the Australian Bureau of Statistics TableBuilder function (www.abs.gov.au/websitedbs/censushome.nsf/home/tablebuilder). We calculated the mean annual percentage change in firearm injury rate using annual population denominators in negative binomial regression analyses. We also calculated the numbers and proportions of people who died as a result of their injuries and the types of firearm (smaller or larger firearms) used.
We determined the proportion and rate of licence holders by geographic area from the number of firearm licence holders with registered firearms (by postcode) in the NSW Police Firearm Registry report. Numbers of firearm holders, and of intentional self‐harm and assault injuries, were then aggregated by statistical areas level 4 (SA4s),17 and population rates estimated. The statistical association between rates of firearm ownership and injuries in each of these two intent categories was assessed with the Pearson correlation coefficient. Analyses were conducted in SAS 9.4.
Ethics approval
The NSW Population and Health Services Research Ethics Committee approved our data analysis (2018HRE0801).
Results
During 2002‒2016, firearm‐related injuries were recorded for 2390 people in NSW. The most frequent causes of injury were assault (849 people, 36%) and intentional self‐harm (797, 33%); 506 people (21%) had accidental injuries, and 238 had injuries of undetermined or other intent. Across all intent categories, 2204 people with firearm‐related injuries were males (92.2%; rate, 4.1 per 100 000 population; females, 0.3 per 100 000 population). The male proportion was greatest for intentional self‐harm injuries (759 of 797, 95.2%); the female proportion was greatest for assaults (89 of 859, 10%). By age, overall rates of firearm‐related injury were highest among people aged 19–29 (3.9 per 100 000) and 30–39 years (3.3 per 100 000); this finding applied to all intent categories except intentional self‐harm, for which rates increased with age and were highest for people aged 60 years or more (41.5 per 100 000). The overall rate was higher in outer regional/rural/remote areas (3.8 per 100 000) than in major cities (1.6 per 100 000) and inner regional areas (1.8 per 100 000). The assault injury rate was highest for people in major cities (0.8 per 100 000); rates of intentional self‐harm (1.8 per 100 000) and accidental injuries (1.2 per 100 000) were highest in outer regional/rural/remote areas. The overall rate was lower in areas of least disadvantage (0.6 per 100 000) than in areas of greatest disadvantage (2.8 per 100 000), as were rates in each intent category (Box 1).
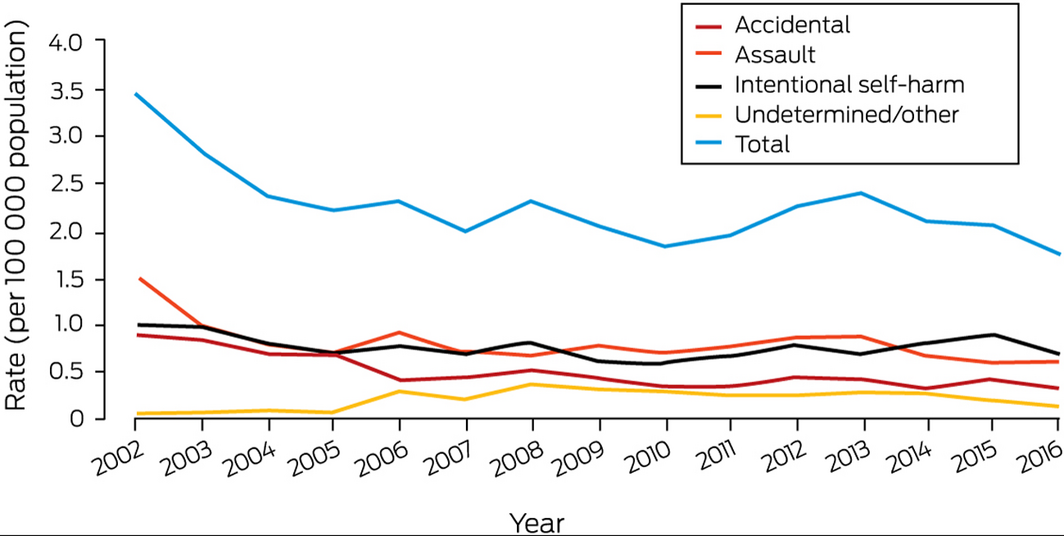
The overall firearm‐related injury rate declined from 3.4 per 100 000 population in 2002 to 1.8 per 100 000 in 2016 (mean annual change, 2.6%; 95% confidence interval, 1.3‒4.0%). The decline was greatest for injuries caused by assaults (from 1.5 to 0.6 per 100 000) or accidental events (from 0.9 to 0.3 per 100 000 population); the annual rate of intentional self‐harm injuries was stable at about 0.8 per 100 000 population (Box 2; Supporting Information, table).
Injuries to 985 people (41.2%) were caused by larger firearms (rifles, shotguns), and those to 406 people by smaller firearms (handguns) (17.0%); the firearm type was not recorded for 999 people (41.8%) (Box 3).
A total of 1071 people died of firearm‐related injuries (44.8%), including 705 of 709 people with intentional self‐harm injuries (88.5%), 213 of 849 with assault injuries (25.1%), and 74 of 506 with accidental injuries (15%) (Box 4). Overall, 1434 people with firearm injuries were admitted to hospital at the time of injury, of whom 128 died during admission (8.9%) (Box 5).
In the two years preceding injury, 706 of 1975 people had been admitted to hospital (35.7%), including 185 admitted with mental or behavioural diagnoses (9.4%); 235 had had contact with ambulatory mental health services (11.9%). Almost half of those with intentional self‐harm injuries (329 of 666, 49.4%) had been admitted to hospital in the preceding two years, including 99 with mental or behavioural conditions recorded in their admission records (15%), and 83 had had contact with ambulatory mental health services (13%) (Box 6).
Of the 1249 people alive two years after their injuries, 490 had been hospitalised again (39.4%; mean number of admissions, 2.2; standard deviation, 2.8 admissions), including 132 with mental or behavioural disorder diagnoses (10.6%); 241 had had contact with ambulatory mental health services (19.4%). The proportions of people admitted to hospital who had mental health diagnoses (23% of admitted patients) or had received outpatient care for mental health conditions (60%) were highest for people whose firearm‐related injury had been classified as intentional self‐harm (Box 6).
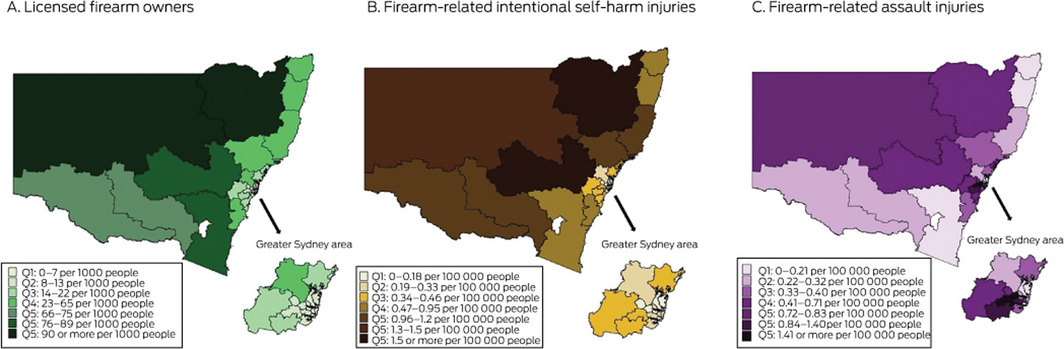
In 2019, the NSW Firearms registry recorded 239 963 firearm licence holders and 886 560 registered firearms (excluding collectors); there were 12.6 licence holders with at least one registered firearm per 1000 people in metropolitan areas, 54.4 per 1000 in inner regional areas, and 90.1 per 1000 people in outer regional/rural/remote areas. SA4 rates of intentional self‐harm injuries caused by firearms were strongly correlated with those of licensed gun owners (r = 0.94; P < 0.001), but rates of firearm‐related assault injuries were not (P = 0.23) (Box 7).
Discussion
We report one of the first studies to analyse linked administrative data to investigate gun‐related injuries as well as deaths in NSW, home to one‐third of the Australian population. There were 2390 people who sustained firearm‐related injuries during 2002–2016, fewer than half of whom died of their injuries. Rates of injuries varied by geographic area, age, sex, and the intent leading to injury. Rates of firearm‐related self‐harm injury and death were highest for older people, men, and residents of outer regional/rural/remote areas, while assault injury rates were highest in major cities, for men, and for people aged 19–30 years. Rates of self‐harm injury were steady during 2002–2016, while those for injuries caused by assaults and accidental events declined. Use of health care, particularly mental health‐related care, was not infrequent before and after firearm injuries, particularly for people who used firearms for self‐harm. Finally, firearm ownership rates by geographic area were correlated with local rates of intentional firearm‐related self‐harm injuries.
Our findings are consistent with reports from Ontario (Canada)18 that rates of self‐harm injuries using firearms were higher for older men in rural areas while those of assault injuries were higher for young urban men. Our findings are also consistent with reports that higher levels of gun ownership and access are associated with higher suicide rates.19,20 An analysis of Queensland data for 1997–2004, one of the few Australian studies on this topic, found that the rate of suicide using a firearm was about eleven times as high for people with current firearm licences than for those who had never possessed licences.21
We found that almost nine in ten intentional firearm‐related self‐harm injuries were fatal. It is estimated that 65 000 people attempt suicide in Australia each year.22 Few studies have examined firearm‐related risk factors for suicide, and recent data on rates and outcomes for people who survive attempted suicide using a firearm have not been published.21,23 Identifying risk factors, including periods of increased risk, is essential for directed interventions for reducing the number of suicide deaths.
We also found that the injured person was a female for one in ten firearm assaults. Domestic and family violence is a major health and welfare problem in Australia, and the risk of domestic partner violence escalating to homicide is 11 times as high in households with access to firearms.24 However, we had no information on the relationships between people with injuries from assaults and the firearm user, so our study provides no insights into domestic and family violence.
Rates of injury and death caused by assaults with firearms declined during 2002–2016. Despite reports that the number of guns in NSW had risen to almost one million by early 2019,25 the gun homicide rate in Australia is low (2019: 0.15 per 100 000 population)26 compared with that of the United States (2018: 4.4 per 100 000).2 A more comprehensive Australian national profile of firearm‐related violence, its relationship with socio‐demographic factors, its costs, and its impacts would help researchers and policymakers develop and test interventions and policies for reducing firearm‐related violence. Similar research in the United States has been translated into significant policy reform and changes in practice, including allowing family members to request removal of firearms from people at risk of self‐harm, and has helped adoption of suicide awareness as a basic tenet of firearm safety.27
Limitations
The population data sources we included in our linkage study to ascertain the numbers of firearm‐related injuries included all hospitalisations and deaths in NSW. However, we relied on firearm injury being recorded as the diagnosis in medical records, and being subsequently coded as such by medical coders. Further, some people with firearm‐related injuries may live in NSW but have travelled interstate for hospital care. A data linkage study of cross‐border hospital use in Australia estimated that 3% of hospitalised patients travelled interstate for their admissions (in NSW, particularly those living in the far north or west of the state).28 Finally, we did not include non‐fatal injuries treated outside hospital, such as minor injuries that could be managed in primary care. All these factors may have depressed our estimates of injury rates.
Conclusion
Our preliminary investigation provides novel information about the extent and characteristics of firearm‐related injuries in NSW. While we can draw on the international literature to apprise us of the risks for and impacts of gun violence, the unique Australian legislative framework regulating gun ownership makes analyses of local data important for ensuring that nationally relevant findings inform discussions of gun policy in Australia.
Box 1 – Demographic characteristics of people with reported firearm‐related injuries, New South Wales, 2002–2016, by intent category
|
|
Intent category* |
|
|||||||||||||
|
|
Assault |
Intentional self‐harm |
Accidental |
Undetermined/other |
Total |
||||||||||
|
Characteristic |
Number |
Rate† |
Number |
Rate† |
Number |
Rate† |
Number |
Rate† |
Number |
Rate† |
|||||
|
|
|||||||||||||||
|
Total number |
849‡ |
— |
797§ |
— |
506 |
— |
238 |
— |
2390 |
— |
|||||
|
Age (years) |
|
|
|
|
|
|
|
|
|
|
|||||
|
0–18 |
71 |
0.3 |
18 |
0.1 |
85 |
0.3 |
22 |
0.1 |
196 |
0.8 |
|||||
|
19–29 |
358 |
2.1 |
74 |
0.4 |
143 |
0.9 |
84 |
0.5 |
659 |
3.9 |
|||||
|
30–39 |
222 |
1.5 |
107 |
0.7 |
106 |
0.7 |
59 |
0.4 |
494 |
3.3 |
|||||
|
40–49 |
128 |
0.9 |
132 |
0.9 |
65 |
0.4 |
26 |
0.2 |
351 |
2.4 |
|||||
|
50–59 |
47 |
0.3 |
134 |
1.0 |
49 |
0.4 |
22 |
0.2 |
252 |
1.9 |
|||||
|
60 or more |
22 |
0.1 |
331 |
1.6 |
58 |
0.3 |
25 |
0.1 |
436 |
2.1 |
|||||
|
Missing data |
1 |
— |
1 |
— |
0 |
— |
0 |
— |
2 |
— |
|||||
|
Sex |
|
|
|
|
|
|
|
|
|
|
|||||
|
Male |
760 |
1.4 |
759 |
1.4 |
466 |
0.9 |
155 |
0.29 |
2204 |
4.1 |
|||||
|
Female |
89 |
0.2 |
38 |
0.1 |
40 |
0.1 |
13 |
0.02 |
186 |
0.3 |
|||||
|
Location of residence14 |
|
|
|
|
|
|
|
|
|
|
|||||
|
Major city |
643 |
0.8 |
197 |
0.3 |
216 |
0.3 |
147 |
0.2 |
1203 |
1.6 |
|||||
|
Inner regional |
60 |
0.3 |
169 |
0.8 |
107 |
0.5 |
35 |
0.2 |
371 |
1.8 |
|||||
|
Outer regional/rural/remote |
36 |
0.5 |
114 |
1.8 |
86 |
1.2 |
19 |
0.3 |
265 |
3.8 |
|||||
|
Missing data¶ |
110 |
— |
317 |
— |
97 |
— |
37 |
— |
551 |
— |
|||||
|
Socio‐economic disadvantage (quintile)15¶ |
|
|
|
|
|
|
|
|
|
|
|||||
|
1 (most disadvantaged) |
351 |
1.4 |
129 |
0.5 |
124 |
0.5 |
75 |
1.4 |
679 |
2.8 |
|||||
|
2 |
103 |
0.5 |
107 |
0.5 |
89 |
0.4 |
32 |
0.5 |
331 |
1.6 |
|||||
|
3 |
142 |
0.9 |
128 |
0.8 |
89 |
0.5 |
42 |
0.9 |
401 |
2.5 |
|||||
|
4 |
83 |
0.5 |
86 |
0.6 |
67 |
0.4 |
22 |
0.5 |
258 |
1.7 |
|||||
|
5 (least disadvantaged) |
60 |
0.2 |
40 |
0.2 |
40 |
0.1 |
30 |
0.2 |
170 |
0.6 |
|||||
|
|
|||||||||||||||
|
* For people with more than one firearm‐related injury, only the first injury in each intent category is included, but an individual with different injury types can be included more than once in the total number. One person had separate assault‐related and intentional self‐harm injuries; two people each had separate accidental and intentional self‐harm injuries. † Per 100 000 population. ‡ 851 injury events (two people each had two distinct injuries classified as assault). § 798 injury events (one person with two distinct injuries classified as intentional self‐harm). ¶ Postcode information was missing for 551 people (incomplete information in the deaths records); location of residence and socio‐economic disadvantage could therefore not be determined. |
|||||||||||||||
Box 3 – People with reported firearm‐related injuries, New South Wales, 2002–2016, by firearm type
|
Firearm type |
Assault |
Intentional self‐harm |
Accidental |
Undetermined/ |
Total |
||||||||||
|
|
|||||||||||||||
|
All firearms |
849 |
797 |
506 |
238 |
2390 |
||||||||||
|
Larger firearms (rifles, shotguns) |
211 (24.9%) |
541 (68%) |
198 (39%) |
35 (15%) |
985 (41.2%) |
||||||||||
|
Smaller firearms (handguns) |
222 (26.1%) |
98 (12%) |
61 (12%) |
25 (10%) |
406 (17.0%) |
||||||||||
|
Unspecified |
416 (49.0%) |
158 (20%) |
247 (49%) |
178 (75%) |
999 (41.8%) |
||||||||||
|
|
|||||||||||||||
|
|
|||||||||||||||
Box 4 – Outcomes of firearm‐related injuries, New South Wales, 2002–2016, by intent category
|
Outcome of firearm injury |
Assault |
Intentional self‐harm |
Accidental |
Undetermined/ |
Total |
||||||||||
|
|
|||||||||||||||
|
Total number of injuries |
849 |
797 |
506 |
238 |
2390 |
||||||||||
|
Deaths |
213 (25.1%) |
705 (88.5%) |
74 (15%) |
79 (33%) |
1071 (44.8%) |
||||||||||
|
During hospital admission |
44 (5.2%) |
68 (8.5%) |
16 (3%) |
0 |
128 (5.4%) |
||||||||||
|
Outside hospital |
169* (19.9%) |
637 (79.9%) |
58 (11%) |
79 (33%) |
943 (39.5%) |
||||||||||
|
Non‐fatal outcomes |
636 (74.9%) |
92 (12%) |
432† (85%) |
159 (67%) |
1319 (55.2%) |
||||||||||
|
|
|||||||||||||||
|
* Three people admitted to hospital died of their injuries after leaving hospital. † Sixteen people presented to hospital but were not admitted. |
|||||||||||||||
Box 5 – Hospital admissions of people with firearm‐related injuries, New South Wales, 2002–2016, by intent category
|
|
Intent category* |
|
|||||||||||||
|
Characteristic |
Assault |
Intentional self‐harm |
Accidental |
Undetermined/other |
Total |
||||||||||
|
|
|||||||||||||||
|
People admitted to hospital |
683 |
160 |
432 |
159 |
1434 |
||||||||||
|
Discharged alive |
639 (93.6%) |
92 (58%) |
416 (96.3%) |
159 (100%) |
1306 (91.1%) |
||||||||||
|
Died in hospital |
44 (6.4%) |
68 (42%) |
16 (3.7%) |
0 |
128 (8.9%) |
||||||||||
|
Body region injured† † |
|
|
|
|
|
||||||||||
|
Head and neck |
160 (23.4%) |
113 (70.6%) |
53 (12%) |
30 (19%) |
356 (24.8%) |
||||||||||
|
Trunk |
291 (42.6%) |
27 (17%) |
75 (17%) |
51 (32%) |
444 (31.0%) |
||||||||||
|
Upper limb |
202 (29.6%) |
11 (6.9%) |
158 (36.6%) |
47 (30%) |
418 (29.1%) |
||||||||||
|
Lower limb |
334 (48.9%) |
10 (6.3%) |
197 (45.6%) |
78 (49%) |
619 (43.2%) |
||||||||||
|
People admitted to intensive care |
105 (15.4%) |
57 (36%) |
30 (6.9%) |
20 (13%) |
212 (14.8%) |
||||||||||
|
Length of stay (days), mean (SD) |
|
|
|
|
|
||||||||||
|
Died in hospital |
1.1 (0.9) |
2.6 (9.4) |
6.6 (14.7) |
— |
2.6 (8.7) |
||||||||||
|
Discharged from hospital alive |
15.5 (47.7) |
32.3 (76.7) |
8.0 (31.7) |
10.0 (23.9) |
13.7 (44.2) |
||||||||||
|
Length of stay (days), median (IQR) |
|
|
|
|
|
||||||||||
|
Died in hospital |
1 (1–1) |
1 (1–1) |
1 (1–1) |
— |
1 (1–1) |
||||||||||
|
Discharged from hospital alive |
4 (1–10) |
10.5 (1–32) |
2 (1–5) |
2.0 (1–7) |
3 (1–9) |
||||||||||
|
|
|||||||||||||||
|
IQR = interquartile range; SD = standard deviation. * Based on person’s first event for each type of injury. † More than one region for an individual possible. |
|||||||||||||||
Box 6 – Health service use during the two years preceding and the two years following a firearm‐related injury, New South Wales, 2002–2016, by intent category
|
|
Intent category |
|
|||||||||||||
|
|
Assault |
Intentional self‐harm |
Accidental |
Undetermined/ |
Total |
||||||||||
|
|
|||||||||||||||
|
Two years preceding the injury |
|
|
|
|
|
||||||||||
|
People with firearm‐related injuries, 2004‒2016 |
682 |
666 |
397 |
230 |
1975 |
||||||||||
|
Admitted to hospital |
200 (29.3%) |
329 (49.4%) |
95 (24%) |
82 (12%) |
706 (35.7%) |
||||||||||
|
Number of admissions |
351 |
884 |
171 |
122 |
1528 |
||||||||||
|
Mean (SD) |
1.8 (1.5) |
2.7 (2.7) |
1.8 (1.5) |
2.0 (1.4) |
2.2 (2.2) |
||||||||||
|
Median (IQR) |
1 (1–2) |
2 (1–3) |
1 (1–2) |
1.0 (1–3) |
1 (1–3) |
||||||||||
|
Admitted with mental health diagnosis |
45 (6.6%) |
99 (15%) |
17 (4.3%) |
24 (13%) |
185 (9.4%) |
||||||||||
|
Contact with mental health ambulatory services |
79 (12%) |
88 (13%) |
26 (6.5%) |
42 (18%) |
235 (11.9%) |
||||||||||
|
Two years following the injury |
|
|
|
|
|
||||||||||
|
People with firearm‐related injuries, 2002‒2014 |
801 |
745 |
452 |
226 |
2224 |
||||||||||
|
Died of injury within two years |
200 (25.0%) |
655 (87.9%) |
43 (9.5%) |
77 (34%) |
975 (43.8%) |
||||||||||
|
People with firearm‐related injuries, 2002‒2014 and alive at two years |
601 |
90 |
409 |
149 |
1249 |
||||||||||
|
Admitted to hospital (apart from firearm‐related injury admission) |
236 (39.3%) |
43 (48%) |
151 (36.9%) |
60 (40%) |
490 (39.2%) |
||||||||||
|
Number of admissions |
475 |
157 |
309 |
137 |
1078 |
||||||||||
|
Mean (SD) |
2.1 (3.2) |
2.8 (2.8) |
2.0 (1.9) |
2.6 (3.1) |
2.2 (2.8) |
||||||||||
|
Median (IQR) |
1 (1–2) |
2 (1–3) |
1 (1–2) |
2.0 (1–3) |
1 (1–2) |
||||||||||
|
Admitted with mental health diagnosis |
69 (12%) |
22 (24%) |
26 (6.4%) |
15 (10%) |
132 (10.6%) |
||||||||||
|
Contact with mental health ambulatory services |
111 (18.5%) |
52 (58%) |
39 (9.5%) |
39 (26%) |
241 (19.3%) |
||||||||||
|
|
|||||||||||||||
|
IQR = interquartile range; SD = standard deviation. |
|||||||||||||||
Received 14 December 2020, accepted 9 July 2021
- Joel Negin1
- Jane Bell2
- Lorraine Ivancic2
- Philip Alpers1
- Natasha Nassar2
- 1 Sydney School of Public Health, University of Sydney, Sydney, NSW
- 2 Menzies Centre for Health Policy, University of Sydney, Sydney, NSW
No relevant disclosures.
- 1. Naghavi M, Marczak LB, Kutz M, et al. Global mortality from firearms, 1990–2016. JAMA 2018; 28: 792–814.
- 2. National Center for Health Statistics (Centers for Disease Control and Prevention). Assault or homicide. https://www.cdc.gov/nchs/fastats/homicide.htm (viewed Aug 2021).
- 3. Chapman S, Alpers P, Jones M. Association between gun law reforms and intentional firearm deaths in Australia, 1979–2013. JAMA 2016; 19: 291–299.
- 4. Alpers P, Ghazarian Z. The “perfect storm” of gun control: from policy inertia to world leader. In: Luetjens J, Mintrom M, ’t Hart P, editors. Successful public policy: lessons from Australia and New Zealand. Canberra: ANU Press, 2019; 207–233. http://press‐files.anu.edu.au/downloads/press/n5314/pdf/ch09.pdf (viewed Aug 2021).
- 5. Chapman S, Alpers P, Agho K, Jones M. Australia’s 1996 gun law reforms: faster falls in firearm deaths, firearm suicides, and a decade without mass shootings. Inj Prev 2006; 12: 365–372.
- 6. Spitzer SA, Staudenmayer KL, Tennakoon L, et al. Costs and financial burden of initial hospitalizations for firearm injuries in the United States, 2006–2014. Am J Public Health 2017; 107: 770–774.
- 7. Shultz JM, Ettman C, Galea S. Insights from population health science to inform research on firearms. Lancet Public Health 2018; 3: e213–e214.
- 8. Cook A, Osler T, Hosmer D, et al. Gunshot wounds resulting in hospitalization in the United States: 2004–2013. Injury 2017; 48: 621–627.
- 9. DiScala C, Sege R. Outcomes in children and young adults who are hospitalized for firearms‐related injuries. Pediatrics 2004; 113: 1306–1312.
- 10. Fowler KA, Dahlberg LL, Haileyesus T, Annest JL. Firearm injuries in the United States. Prev Med 2015; 79: 5–14.
- 11. Kalesan B, French C, Fagan JA, et al. Firearm‐related hospitalizations and in‐hospital mortality in the United States, 2000–2010. Am J Epidemiol 2014; 179: 303–312.
- 12. Leventhal JM, Gaither JR, Sege R. Hospitalizations due to firearm injuries in children and adolescents. Pediatrics 2014; 133: 219–225.
- 13. Centre for Health Record Linkage. Data dictionaries. https://www.cherel.org.au/data‐dictionaries (viewed Dec 2020).
- 14. NSW Firearms Registry (NSW Police Force). NSW firearms licensing and ownership information. Oct 2019. https://www.police.nsw.gov.au/__data/assets/pdf_file/0008/652967/firearms‐licensing‐and‐ownership‐information‐201910.pdf (viewed Dec 2020).
- 15. Australian Bureau of Statistics. The Australian statistical geography standard (ASGS) remoteness structure. 2016. https://www.abs.gov.au/websitedbs/d3310114.nsf/home/remoteness+structure (viewed Dec 2020).
- 16. Australian Bureau of Statistics. 2039.0. An introduction to Socio‐Economic Indexes for Areas (SEIFA), 2006. Mar 2008. http://www.abs.gov.au/websitedbs/censushome.nsf/home/seifa (viewed Dec 2020).
- 17. Australian Bureau of Statistics. Australian statistical geography standard (ASGS), volume 1. Main structure and Greater Capital City statistical areas (Cat no. 1270.0.55.001). July 2016. https://www.abs.gov.au/ausstats/abs@.nsf/mf/1270.0.55.001 (viewed Dec 2020).
- 18. Gomez D, Saunders N, Greene B, et al. Firearm‐related injuries and deaths in Ontario, Canada, 2002–2016: a population‐based study. CMAJ 2020; 192: E1253–E1263.
- 19. Ajdacic‐Gross V, Killias M, Hepp U, et al. Changing times: a longitudinal analysis of international firearm suicide data. Am J Public Health 2006; 96: 1752–1755.
- 20. Siegel M, Rothman EF. Firearm ownership and suicide rates among US men and women, 1981–2013. Am J Public Health 2016; 106: 1316–1322.
- 21. Klieve H, Sveticic J, De Leo D. Who uses firearms as a means of suicide? A population study exploring firearm accessibility and method choice. BMC Med 2009; 7: 52.
- 22. Australian Bureau of Statistics. 4326.0. National survey of mental health and wellbeing: summary of results, 2007. 23 Oct 2008. https://www.abs.gov.au/AUSSTATS/abs@.nsf/39433889d406eeb9ca2570610019e9a5/553e31e33531a7abca2574ea00122a55!OpenDocument (viewed Jan 2021).
- 23. Haines J, Williams CL, Lester D. Completed suicides: is there method in their madness? Correlates of choice of method for suicide in an Australian sample of suicides. Clin Neuropsychiatry 2010; 7: 133–140.
- 24. Spencer CM, Stith SM. Risk factors for male perpetration and female victimization of intimate partner homicide: a meta‐analysis. Trauma Violence Abuse 2020; 21: 527–540.
- 25. Gooley C. Gun ownership in NSW surges past 1 million mark just in time for state election. ABC News (Australia), updated 10 Mar 2019. https://www.abc.net.au/news/2019-03-09/gun-ownership-in-nsw-growing-fast/10886380 (viewed Jan 2021).
- 26. Alpers P, Picard M. Guns in Australia: rate of gun homicide per 100 000 people. GunPolicy.org (Sydney School of Public Health, University of Sydney), 26 July 2021. https://www.gunpolicy.org/firearms/compareyears/10/rate_of_gun_homicide (viewed Aug 2021).
- 27. Barber C, Berrigan JP, Sobelson Henn M, et al. Linking public safety and public health data for firearm suicide prevention in Utah. Health Aff (Millwood) 2019; 38: 1695–1701.
- 28. Spilsbury K, Rosman D, Alan J, et al. Cross border hospital use: analysis using data linkage across four Australian states. Med J Aust 2015; 202: 582–586. https://www.mja.com.au/journal/2015/202/11/cross-border-hospital-use-analysis-using-data-linkage-across-four-australian
Abstract
Objectives: To describe the burden, geographic distribution, and outcomes of firearm‐related violence in New South Wales during 2002–2016.
Design, setting, participants: Population‐based record linkag study of people injured by firearms in NSW, 1 January 2002 – 31 December 2016.
Main outcome measures: Frequency, proportion, and rate of firearm‐related injuries and deaths by intent category (assault, intentional self‐harm, accidental, undetermined/other) and socio‐demographic characteristics; medical service use (hospitalisations, ambulatory mental health care) before and after firearm‐related injuries; associations between rates of firearm‐related injury and those of licensed gun owners, by statistical area level 4.
Results: Firearm‐related injuries were recorded for 2390 people; for 849 people, the injuries were caused by assault (36%), for 797 by intentional self‐harm (33%), and for 506 by accidents (21%). Overall rates of firearm injuries were 4.1 per 100 000 males and 0.3 per 100 000 females; the overall rate was higher in outer regional/rural/remote areas (3.8 per 100 000) than in major cities (1.6 per 100 000) or inner regional areas (1.8 per 100 000). During 2002–2016, the overall firearm‐related injury rate declined from 3.4 to 1.8 per 100 000 population, primarily because of declines in injuries caused by assault or accidental events. The rate of self‐harm injuries with firearms were highest for people aged 60 years or more (41.5 per 100 000 population). Local rates of intentional self‐harm injuries caused by firearms were strongly correlated with those of licensed gun owners (r = 0.94).
Conclusions: Rates of self‐harm with firearms are higher for older people, men, and residents in outer regional and rural/remote areas, while those for assault‐related injuries are higher for younger people, men, and residents of major cities. Strategies for reducing injuries caused by self‐harm and assault with firearms should focus on people at particular risk.