


The known: Several risk factors influence the likelihood that a woman will develop breast cancer.
The new: Cancer detection rates at and between screens were influenced by having personal or first degree family histories of breast cancer, dense breasts, histories of certain benign breast conditions, or self‐reported breast symptoms, or using hormone replacement therapy. The effects of these risk factors differed between age groups.
The implications: The age‐specific impact of risk factors on screening and inter‐screen cancer detection rates could inform discussions about a potential role for risk‐stratified breast cancer screening.
Mammography screening is the only population level strategy for reducing the number of breast cancer deaths among women at average risk that is supported by evidence from randomised controlled trials, complemented by observational evidence of the benefit of screening programs.1 In Australia, the BreastScreen program has provided publicly funded mammography screening for more than 25 years, and currently targets women aged 50‒74 years.2
Risk‐stratified breast cancer screening is attracting increasing interest in Australia and overseas,3 and the Australian Department of Health is examining options for risk‐based approaches.4 The aim of risk‐stratified screening is to improve the benefit and possibly reduce the harms of screening by reducing the interval between screens, or by using more sensitive imaging procedures for people at higher risk while reducing screening intensity for those at lower risk.
A Cancer Council Australia overview of risk‐stratified screening identified major gaps in knowledge about the outcomes of mammographic screening of women with certain risk factors, and highlighted the need for evidence derived from Australian screening.4 Shifting mammography screening policy or practice toward risk‐stratified screening would require contemporary data on screen‐detected and interval breast cancers, stratified by risk factor, because detection of cancer, both at screening and between screening episodes, is influenced by its population incidence and the length of the inter‐screen interval.5
In this study, we estimated screen‐detected and interval breast cancer rates for BreastScreen WA program screening participants, stratified by risk factor. Our aim was to provide evidence for informing discussion of the potential role of risk‐stratified breast cancer screening in the BreastScreen program.
Methods
We undertook a retrospective cohort study, analysing routinely collected clinical and administrative data from the BreastScreen WA program in Western Australia. We included all mammography screening episodes for women aged 40 years or more during 1 July 2007 ‒ 30 June 2017.
In the BreastScreen WA program, women aged 40 years or more are eligible for free mammography every two years. Until 30 June 2013, the actively invited age group was women aged 50‒69 years; since 1 July, it has been women aged 50‒74 years. BreastScreen WA allows annual screening for women classified as being at high risk: those with a family history of breast cancer (at least two affected first degree relatives, or one first degree relative diagnosed before 50 years of age or with bilateral disease), a personal history of breast or ovarian cancer, or a diagnosis of atypical ductal hyperplasia or lobular carcinoma in situ (benign conditions associated with increased risk of breast cancer).
All BreastScreen WA program participants provide written consent to their data being used for research and quality assurance purposes at each screen.
Measurement
BreastScreen WA routinely collects (in a registration form completed by screened women) information on demographic characteristics, risk factors, and breast symptoms.6 In addition, the details and results of all screening mammograms and further assessments for recalled women are routinely recorded in the BreastScreen WA Mammographic Screening Registry.
BreastScreen WA collects information on age, postcode, screening round, time since previous screen, personal history of breast and ovarian cancer, first degree family history of breast cancer, mammographic breast density, history of benign lump excision or biopsy, hormone replacement therapy (HRT) in the past six months, and self‐reported breast symptoms (breast lump, nipple discharge, or “other concerning sensations of breast change”). BreastScreen WA records breast density only for women who had no mammographic abnormality and were not recalled for additional testing. A woman was deemed to have dense breasts if one of two radiologists who read her mammogram visually classified it as showing heterogeneously or extremely dense breasts.7 Postcode‐based socio‐economic status was determined using the Index of Relative Socio‐economic Disadvantage (IRSD) for the nearest census year.8
Outcomes
The primary outcomes were cancer detection rate at screening (CDR; per 10 000 screens) and interval cancer rate (ICR; per 10 000 women‐years), each stratified by risk factor. The secondary outcome was recall for further assessment (per 100 screens), stratified by risk factor. ICR could not be estimated by personal history of breast cancer because recurrent and second breast cancers are not routinely reported to cancer registries. As breast density was only reported for women with no abnormality in their most recent mammogram, CDR by breast density was based on density recorded at the most recent screen (within the past 27 months).
BreastScreen WA collects data on all screening participants recalled for further testing and on subsequent cancer diagnoses. Data on interval cancers are collected according to BreastScreen national accreditation standards.9 Screen‐detected cancers are defined as those detected by further testing of women with abnormal mammograms. Interval cancers are defined as those in women whose most recent screening results were negative and in whom breast cancer was diagnosed before the next scheduled screen (two years for most women; one year for women undergoing annual screening). If a woman presents with symptoms less than 730 days after screening (less than 365 days for women screened annually) and is subsequently diagnosed with a cancer in the same breast, the cancer is classified as an interval cancer.
Statistical analysis
Participant characteristics are summarised as means with standard deviations [SDs] or as proportions. We calculated overall and risk factor‐specific CDR and ICR, with 95% confidence intervals (CIs) computed using the binomial distribution. Recall rates are reported as proportions of screens.
We also estimated CDR (excluding initial screens) and ICR (all screens) by risk factor, stratified by age group, using log‐binomial regression.10 The statistical significance of differences between age groups was assessed in likelihood ratio χ2 tests for interaction (reference category: 40–49 years). First screens were excluded when calculating age‐stratified CDR because the CDR is higher in first (prevalent) screens.2
All tests of statistical significance were two‐sided. P < 0.05 was deemed statistically significant; P < 0.10 was deemed to indicate weak evidence of a difference. Statistical analyses were performed in SAS 9.4.
Ethics approval
Ethics approval was provided by the Governance, Evidence, Knowledge and Outcomes Ethics Committee, Quality Improvement, Women’s Health, Genetics and Mental Health, King Edward Memorial Hospital Women and Newborn Health Service (reference, 34263).
Results
During 1 July 2007 ‒ 30 June 2017, BreastScreen WA screened 323 082 women aged 40 years or more in 1 026 137 screening episodes (Supporting Information, table 1); 7024 cancers (5472 invasive, 1551 in situ) were detected at screening (Supporting Information, table 2), and 1866 interval cancers (1790 invasive, 76 in situ) were diagnosed. The mean age at screening was 58.5 years (SD, 8.6 years; range, 40‒98 years); 591 503 screening episodes occurred 15‒26 months after previous screening episodes (57.6%), and specific risk factors were not reported by most women (Box 1).
Overall, 38 253 screens (3.73%; 95% CI, 3.69‒3.76%) were followed by recalls for further assessment. The recall rate was higher for women aged 40‒49 years (6.26%; 95% CI, 6.13–6.38%), those undergoing first screens (9.18%; 95% CI, 9.03–9.32%), and women with self‐reported symptoms (12.6%; 95% CI, 11.9–13.2%) (Box 2).
Screening cancer detection rate
The overall screening CDR was 68 (95% CI, 67‒70) cancers per 10 000 screens. The rate increased with age group, and was higher for first screens, and for screens more than 27 months after the previous screen than for screens closer to the previous screen. The CDR was higher for women with personal or family histories of breast cancer, those with dense breasts or benign breast conditions, and women using HRT; it was highest for women with self‐reported breast symptoms (475 [95% CI, 435–516] cancers per 10 000 screens) (Box 2).
The interactions between age group and five of six examined risk factors were statistically significant: personal history of breast cancer (P = 0.039), family history of breast cancer (P = 0.005), risk‐relevant benign conditions (P = 0.012), HRT (P = 0.002), and self‐reported symptoms (P < 0.001). For example, the screening CDR was consistently higher for women reporting symptoms than for those who did not, but the difference was smallest for women aged 40‒49 years, and increased with age. For women aged 40‒49 years, the CDR was lower for those using HRT, but the opposite applied in older age groups. The interaction between age and having dense breasts was not significant (P = 0.33) (Box 3).
Interval cancer rate
The overall ICR was 9.7 (95% CI, 9.2‒10.1) cancers per 10 000 women‐years; there was no consistent relationship with age group, and the ICR was not higher for first screens than for subsequent screens. The ICR was higher for women with family histories of breast cancer, those with dense breasts or risk‐relevant benign breast conditions, and women using HRT; it was highest for women with self‐reported breast symptoms (36.7 [95% CI, 29.1–46.2] cancers per 10 000 women‐years) (Box 2).
The interaction between age and HRT use was statistically significant (P < 0.001). For example, HRT use was associated with lower ICR in women aged 40‒49 years, but with higher ICR in all other age groups. The weak interactions between age and family history of breast cancer (P = 0.07) and dense breasts (P = 0.07), and those between age and HRT use (P = 0.38) and self‐reported symptoms (P = 0.13) were not statistically significant (Box 4).
Discussion
We quantified rates of breast cancer diagnosed at mammography screening and between screens according to risk factors and age groups in a large, representative cohort of Australian women. The proportions of screen‐detected small invasive cancers (≤ 15 mm; 49% in first screens and 61% in repeat screens) were similar to those in the BreastScreen Australia performance report (48% in first screens, 61% in repeat screens2). The recall rate was modest (3.7%) and the only risk factor associated with a markedly higher recall rate was reporting breast‐related symptoms (12.6%). The CDR was higher for women with first degree family histories of breast cancer, personal histories of risk‐relevant benign breast conditions, dense breasts, and self‐reported breast symptoms, as well as for those using HRT, which was also associated with a higher ICR, as were family history and dense breasts (albeit not statistically significantly).
We found that the influence of risk factors on screening CDR and ICR varied by age group. Although other studies have examined the effects of risk factors on cancer detection rates by age group,11,12 they either did not focus on screening outcomes or did not differentiate between cancers detected at screening and those diagnosed between screens. Our findings provide new insights into screening outcomes by separately estimating CDR and ICR, stratified by risk factor and age group, for a large mammography screening population, insights relevant to discussions by BreastScreen Australia and other breast screening programs contemplating risk‐based screening.
Our finding that the difference in ICR associated with a first degree family history of breast cancer was greater for women aged 40–49 years than for older women is consistent with that of a meta‐analysis of 52 epidemiological studies that breast cancer risk among women with such histories was greater for younger than older women.13 However, we found that the CDR was also greater for older women with family histories, important for tailoring screening based on risk factors and age.
We found that cancer detection rates (CDR and ICR) for HRT users were particularly large in older age groups. The risk of breast cancer for women using HRT increases with duration of therapy,14,15,16 and older women will probably have used HRT longer, but we did not collect data on HRT duration.
In our study, both CDR and ICR were higher for women in all age groups classified as having dense breasts. This is consistent with overseas reports that dense breast tissue both compromises cancer detection by mammography17 and is itself a breast cancer risk factor.18 However, a Breast Cancer Surveillance Consortium study which followed up women with screen‐detected breast cancer found that breast cancer mortality was not higher among women with dense breasts.19 No other Australian studies have reported population screening outcomes by breast density. Determining density from older mammograms (within 27 months of the current screen) may have caused us to misclassify breast density for some women.
Although women are advised to see their general practitioners about any breast‐related symptoms, about 1% of the screening participants in our study presented for screening with such symptoms. We did not have information about their duration, but the women may have chosen to be screened early, or to wait until their scheduled screen to report their symptoms. The fact that the CDR in our study was more than seven times as high for women who reported symptoms as for those who did not indicates that ensuring that they are carefully investigated is important. BreastScreen WA generally advises women with symptoms but normal mammograms to see their general practitioners for further investigation; if they are subsequently diagnosed with cancer, it is classified as an interval cancer, which explains why the ICR for women with self‐reported symptoms was also very high.
Limitations
We did not have information about some important risk factors, such as paternal family history, gene mutations that confer very high risk (eg, BRCA1, BCRA2) and relatives with these mutations, or chest radiotherapy. The relevant mutations, however, are rare, and women with known cancer‐predisposing gene mutations are generally managed in specialised clinics because they require different screening and risk reduction strategies. The CDR was higher for women with personal histories of breast cancer, consistent with their higher risk, but we could not reliably assess whether the ICR for this group was higher because second breast cancers are not routinely reported to cancer registries. Further, we did not assess the influence of risk factors in multivariable models.
We have provided the first empirical estimates of CDR and ICR by risk factor for an Australian screening population, with the aim of informing further evaluation of risk‐stratified screening. But we did not examine the effect of intensifying breast cancer screening of women at high risk, nor the impact of any form of risk‐stratified screening on breast cancer mortality and other health outcomes. These should be evaluated to determine whether a change in screening approach increases the detection of inconsequential cancers or increases the lead time (the time between early detection by screening and usual clinical presentation and diagnosis) without achieving additional health benefits for screened women.
Conclusion
Cancer detection rates were higher for women with personal histories of breast cancer or benign breast conditions or first degree family histories of breast cancer, women with dense breasts or self‐reported breast‐related symptoms, and women using HRT. In addition, some risk factor‐specific outcomes differed by age group. Our findings could inform discussions of the role for risk‐stratified screening in Australia and overseas, and may assist planning of research for generating evidence on its clinical and cost‐effectiveness.
Box 1 – Baseline characteristics of 1 026 137 screening episodes for 323 082 women aged 40 years or more screened by BreastScreen WA, 2007–2017
|
Characteristic |
Screening episodes |
||||||||||||||
|
|
|||||||||||||||
|
Age (years) |
|
||||||||||||||
|
40–49 |
142 700 (13.9%) |
||||||||||||||
|
50–59 |
424 213 (41.3%) |
||||||||||||||
|
60–69 |
356 073 (34.7%) |
||||||||||||||
|
70 or more |
103 151 (10.1%) |
||||||||||||||
|
Socio‐economic status (IRSD), quintile |
|
||||||||||||||
|
1st (most disadvantaged) |
98 683 (9.6%) |
||||||||||||||
|
2nd |
231 500 (22.6%) |
||||||||||||||
|
3rd |
199 763 (19.5%) |
||||||||||||||
|
4th |
160 137 (15.6%) |
||||||||||||||
|
5th (least disadvantaged) |
331 041 (32.3%) |
||||||||||||||
|
Postcode could not be classified |
4228 (0.4%) |
||||||||||||||
|
Postcode missing |
785 (0.1%) |
||||||||||||||
|
Time since previous screen (months) |
|
||||||||||||||
|
First screen |
148 499 (14.5%) |
||||||||||||||
|
Less than 15 |
92 484 (9.0%) |
||||||||||||||
|
15 to less than 27 |
591 503 (57.6%) |
||||||||||||||
|
27 or more |
193 651 (18.9%) |
||||||||||||||
|
Breast density |
|
||||||||||||||
|
Dense |
235 476 (23.0%) |
||||||||||||||
|
Not dense |
703 213 (68.5%) |
||||||||||||||
|
Unknown |
87 448 (8.5%) |
||||||||||||||
|
Personal history of breast cancer |
|
||||||||||||||
|
Yes |
39 086 (3.8%) |
||||||||||||||
|
No |
987 049 (96.2%) |
||||||||||||||
|
No response |
2 (< 0.1%) |
||||||||||||||
|
Personal history of ovarian cancer |
|
||||||||||||||
|
Yes |
5319 (0.5%) |
||||||||||||||
|
No |
1 020 811 (99.5%) |
||||||||||||||
|
No response |
7 (< 0.1%) |
||||||||||||||
|
First degree family history of breast cancer |
|
||||||||||||||
|
Yes |
211 742 (20.6%) |
||||||||||||||
|
None |
814 395 (79.4%) |
||||||||||||||
|
Hormone replacement therapy (past 6 months) |
|
||||||||||||||
|
Yes |
121 189 (11.8%) |
||||||||||||||
|
No |
904 850 (88.2%) |
||||||||||||||
|
No response |
98 (< 0.1%) |
||||||||||||||
|
Breast surgery/biopsy for benign conditions |
|
||||||||||||||
|
Yes |
182 562 (17.8%) |
||||||||||||||
|
No |
843 575 (82.2%) |
||||||||||||||
|
Self‐reported breast symptoms |
|
||||||||||||||
|
Yes |
10 455 (1.0%) |
||||||||||||||
|
No |
1 015 682 (99.0%) |
||||||||||||||
|
BreastScreen WA high risk category† |
|
||||||||||||||
|
Yes |
145 086 (14.1%) |
||||||||||||||
|
No |
881 051 (85.9%) |
||||||||||||||
|
|
|||||||||||||||
|
IRSD = Index of Relative Socio‐economic Disadvantage. |
|||||||||||||||
Box 2 – Rate of recall for further investigation, screening cancer detection rate (CDR), and interval cancer rate (ICR), by risk factor
|
|
|
Recalls |
Screen‐detected cancers |
Interval cancers |
|||||||||||
|
Characteristic |
All screens |
Number |
Proportion (95% CI) |
Number |
CDR (95% CI) |
Number |
ICR (95% CI) |
||||||||
|
|
|||||||||||||||
|
All women |
1 026 137 |
38 253 |
3.73% (3.69–3.76%) |
7024 |
68 (67–70) |
1866 |
9.7 (9.2–10.1) |
||||||||
|
Age (years) |
|||||||||||||||
|
40–49 |
142 700 |
8930 |
6.26% (6.13–6.38%) |
650 |
46 (42–49) |
284 |
10.5 (9.3–11.7) |
||||||||
|
50–59 |
424 213 |
16 355 |
3.86% (3.80–3.91%) |
2368 |
56 (54–58) |
733 |
9.1 (8.5–9.8) |
||||||||
|
60–69 |
356 073 |
9660 |
2.71% (2.66–2.77%) |
2768 |
78 (75–81) |
627 |
9.5 (8.8–10.2) |
||||||||
|
70 or more |
103 151 |
3308 |
3.21% (3.10–3.31%) |
1238 |
120 (113–127) |
222 |
11.7 (10.3–13.4) |
||||||||
|
Socio‐economic status (IRSD), quintile |
|||||||||||||||
|
1 (most disadvantaged) |
98 683 |
3540 |
3.59% (3.47–3.70%) |
691 |
70 (65–75) |
147 |
7.9 (6.7–9.3) |
||||||||
|
2 |
231 500 |
8586 |
3.71% (3.63–3.79%) |
1679 |
73 (69–76) |
427 |
9.8 (8.9–10.8) |
||||||||
|
3 |
199 763 |
7590 |
3.80% (3.72–3.88%) |
1397 |
70 (66–74) |
340 |
9.0 (8.2–10.1) |
||||||||
|
4 |
160 137 |
6108 |
3.81% (3.72–3.91%) |
1067 |
67 (63–71) |
283 |
9.4 (8.4–10.6) |
||||||||
|
5 (least disadvantaged) |
331 041 |
12 228 |
3.69% (3.63–3.76%) |
2156 |
65 (62–68) |
664 |
10.7 (9.9–11.5) |
||||||||
|
Time since previous screen (months) |
|||||||||||||||
|
First screen |
148 499 |
13 627 |
9.18% (9.03–9.32%) |
1280 |
86 (81–91) |
254 |
8.8 (7.8–9.9) |
||||||||
|
Less than 15 |
92 484 |
2426 |
2.61% (2.52–2.73%) |
674 |
73 (67–78)* |
86 |
7.8 (6.3–9.6) |
||||||||
|
15 to less than 27 |
591 503 |
15 248 |
2.58% (2.54–2.62%) |
3355 |
57 (55–59) |
1116 |
9.7 (9.1–10.3) |
||||||||
|
27 or more |
193 651 |
6952 |
3.59% (3.51–3.67%) |
1715 |
89 (84–93) |
410 |
10.9 (9.9–12.0) |
||||||||
|
Personal history of breast cancer |
|||||||||||||||
|
Yes |
39 086 |
1223 |
3.13% (2.96–3.30%) |
435 |
111 (101–122) |
—† |
— |
||||||||
|
No |
987 049 |
37 030 |
3.75% (3.71–3.79%) |
6589 |
67 (65–68) |
—† |
— |
||||||||
|
Personal history of ovarian cancer‡ |
|||||||||||||||
|
Yes |
5319 |
141 |
2.65% (2.22–3.08%) |
21 |
39 (23–56) |
3 |
4.3 (1.4–13.3) |
||||||||
|
No |
1 020 811 |
38 112 |
3.73% (3.70–3.77%) |
7003 |
69 (67–70) |
1863 |
9.7 (9.3–10.2) |
||||||||
|
First degree family history of breast cancer |
|||||||||||||||
|
Yes |
211 742 |
8090 |
3.82% (3.74–3.90%) |
1744 |
82 (79–86) |
378 |
10.9 (9.9–12.1) |
||||||||
|
No |
814 395 |
30 163 |
3.70% (3.66–3.74%) |
5280 |
65 (63–67) |
1488 |
9.4 (8.9–9.9) |
||||||||
|
Breast density |
|||||||||||||||
|
Yes |
235 476 |
3784 |
3.21% (3.11–3.31%) |
770 |
65 (61–70) |
776 |
17.3 (16.1–18.6) |
||||||||
|
No |
703 213 |
9347 |
2.30% (2.25–2.34%) |
2194 |
53 (52–56) |
958 |
7.1 (6.7–7.6) |
||||||||
|
Breast surgery/biopsy for benign conditions |
|||||||||||||||
|
Yes |
182 562 |
7375 |
4.04% (3.95–4.13%) |
1608 |
88 (84–92) |
491 |
14.6 (13.3–16.0) |
||||||||
|
No |
843 575 |
30 878 |
3.66% (3.62–3.70%) |
5416 |
64 (62–66) |
1375 |
8.6 (8.2–9.1) |
||||||||
|
Hormone replacement therapy (past 6 months) |
|||||||||||||||
|
Yes |
121 189 |
4924 |
4.06% (3.95–4.17%) |
973 |
80 (75–85) |
335 |
14.6 (13.1–16.2) |
||||||||
|
No |
904 850 |
33 325 |
3.68% (3.64–3.72%) |
6049 |
67 (65–69) |
1531 |
9.0 (8.6–9.5) |
||||||||
|
Self‐reported breast symptoms |
|||||||||||||||
|
Yes |
10 455 |
1313 |
12.6% (11.9–13.2%) |
497 |
475 (435–516) |
72 |
36.7 (29.1–46.2) |
||||||||
|
No |
1 015 682 |
36 940 |
3.64% (3.60–3.67%) |
6527 |
64 (63–66) |
1794 |
9.4 (9.0–9.8) |
||||||||
|
|
|||||||||||||||
|
CI = confidence interval; IRSD = Index of Relative Socio‐economic Disadvantage. * CDR is slightly elevated because women deemed to be at high risk were invited for annual screening. † ICR by personal history of breast cancer could not be estimated because recurrent and second breast cancers are not routinely reported to cancer registries. ‡ The numbers of screen‐detected and interval cancers in women with personal histories of ovarian cancer were too low for analysis of the influence of this risk factor. |
|||||||||||||||
Box 3 – Cancer detection rate (CDR) at screening, by risk factor and age group (excludes initial screens), with 95% confidence intervals*
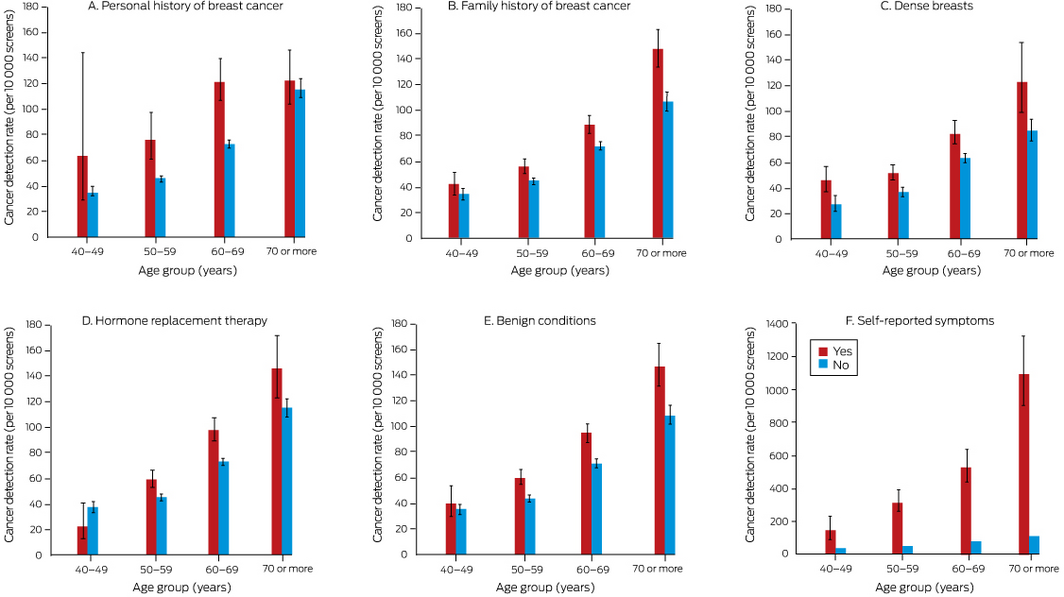
* The data for these graphs are included in the online Supporting Information, table 3.
Box 4 – Interval cancer rate (ICR) in screening participants, by risk factor and age group, with 95% confidence intervals
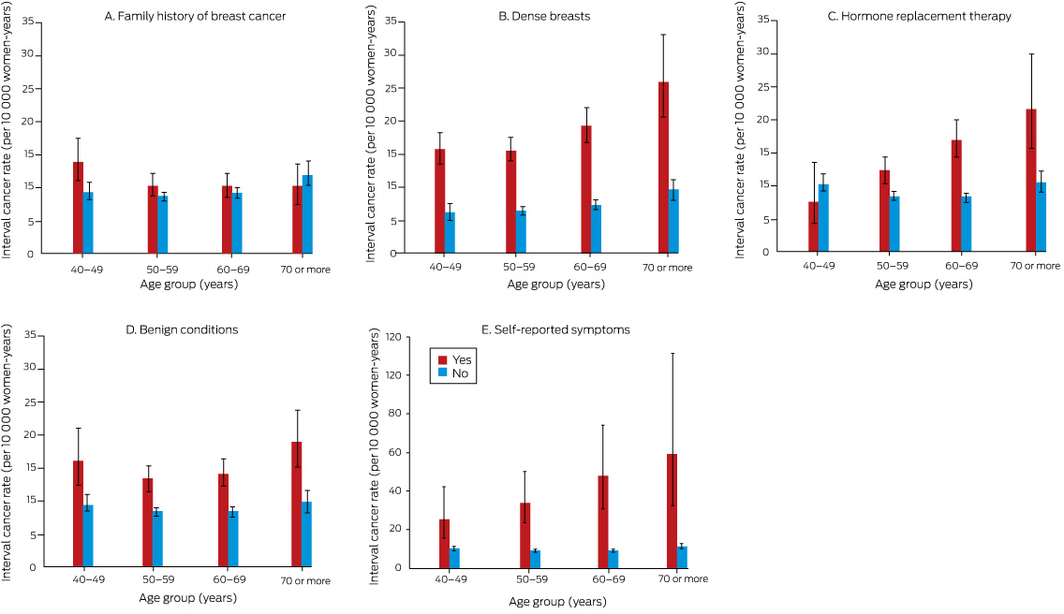
The data for these graphs are included in the online Supporting Information, table 4.
Received 10 February 2021, accepted 17 May 2021
- Naomi Noguchi1
- Michael L Marinovich2
- Elizabeth J Wylie3,4
- Helen G Lund3
- Nehmat Houssami5
- 1 The University of Sydney, Sydney, NSW
- 2 Curtin University, Perth, WA
- 3 BreastScreen WA, Perth, WA
- 4 Royal Perth Hospital, Perth, WA
- 5 Sydney School of Public Health, University of Sydney, Sydney, NSW
Nehmat Houssami is supported by the National Breast Cancer Foundation (NBCF) Chair in Breast Cancer Prevention program (EC‐21‐001) and by a National Health and Medical Research Council Investigator (Leader) grant (1194410). Michael Marinovich is supported by a National Breast Cancer Foundation Investigator Initiated Research Scheme grant (IIRS‐20‐011). We thank Sonia El‐Zaemey and Kim Kee Ooi (BreastScreen WA) for extracting and cleaning the data for our analysis.
No relevant disclosures.
- 1. Myers ER, Moorman P, Gierisch JM, et al. Benefits and harms of breast cancer screening: a systematic review. JAMA 2015; 314: 1615–1634.
- 2. Australian Institute of Health and Welfare. BreastScreen Australia monitoring report 2018 (Cat. no. CAN 116; Cancer Series no. 112). Updated 2 Oct 2018. https://www.aihw.gov.au/reports/cancer/breastscreen‐australia‐monitoring‐report‐2018/contents/table‐of‐contents (viewed Apr 2021).
- 3. Pashayan N, Morris S, Gilbert FJ, Pharaoh PDP. Cost‐effectiveness and benefit‐to‐harm ratio of risk‐stratified screening for breast cancer: a life‐table model. JAMA Oncol 2018; 4: 1504–1510.
- 4. Cancer Council. Roadmap for optimising screening in Australia: breast. Undated. https://www.cancer.org.au/about‐us/policy‐and‐advocacy/early‐detection‐policy/breast‐cancer‐screening/optimising‐early‐detection (viewed Apr 2021).
- 5. Houssami N, Hunter K. The epidemiology, radiology and biological characteristics of interval breast cancers in population mammography screening. NPJ Breast Cancer 2017; 3: 12.
- 6. Australian Institute of Health and Welfare. BreastScreen Australia data dictionary, version 1.2 (Cat. no. CAN 127; Cancer Series no. 123). Updated 29 Apr 2019. https://www.aihw.gov.au/reports/cancer‐screening/breastscreen‐australia‐data‐dictionary‐version‐1‐2/contents/table‐of‐contents (viewed Apr 2021).
- 7. D’Orsi C, Sickles E, Mendelson E, et al. ACR BI‐RADS® Atlas, breast imaging reporting and data system. Fifth edition. Reston (VA): American College of Radiology, 2013.
- 8. Australian Bureau of Statistics. 2033.0.55.001. Technical paper. Socio‐economic Indexes for Areas (SEIFA). 2016. https://www.ausstats.abs.gov.au/ausstats/subscriber.nsf/0/756EE3DBEFA869EFCA258259000BA746/$File/SEIFA%202016%20Technical%20Paper.pdf (viewed Apr 2021).
- 9. BreastScreen Australia. National accreditation standards. Updated 16 Jan 2019. https://www.health.gov.au/sites/default/files/documents/2019/09/breastscreen‐australia‐national‐accreditation‐standards‐nas‐breastscreen‐australia‐national‐accreditation‐standards.pdf (viewed Apr 2021).
- 10. Spiegelman D, Hertzmark E. Easy SAS calculations for risk or prevalence ratios and differences. Am J Epidemiol 2005; 162: 199–200.
- 11. Houssami N, Lockie D, Clemson M, et al. Pilot trial of digital breast tomosynthesis (3D mammography) for population‐based screening in BreastScreen Victoria. Med J Aust 2019; 211: 357–362. https://www.mja.com.au/journal/2019/211/8/pilot‐trial‐digital‐breast‐tomosynthesis‐3d‐mammography‐population‐based
- 12. Yang XR, Chang‐Claude EL, Couch FJ, et al. Associations of breast cancer risk factors with tumor subtypes: a pooled analysis from the Breast Cancer Association Consortium Studies. J Natl Cancer Inst 2011; 103: 250–263.
- 13. Collaborative Group on Hormonal Factors in Breast Cancer. Familial breast cancer: collaborative reanalysis of individual data from 52 epidemiological studies including 58 209 women with breast cancer and 101 986 women without the disease. Lancet 2001; 358: 1389–1399.
- 14. Jones ME, Schoemaker MJ, Wright L, et al. Menopausal hormone therapy and breast cancer: what is the true size of the increased risk? Br J Cancer 2016; 115: 607–615.
- 15. Lee S, Kolonel L, Wilkens L, et al. Postmenopausal hormone therapy and breast cancer risk: the Multiethnic Cohort. Int J Cancer 2006; 118: 1285–1291.
- 16. Bakken K, Fournier A, Lund E, et al. Menopausal hormone therapy and breast cancer risk: Impact of different treatments. The European Prospective Investigation into Cancer and Nutrition. Int J Cancer 2011; 128: 144–156.
- 17. Moshina N, Sebuødegård S, Lee CI, et al. Automated volumetric analysis of mammographic density in a screening setting: worse outcomes for women with dense breasts. Radiology 2018; 288: 343–352.
- 18. Vachon CM, van Gils CH, Sellers TA, et al. Mammographic density, breast cancer risk and risk prediction. Breast Cancer Res 2007; 9: 217.
- 19. Gierach GL, Ichikawa L, Kerlikowske K, et al. Relationship between mammographic density and breast cancer death in the Breast Cancer Surveillance Consortium. J Natl Cancer Inst 2012; 104: 1218–1227.
Abstract
Objectives: To estimate rates of screen‐detected and interval breast cancers, stratified by risk factor, to inform discussions of risk‐stratified population screening.
Design: Retrospective population‐based cohort study; analysis of routinely collected BreastScreen WA program clinical and administrative data.
Setting, participants: All BreastScreen WA mammography screening episodes for women aged 40 years or more during 1 July 2007 ‒ 30 June 2017.
Main outcome measures: Cancer detection rate (CDR) and interval cancer rate (ICR), by risk factor.
Results: A total of 323 082 women were screened in 1 026 137 screening episodes (mean age, 58.5 years; SD, 8.6 years). The overall CDR was 68 (95% CI, 67‒70) cancers per 10 000 screens, and the overall ICR was 9.7 (95% CI, 9.2‒10.1) cancers per 10 000 women‐years. Interactions between the effects on CDR of age group and five risk factors were statistically significant: personal history of breast cancer (P = 0.039), family history of breast cancer (P = 0.005), risk‐relevant benign conditions (P = 0.012), hormone‐replacement therapy (P = 0.002), and self‐reported symptoms (P < 0.001). The influence of these risk factors (except personal history) increased with age. For ICR, only the interaction between age and hormone‐replacement therapy was significant (P < 0.001), although weak interactions between age and family history of breast cancer or having dense breasts were noted (each P = 0.07). The influence of family history on ICR was significant only for women aged 40‒49 years.
Conclusions: Screening CDR and (for some risk factors) ICR were higher for women in some age groups with personal histories of breast cancer or risk‐relevant benign breast conditions or first degree family history of breast cancer, women with dense breasts or self‐reported breast‐related symptoms, and women using hormone‐replacement therapy. Our findings could inform the evaluation of risk‐based screening.