




Volume 215 - Issue 4
Renewable energy use in Australian public hospitals
Authors: Hayden Burch, Matthew H Anstey and Forbes McGain
Med J Aust 2021; 215 (4): 160-163.e1. || doi: 10.5694/mja2.51197
Published online: 16 August 2021
Published online: 16 August 2021
Australian public hospitals’ energy choices are at odds with “first, do no harm”
Australian public hospitals’ energy choices are at odds with “first, do no harm”
The health care sector faces many of the consequences of climate change but is lagging behind in tackling its own contribution to this health threat.1 Increases in extreme weather are contributing to adverse physical, mental and intergenerational health outcomes in Australia and beyond.2,3 Despite these health implications, health care itself pollutes, being responsible for 7% of Australia’s total carbon footprint.4 Coal‐generated electricity and natural/fossil gas are considerable sources of health care’s carbon dioxide equivalent (CO2e) emissions4 and also contribute to local air particulate matter, with cardiorespiratory consequences.3
Hospitals have large energy demands due to continuous operation, primarily from heating, ventilation and air conditioning.5 The demand is so large that public hospitals consume over half of public sector energy in most Australian states and territories.6,7 Therefore, hospitals should be key stakeholders in Australian state and territory decarbonisation efforts.
Internationally, health care institutions have recognised and are acting on their energy choices, signing on to 100% renewable electricity targets for their health care facilities.5
It remains unclear, however, how rapidly Australian hospitals are moving towards renewable energy alternatives. We aimed to evaluate the total energy use, electricity use, natural/fossil gas use, and renewable electricity generation or purchase by Australian public hospitals and compare this with international health care leaders and the Australian university sector.
We examined Australian state and territory public hospital direct energy data for the decade 2010–2019, obtaining prospective ethics approval (Western Health QA2019.41). Although we sought 10 years of data, we were only able to obtain complete data for all states and territories for 3 consecutive years, 2016–17 to 2018–19. Based on Australian Institute of Health and Welfare data, there were 693 public hospitals in Australia in 2018–19.8
We sought data from two sources: Australian state and territory Health Departments and the Australian Clean Energy Regulator, which is responsible for National Greenhouse and Energy Reporting (NGER). In Australia, since 2017, public hospitals have been included in both the National Australian Built Environment Rating System (NABERS)9 and NGER schemes.10 Under NABERS, 274 of 693 Australian public hospitals are included in the 2018–19 NABERS analysis, although none are publicly disclosed.9 Under the NGER scheme, hospitals must report if energy consumption is 100 terajoules or more per year and/or if emissions equal 25 kt CO2e emissions/annum (ie, hospitals with about 200 acute beds).10
We wrote to Australian state and territory Health Departments from August to October 2019 seeking annualised data for public hospital direct energy use. We also wrote to three health services in Western Australia (East, North and South Metropolitan regions), as no renewable electricity data could be identified by the WA Health Department. Hospital‐level information was amalgamated into state‐based calculations to avoid inadvertent identification of individual hospitals. Tertiary education was selected as a comparator with similarly large multibuilding institutions and considerable energy demands.6
The Australian public hospital data requested for 2010–2019 were total energy use, natural/fossil gas use, and renewable and non‐renewable electricity (produced or purchased), such as rooftop solar photovoltaic (PV), GreenPower (purchased renewable electricity) in kilowatt‐hours (kWh), natural gas (gigajoules, GJ), liquefied petroleum gas (kilolitres, kL), co‐ and tri‐generation (fossil gas consumption for heating and electricity production plus/minus cooling) (kWh).
In order to establish the active contribution of the health care industry to reducing fossil fuel use, we focused on renewable electricity generated or purchased by the health care sector. Only health sector‐purchased GreenPower was attributed to hospital renewable energy calculations. That is, we only included production or purchase of renewable electricity beyond the state’s or territory’s grid electricity. We did not include diesel fuel use (used either for transport, back‐up power or, in smaller rural hospitals, for electricity generation) due to poor data access.
From November 2019 to February 2020, we received responses from all state and territory Health Departments and from metropolitan WA health services. Data were robust for the 3 consecutive years from 2016–17 to 2018–19 inclusive. Data before 2016–17 were unavailable, unreliable or not inclusive of all hospitals. Data supplied under NGER were not reliable (high energy reporting thresholds, and heavily redacted due to concerns about revealing individual hospitals).
The total Australian public hospital energy use was stable for the 3 years (2016–17 to 2018–19) (Box 1). Renewable energy production/purchase increased from 14/4132 GWh to 94/4122 GWh (from 0.3% to 2.3% of power consumed). Australian renewable grid electricity uptake grew by 8.3% (from 15.7% in 2016–17 to 24% in 2018–19).
On a national level, grid electricity use was the majority of total hospital energy consumed (range, 2495–2507 GWh; 59–61% of total energy), incorporating GreenPower certificates (range, 1–72 GWh (0.02–2% of total energy). Natural gas use was also large (range, 1444–1522 GWh; 35–36% of total energy), followed by liquid propane gas (range, 95–107 GWh; 2% of total energy), co‐ and tri‐generation (range, 62–74 GWh; 1.5–2% of total energy), and rooftop solar PV (range, 13–21 GWh; 0.3–0.5% of total energy). No biofuels were used according to discussions with state health representatives, nor was feedback that renewable electricity supply may be a limiting factor.
The large increase in renewable energy in 2018–19 was a result of Queensland Health being a benefactor of a whole‐of‐government GreenPower purchase (71.4 GWh purchased by Queensland Health). Renewable energy uptake by health care elsewhere was small (range, 0–1.2%; 2018–19).
Box 2 represents each state and territory relative contribution to the Australian national public hospital energy consumption and the percentage of renewable energy use. Victoria and New South Wales combined consumed 60% of the total Australian public hospital energy (1288 and 1206 of 4122 GWh respectively; 2018–19). Queensland public hospitals consumed 778/4122 GWh (19% of total energy) and produced or purchased the most renewable electricity (74/778 GWh; 9.5%) of all state public hospitals in 2018–19. In Victoria, the Australian Capital Territory and South Australia, half of total energy consumption was by natural/fossil gas. Large hospital heating loads are required particularly overnight in cooler states, thus Victorian public hospitals had higher total energy use than NSW hospitals.
Our study shows that just 2.3% (14–94 GWh per year) of Australian public hospital energy use was sourced from renewables between 2016–17 and 2018–19. Most hospital efforts over‐and‐above the national grid renewable electricity supply arose from a single state, Queensland Health’s GreenPower purchase in 2018–19, which contributed three‐quarters of all Australian public hospital renewable electricity. Over the same period, public hospitals consumed 4122–4132 GWh per year of energy, enough to power 630 000 average Australian homes each year.
Increasing renewable energy use in the health care sector will require a number of approaches. Firstly, state and territory net zero emissions and renewable energy targets need to be more uniform and stronger (Supporting Information). In contrast, England’s National Health Service (NHS) has a national Sustainable Development Unit that coordinates a national road map for net zero health care emissions by 2040.14
Secondly, while hospital energy efficiency may be a reasonable first step, in order to achieve the emissions reductions targets required, we need to transition to renewable electricity sources.6 Co‐ and tri‐generation electricity are energy‐efficiency variants relying on natural/fossil gas. Victoria illustrates the difficulties of hospital energy efficiency as a sole strategy as, while their efficiency improvements achieved a 9% reduction in CO2e emissions per square metre of hospital floor space between 2005 and 2018, demand‐driven energy use grew 22% and carbon emissions 32%.15 For Victoria to achieve the state’s legislated 2050 net zero target, large change beyond 100% renewable electricity supply by 2025 will be required. Natural/fossil gas consumption contributed 48% of Victorian hospital energy use in 2018–19, and only getting off gas will ultimately solve this.
While some Australian hospitals are putting on rooftop solar panels, this will be insufficient to supply virtually all medium to large hospitals. Australia’s public hospitals are using about 4100 GWh per year, and solar panels can generate about 4 kWh/m2 per day (a conservative average for Australian capital cities; https://pvwatts.nrel.gov/). Allowing for 50% inefficiencies for cloudy days and battery storage, as per our calculations, we would need a solar farm at Sydney’s latitude of about 4 km2 to power all of Australia’s public hospitals. Comparatively, in the United States, Kaiser Permanente — the world’s largest integrated health care system — has achieved renewable energy self‐sufficiency via a 180 MW power purchase agreement.16 A power purchase agreement enables the construction of utility‐scale solar and wind farms, and large battery energy storage systems to directly supply clean and often cheaper energy to hospitals. In the United Kingdom, the NHS will purchase 100% renewable electricity for its 3500 buildings (hospitals, general practice surgeries etc) by December 2021.14 In Australia, Queensland may demonstrate a pathway for other state and territory health systems through their large‐scale GreenPower purchasing. This approach increased purchasing power, although renewable energy remains expensive (hospitals’ 24‐hour operations demand both on‐ and off‐peak electricity).
GreenPower purchasing, however, may not suit all states and territories. For example, the ACT, Tasmania and SA have already achieved high grid renewable electricity penetration, with the ACT and SA reducing statewide grid carbon intensity by more than 50% over the past decade.17,18 This may explain why relatively little renewable electricity has been produced or purchased by public hospitals in these states and territories (range, 0.4–1.2%; 2018–19). Purchasing hospital renewable electricity over‐and‐above a high state background renewable electricity proportion will yield lower sustainability returns than focusing on states that have much lower renewable grid penetration. Further, Victoria, SA and the ACT, with proportionally high gas consumption, should focus on replacing this gas with renewable electricity. For the same amount of energy, gas (at best) has about one‐third the CO2e emissions compared with coal.19 Gas, by definition, is not the pathway to zero emissions health care.
When health care compares itself to similar economic sectors in Australia, such as tertiary education, it is woefully behind. Many universities have set 100% renewable electricity targets, with the investment by individual universities occurring at a scale equal or larger than entire state and territory public hospital efforts.20 Monash University (Melbourne) purchases fivefold the renewable electricity each year of all Victorian public hospitals combined (55 GWh of GreenPower and 3.8–6.3 GWh of solar PV; 2015–16 to 2018–19). Other universities (eg, Swinburne University, 90 GWh per year; the University of New South Wales, 124 GWh per year) have entered long term renewable Power Purchase Agreements (like Kaiser Permanente in the US) that eclipse the efforts of the entire Australian public hospital system.
All renewable energy solutions need investment and routine cooperation with other government sectors. We recognise these solutions will require a degree of financial investment to kick‐start (and expect a future return), and this can be difficult when hospitals are under pressure to balance their yearly budgets just to provide patient care. Nevertheless, the health care sector could use its market influence to purchase increasing amounts of renewable energy. In Victoria, most health care chief executives are indeed supportive of greater investment in renewables.21
We calculated the best‐case scenario for the percentage of renewable energy produced or purchased, often based on peak solar output per kW of solar panels. Underreporting of total hospital energy data was possible in WA, the Northern Territory, the ACT and Queensland, with very small rural and regional facilities not included in the supplied data. Centralised management systems of public hospital energy are non‐existent in some jurisdictions. We did not consider indirect hospital energy consumption, such as procurement of services, equipment and consumables not directly controlled or owned by the hospital, which we realise form the majority of health care’s carbon footprint (scope 3 emissions).4 We also did not examine private hospital energy use due to commercial‐in‐confidence concerns. Future analyses should consider data collection methodology in the absence of robust statewide energy management systems.
We describe the quantitation of how rapidly Australian hospitals are moving towards renewable energy as a source of electricity supply and compare health care’s performance with international leaders and other economic sectors. The ancient Hippocratic principle “first, do no harm” is central to the practice of medicine. Evidence‐based medicine is also now integral to our practice. Level 1 evidence from our planetary science colleagues tells us that we need to act now to reduce harm from climate change. To decouple hospital energy from contributing to climate change, hospitals must move to renewable electricity and get off gas.
Box 1 – Australian national and state and territory baseline grid renewable electricity levels, public hospital total energy consumed, renewable energy purchased and produced, and percentage of total energy that is renewable over‐and‐above the grid supply, 2016–17 to 2018–19*
Energy (MWh) |
2016–17 |
2017–18 |
2018–19 | ||||||||||||
Australia |
|||||||||||||||
National baseline renewables |
15.7% |
17.0% |
24.0% |
||||||||||||
Total hospital energy consumed |
4 132 162 |
4 213 694 |
4 121 911 |
||||||||||||
Hospital renewable energy produced |
13 651 |
18 350 |
94 415 |
||||||||||||
Hospital energy % renewable |
0.3% |
0.4% |
2.3% |
||||||||||||
Victoria |
|||||||||||||||
State baseline renewables |
12.0% |
15.2% |
23.9% |
||||||||||||
Total hospital energy consumed |
1 305 587 |
1 310 008 |
1 288 292 |
||||||||||||
Hospital renewable energy produced |
3288 |
7679 |
11 057 |
||||||||||||
Hospital energy % renewable |
0.3% |
0.6% |
0.9% |
||||||||||||
New South Wales |
|||||||||||||||
State baseline renewables |
16.0% |
15.7% |
17.1% |
||||||||||||
Total hospital energy consumed |
1 194 657 |
1 218 509 |
1 206 019 |
||||||||||||
Hospital renewable energy produced |
7053 |
7036 |
7007 |
||||||||||||
Hospital energy % renewable |
0.6% |
0.6% |
0.6% |
||||||||||||
Queensland |
|||||||||||||||
State baseline renewables |
6.5% |
7.2% |
14.1% |
||||||||||||
Total hospital energy consumed |
773 111 |
770 317 |
778 595 |
||||||||||||
Hospital renewable energy produced |
2136 |
2121 |
73 694 |
||||||||||||
Hospital energy % renewable |
0.3% |
0.3% |
9.5% |
||||||||||||
Western Australia |
|||||||||||||||
State baseline renewables |
7.5% |
7.7% |
20.9% |
||||||||||||
Total hospital energy consumed |
336 494 |
354 698 |
335 783 |
||||||||||||
Hospital renewable energy produced |
na |
na |
396† |
||||||||||||
Hospital energy % renewable |
0 |
0 |
0.1% |
||||||||||||
Australian Capital Territory |
|||||||||||||||
State baseline renewables |
18.1% |
28.2% |
43.9% |
||||||||||||
Total hospital energy consumed |
70 196 |
70 311 |
67 426 |
||||||||||||
Hospital renewable energy produced |
549 |
829 |
811 |
||||||||||||
Hospital energy % renewable |
0.8% |
1.2% |
1.2% |
||||||||||||
Tasmania |
|||||||||||||||
State baseline renewables |
91.3% |
91.3% |
95.6% |
||||||||||||
Total hospital energy consumed |
71 839 |
70 987 |
71 396 |
||||||||||||
Hospital renewable energy produced |
415 |
429 |
300 |
||||||||||||
Hospital energy % renewable |
0.6% |
0.6% |
0.4% |
||||||||||||
Northern Territory |
|||||||||||||||
State baseline renewables |
2.9% |
3.5% |
6.0% |
||||||||||||
Total hospital energy consumed |
54 282 |
56 415 |
49 613 |
||||||||||||
Hospital renewable energy produced |
na |
na |
na |
||||||||||||
Hospital energy % renewable |
0 |
0 |
0 |
||||||||||||
South Australia |
|||||||||||||||
State baseline renewables |
47.0% |
46.6% |
52.1% |
||||||||||||
Total hospital energy consumed |
325 997 |
362 450 |
324 789 |
||||||||||||
Hospital renewable energy produced |
210 |
256 |
1149 |
||||||||||||
Hospital energy % renewable |
0.1% |
0.1% |
0.4% |
||||||||||||
na = not applicable. * We converted all energy data into kWh for simplification (ie, natural/fossil gas, 1 GJ = 278kWh; liquefied petroleum gas, 1 kL = 6900 kWh).11 Solar photovoltaic data supplied as kilowatts/kilowatt‐peak were multiplied by the hourly daily solar average per state and territory capital city for 365 operating days.12 Peak‐watts were used to calculate a best‐case scenario. If raw gas cogeneration electricity data were not provided, we multiplied total kilowatt‐peak capacity by the minimum annual running time to justify operation as per a New South Wales government approach (3300 hours per year or 38% total time usage).13 Solar hot water production was included in the Queensland supplied data, and approximated by researchers in South Australia as 2 kWh/panel/day6 and not reported elsewhere. † Data sourced directly from Western Australian health services. | |||||||||||||||
Box 2 – State and territory public hospital total energy consumption as a percentage of the Australian total public hospital energy use and a percentage of state and territory total energy use that was renewable in supply, 2018–19
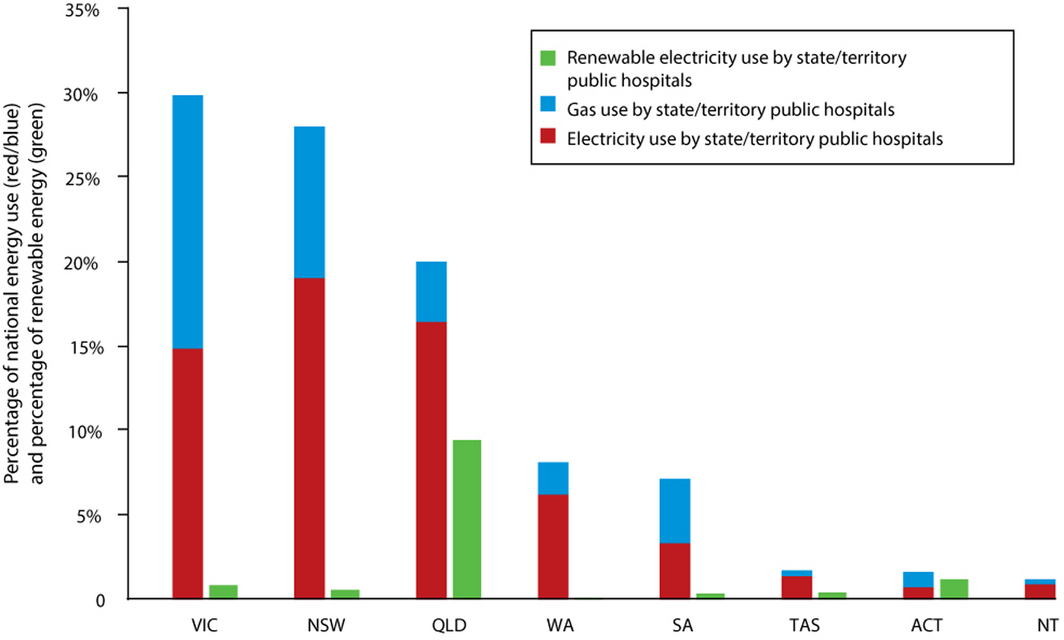
ACT = Australian Capital Territory; NSW = New South Wales; NT = Northern Territory; QLD = Queensland; SA = South Australia; TAS = Tasmania; VIC = Victoria; WA = Western Australia.
Competing interests
No relevant disclosures.
Acknowledgements
We thank energy analysts within Queensland, Victoria and SA Health Departments, the WA Department of Water and Energy and the Clean Energy Regulator for their assistance.
References
- MacNeill AJ, McGain F, Sherman JD. Planetary health care: a framework for sustainable health systems. Lancet Planet Health 2021; 5: e66–e68.
- Costello A, Abbas M, Allen A, et al. Managing the health effects of climate change. Lancet 2009; 373: 1693–1733.
- Watts N, Adger WN, Agnolucci P, et al. Health and climate change: policy responses to protect public health. Lancet 2015; 386: 1861–1914.
- Malik A, Lenzen M, McAlister S, McGain F. The carbon footprint of Australian health care. Lancet Planet Health 2018; 2: e27–e35.
- Karliner J, Slotterback S, Boyd R, et al. Health care’s climate footprint: how the health sector contributes to the global climate crisis and opportunities for action. Health Care Without Harm, 2019. https://noharm-global.org/documents/health-care-climate-footprint-report (viewed Apr 2020).
- Department of Climate Change and Energy Efficiency. Baseline energy consumption and greenhouse gas emissions; part 1. Canberra: Commonwealth of Australia, 2012. https://www.energy.gov.au/sites/default/files/baseline-energy-consumption-part_1-report-2012.pdf (viewed Apr 2020).
- Department of Health and Human Services. Energy use in Victorian public healthcare services. Melbourne: State Government of Victoria. 2018. https://www2.health.vic.gov.au/hospitals-and-health-services/planning-infrastructure/sustainability/energy/energy-use (viewed Oct 2019).
- Australian Institute of Health and Welfare. Hospital resources 2017–18: Australian hospital statistics [Cat. No. HSE 233]. AIHW, 2019. https://www.aihw.gov.au/reports/hospitals/hospital-resources-2017-18-ahs/contents/summary (viewed Apr 2020).
- National Australian Built Environment Rating System. Annual report 2018–19 [website]. NABERS, 2019. https://nabers.info/annual-report/2018-2019/ (viewed Mar 2020).
- National Greenhouse and Energy Reporting; Clean Energy Regulator. Reporting thresholds. Australian Government, 2018. http://www.cleanenergyregulator.gov.au/NGER/Reporting-cycle/Assess-your-obligations/Reporting-thresholds (viewed Mar 2020).
- Department of Environment and Energy. National Greenhouse Accounts factors 2017. https://www.environment.gov.au/system/files/resources/5a169bfb-f417-4b00-9b70-6ba328ea8671/files/national-greenhouse-accounts-factors-july-2017.pdf (viewed Oct 2020).
- Elliott J. How much energy will my solar cells produce? Solar Choice, 2019. https://www.solarchoice.net.au/blog/how-much-energy-will-my-solar-cells-produce/ (viewed Dec 2020).
- NSW Government. Office of Environment and Heritage. Energy saver: cogeneration feasibility guide. Sydney: NSW Government, 2014. https://www.environment.nsw.gov.au/resources/business/140685-cogeneration-feasibility-guide.pdf (viewed June 2020).
- National Health Service. Delivering a “net zero” National Health Service [website]. NHS, 2020. https://www.england.nhs.uk/greenernhs/wp-content/uploads/sites/51/2020/10/delivering-a-net-zero-national-health-service.pdf (viewed Oct 2020).
- Victorian Health and Human Services Building Authority. Environmental sustainability strategy: strategic implementation plan 2018–19 to 2022–23; action plan 2018–19. Melbourne: Victorian State Government, 2018. https://www.vhba.vic.gov.au/sites/default/files/2019-10/VHHSBA-Health-Environmental-sustainability-strategy-2018-2023-SIP-2018-19-action-plan_0.pdf (viewed Mar 2020).
- Kaiser Permanente. We will be carbon neutral in 2020 [media release]. 10 Sept 2018. https://about.kaiserpermanente.org/community-health/news/kaiser-permanente-finalizes-agreement-to-enable-carbon-neutralit (viewed Mar 2021).
- ACT Government. ACT Climate Change Strategy 2019–25. Canberra: Australian Capital Territory, 2019. https://www.environment.act.gov.au/__data/assets/pdf_file/0003/1414641/ACT-Climate-Change-Strategy-2019-2025.pdf/_recache (viewed Mar 2020).
- Clean Energy Council. Clean energy Australia, report 2020. https://assets.cleanenergycouncil.org.au/documents/resources/reports/clean-energy-australia/clean-energy-australia-report-2020.pdf (viewed Aug 2020).
- Australian Government Department of the Environment and Energy. National Greenhouse Accounts factors 2019. https://www.industry.gov.au/sites/default/files/2020-07/national-greenhouse-accounts-factors-august-2019.pdf (viewed Apr 2021).
- Clean Energy Council. Renewable energy powering Australian education [news]. 15 Apr 2019. https://www.cleanenergycouncil.org.au/news/renewable-energy-powering-australian-education (viewed May 2020).
- Burch H, McGain F. Victorian public healthcare Chief Executive Officers’ views on renewable energy supply. Aust Health Rev 2021; 45: 7–11.
Provenance: Not commissioned; externally peer reviewed.
Designing Housing to Reduce Overcrowding-Related Harms: Rheumatic Heart Disease as the Canary in the Coal Mine
Simon Quilty, Veronica Matthews, Angus Baumann, James Marangou, Bo Remenyi, Gavin Wheaton, Serena Morton Nabanunga, Norman Frank Jupurrurla, Simon Robinson, Steve Mintern, Cary Duffield, Joshua R. Francis, Paul C. Memmott
Australian Climate Leadership in 2026: COP-Out or Step-Up for Health?
Catherine G. A. Pendrey, Angie Bone, Aletha Ward, Francis Nona, Michelle Isles, Paul M. Kelly, Nicholas J. Talley
The impact of the Breast Screen NSW transition from film to digital mammography, 2002–2016: a linked population health data analysis
Rachel Farber, Nehmat Houssami, Katy J L Bell
Shifting focus to adolescent wellbeing and inclusive participation in the digital age
Allyson R Todd, Elena Wang, Stephanie R Partridge
The CURE Asthma roadmap
Gary P Anderson, Anthony Flynn, Phil G Bardin, John D Blakey, Shyamali C Dharmage, Paul Foster, Peter G Gibson, Adam Jaffe, Alan James, Christine R Jenkins, Sundram Sivamalai, Peter D Sly, Guy B Marks, Vanessa M McDonald, Judy Wetttenhall
Protecting public interest journalism as a public health good
Bronwyn Fredericks, Neha Lalchandani, Melissa A Sweet, Alex Cramb, Carmel Williams