


The known: Invasive group A Streptococcus (GAS) infections are associated with substantial morbidity and mortality. Population‐level data on invasive GAS disease in Australia are scarce, and none are available for Western Australia.
The new: The overall incidence of invasive GAS disease in WA increased markedly between 2001 and 2018, from 2 to 9 cases per 100 000 population; among Indigenous Australians, it increased from 14 to 64 cases per 100 000 population.
The implications: National mandatory notification of invasive GAS disease would be appropriate, and overcoming the social determinants of its incidence is important. Other reasons for its increasing incidence should be investigated.
Invasive Streptococcus pyogenes (group A Streptococcus, GAS) infections are associated with high morbidity, mortality, and financial costs.1 Reports of increasing incidence in Australia2 and overseas3 justify the surveillance of GAS infections. Contemporary estimates of disease burden are essential for assessing the value of GAS vaccine candidates4 and for policies regarding post‐exposure prophylaxis for close contacts of people with GAS infections.5
In Australia, invasive GAS infections are notifiable only in Queensland (incidence [2019], 6.7 cases per 100 000 population6) and the Northern Territory (incidence [2018], 31.2 cases per 100 000 population7). It was recently estimated that the overall incidence of invasive GAS disease in Australia during 2017–18 was 8.3 cases per 100 000 population,2 but it is higher among Indigenous Australians; the estimated incidence in the Northern Territory (2011‒2013) was 69.7 cases per 100 000 population.8
Western Australia is the largest Australian state, covering about one‐third of the continent; the population was 2.6 million people in 2018 (10% of the Australian population), including about 2 million living in the capital, Perth, and 4% of the population were Indigenous Australians.9,10 The climate ranges from tropical in the north, desert in the central regions, to temperate in the south. The climate of the Kimberley and Pilbara regions is tropical, and the proportion of Indigenous people is higher here than in other WA regions (2016: Kimberley, 42%; Pilbara, 14%).11 Regional, climate‐based, and demographic variation in health‐related variables can accordingly be explored in WA, as in our previous investigation of lower leg cellulitis, based on linked hospital and emergency department data.12,13,14
Differences between Indigenous and non‐Indigenous Australians in GAS disease burden have previously been reported.2 In this investigation, we quantified the burden of invasive GAS infections in WA during 2000–2018 in terms of incidence, length of hospital stay, and all‐cause mortality for the two population groups.
Methods
The reporting of our population‐based data linkage study conforms with the Reporting of studies Conducted using Observational Routinely‐collected health Data (RECORD) statement.15
Data sources
The WA Data Linkage System used best practice methods16 to link the Hospital Morbidity Data Collection (HMDC; comprising all WA public and private hospital records), PathWest pathology data (PathWest is the government‐owned pathology services provider for metropolitan and regional public hospitals), and death registrations. The linked data included a non‐identifying number for each included person.
Selection of cases
We analysed data for cases of GAS infection during 1 January 2000 – 31 December 2018. Microbiologically confirmed cases were identified in PathWest laboratory data, defined as cases in which GAS had been isolated from a normally sterile site (blood, other sterile fluid, sterile tissue). Diagnoses of GAS infection were identified in the HMDC by a principal International Classification of Diseases, tenth revision, Australian modification (ICD‐10‐AM) diagnostic code for GAS‐specific invasive disease. To be included, a case with a relevant principal diagnosis without a GAS‐specific descriptor (eg, osteomyelitis) had to be accompanied by the ICD‐10‐AM code for GAS infection (B95.0) as the first additional diagnosis, without any ICD‐10‐AM codes for other bacterial infection diagnoses. All cases of GAS infection according to PathWest or HMDC definitions, or both, were included in our analysis (Supporting Information, table 1).
Pathology data for patients were grouped by hospitalisation (regardless of whether the hospitalisation fulfilled the HMDC GAS infection definition) if samples were collected within two days of an admission date, including during prior outpatient clinic or emergency department specimen collection. The record date for a case was the first collection date for each episode, or the admission date if a confirmatory isolate was not available. All records for an individual within a 30‐day period were treated as a single case.8 Our analysis allowed more than one infection in an individual if the infection episodes were separated by more than 30 days. We also conducted an analysis in which only one case per individual was included, to assess incidence without intra‐individual repeat invasive GAS disease.
Characteristics of patients
Age, sex, hospital admission and separation (discharge) dates, diagnostic codes, region of residence, remoteness of residence area (major cities, inner regional, outer regional, remote, very remote),17 postcode‐based Socio‐Economic Indexes for Areas (SEIFA) index of relative social disadvantage (IRSD) quintiles,18 and admission to intensive care were extracted from the HMDC. Indigenous status was a validated variable provided as part of the linkage process. Date of death was extracted from death registrations. Region of residence was classified as tropical (Kimberley and Pilbara regions) or non‐tropical, and as metropolitan or regional. PathWest data included the unique patient identifier code, sample collection date, and isolation site. For cases identified only in PathWest data, relevant demographic data (eg, age, sex of the patient) were obtained from the HMDC, as it includes all hospital records for WA. Patients were classified as WA residents, Indigenous Australians, or as living in a tropical area if assigned these classifications for any part of a case.
Statistical analyses
All analyses were performed in Stata SE 14.0. Records of hospitalisations with dates later than a person’s date of death were removed (20 records, < 0.01% of all records). For five people with inconsistencies in month and year of birth (0.2% of individuals), the most recent data were included. Cases with missing demographic data were included, except in analyses stratified by the missing variable. We compared data for the periods 2000–2009 and 2010–2018 to assess broad changes during the study period. Seasonality was explored by wet (November – April) and dry (May – October) seasons for tropical areas, and by the usual four seasons for non‐tropical regions.
Data for WA residents only were included in incidence calculations. Mid‐year population denominators were obtained from Australian Bureau of Statistics census estimates and projections.9 Crude incidence was calculated, stratified by sex, age group, Indigenous status (from 2001, as relevant data for 2000 were not readily accessible), and region (from 2001, for the same reason). Direct age‐standardised annual incidence was calculated, standardised to the age distribution of cases in the year 2000 (the first study year). Incidence was analysed in negative binomial regressions (selected because the data were over‐dispersed) adjusted for year, age group, and sex, for Indigenous status and year, or by Indigenous status adjusted for year.
The proportional change in total crude incidence since 2001 attributable to the change in Indigenous status‐based incidence was calculated for each year by holding in turn the incidence for each group (Indigenous or non‐Indigenous) constant. The attributable proportion was the quotient of the difference in incidence from the 2001 level, with one group held constant, and the overall difference in incidence.19
Inter‐hospital transfers were treated as single admissions when calculating the median hospital length of stay. All‐cause mortality at 30 and 90 days after the record date was calculated. Differences in 30‐day mortality by Indigenous status were assessed by logistic regression, adjusted for age group and sex.
Ethics approval
Our study was approved by the WA Department of Health Human Research Ethics Committee (HREC) (2019/03) and the WA Aboriginal Health Ethics Committee (899). The University of Western Australia HREC acknowledged the external approval by the WA Department of Health HREC (RA/4/20/5695). A waiver of need for individual consent was granted.
Results
We identified 2237 cases of invasive GAS disease during 2000–2018: 1950 based on the PathWest definition (87%) and 656 according to the HMDC definition (29%); 369 HMDC‐confirmed cases (56%) also fulfilled the PathWest criterion, whereby the proportion was larger for public hospital cases (352 of 555, 63%) than private hospital cases (17 of 101, 17%). Group A Streptococcus was isolated from blood in 1089 of the 1950 pathology‐confirmed cases (56%), from tissue in 750 (38%), and from other sterile fluids in 224 cases (12%) (multiple isolates possible). While 1950 cases were based on the PathWest definition, more than one diagnostic code could be associated with each PathWest‐associated case because of the 30‐day case period and the possibility of inter‐hospital transfers. The most frequent principal diagnoses for hospitalisations with a corresponding GAS isolate (ie, samples within two days of admission) were GAS sepsis (289 of 2154 cases, 13%) and limb cellulitis (a diagnosis not included in the HMDC definition; 106 of 2154, 5%).
In more than one‐half of cases, the patients were boys or men (1283, 57%); the median age of patients was 44 years (interquartile range [IQR], 29–62 years). In 34% of cases, the patients were Indigenous people, and 19% of all cases were in tropical areas (Box 1). A total of 192 of 638 cases during 2000–2009 (30%) and 563 of 1599 during 2010–2018 (35%) were in Indigenous people. A larger proportion of cases in non‐Indigenous people were in boys or men than of those in Indigenous people (for cases with recorded sex: 838 of 1384, 61% v 385 of 753, 51%), and their median age was higher (47.5 years; IQR, 30–68 years v 42 years; IQR, 27–54 years). More than half the cases were in major cities (54%); 37% were in areas in the most disadvantaged IRSD quintile (Box 1). The proportion of cases in the lowest IRSD quintile was greater in tropical regions (201 of 429, 47%) than in non‐tropical areas (633 of 1791, 35%). Seasonality was not evident: 463 of 1791 non‐tropical cases had dates during summer (26%), 464 in autumn (26%), 467 in winter (26%), and 397 in spring (22%); 223 of 429 tropical cases had dates during the dry (52%) and 206 during the wet season (48%).
Incidence of invasive group A streptococcal disease
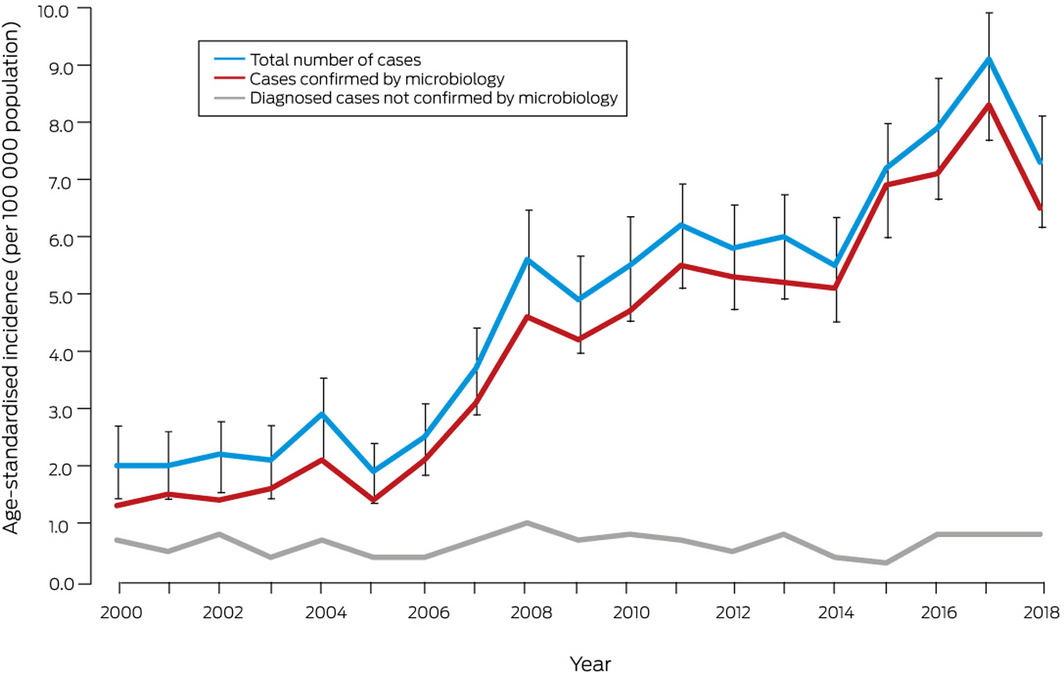
The age‐standardised incidence of invasive GAS disease increased from 2.0 cases (95% confidence interval [CI], 1.4–2.7 cases) per 100 000 population in 2000 to a peak of 9.1 cases (95% CI, 7.9–10.2 cases) per 100 000 population in 2017 (Box 2). The adjusted incidence rate ratio (IRR) for year of diagnosis since 2000 was 1.09 (95% CI, 1.08–1.10). An analysis restricted to one case per individual (115 cases were repeat infections in individuals [5%]) yielded results similar to those of the main analysis (Supporting Information, figure 1). The numbers of incident cases with blood or tissue isolates each increased over time (Supporting Information, figure 2).
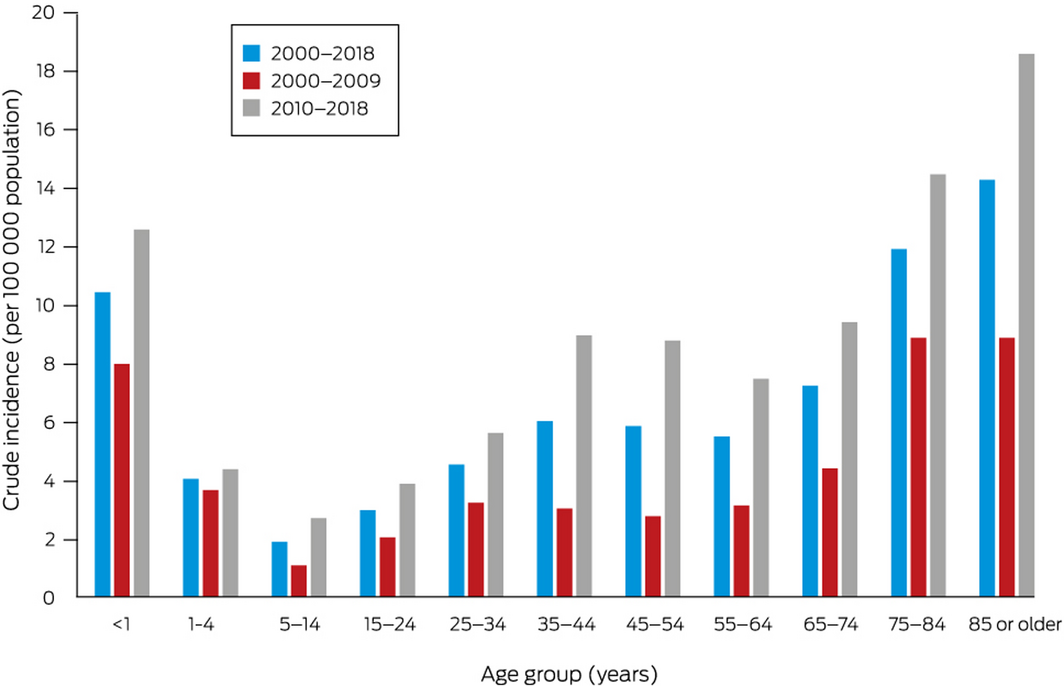
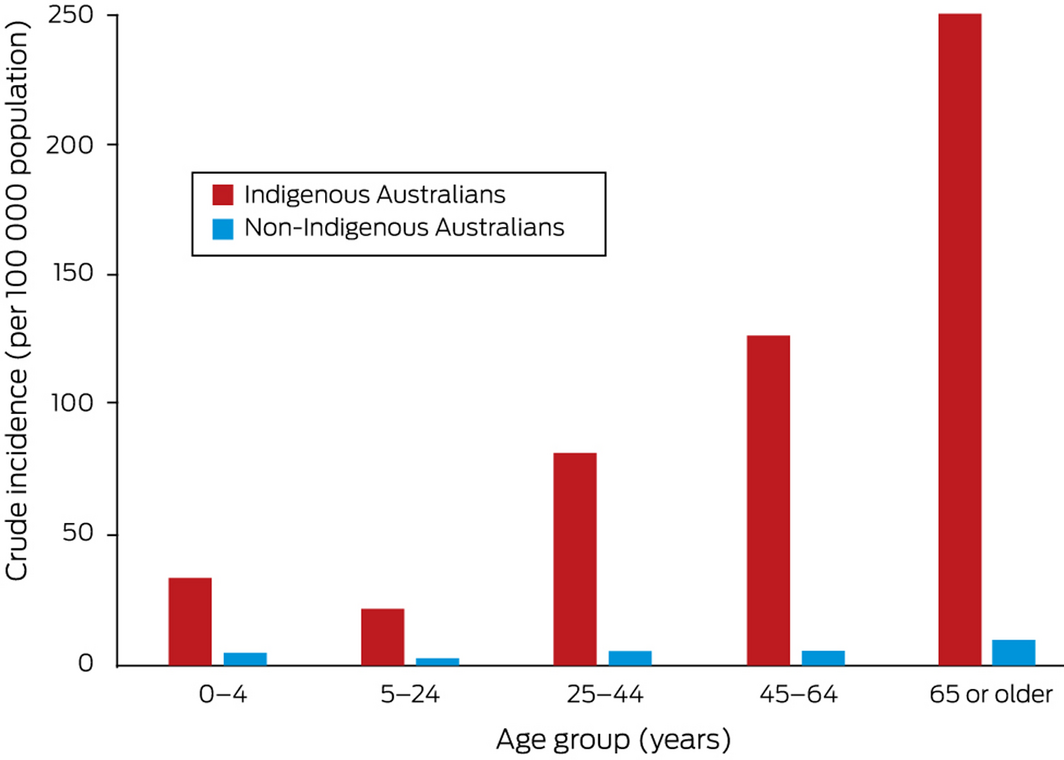
The overall incidence of invasive GAS disease was highest during the first year of life and for people aged 75 years or more (Box 3). Among Indigenous Australians, however, incidence increased fairly steadily with age (Box 4).
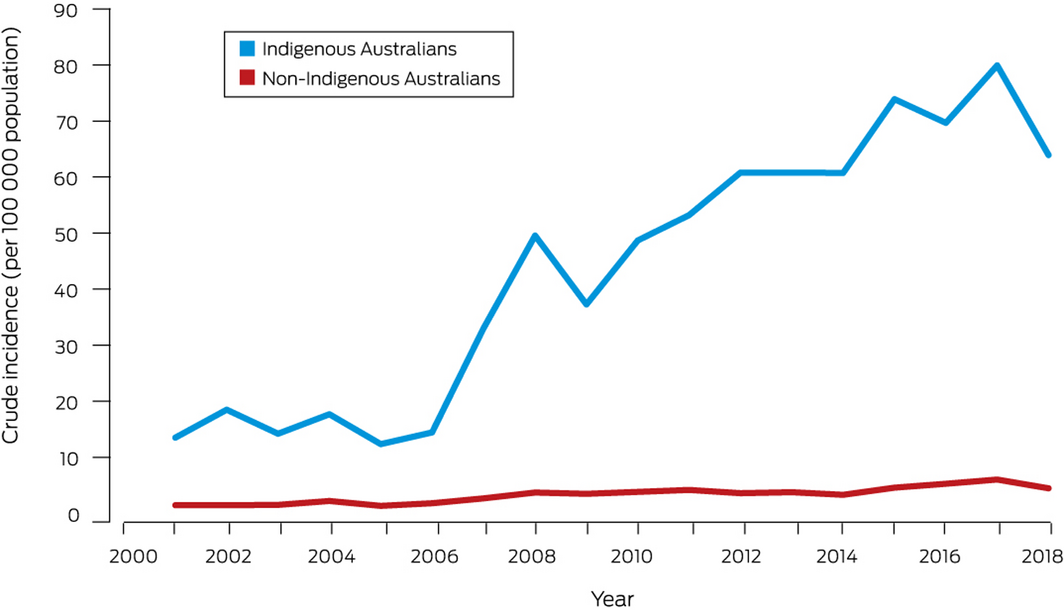
Crude incidence increased with time for both Indigenous (per year: IRR, 1.11; 95% CI, 1.09–1.14) and non‐Indigenous people (IRR, 1.08; 95% CI, 1.06–1.10). It was consistently higher for Indigenous than for non‐Indigenous Australians, peaking in 2017 at 79.9 cases (95% CI, 62.6–97.2 cases) and 6.0 cases (95% CI, 5.0–7.0 cases) per 100 000 population respectively (Box 5); the year‐adjusted IRR was 13.1 (95% CI, 11.3–15.1). Crude incidence was higher for Indigenous people in both metropolitan and regional areas (data not shown). During 2007–2018 (the period during which incidence increased), the mean proportion of the total rise in incidence since 2001 attributable to its increased incidence among Indigenous people was 41%.
Incidence was consistently higher among males than females (adjusted IRR, 1.38; 95% CI, 1.25–1.53; Supporting Information, figure 3) and in tropical than non‐tropical areas (Supporting Information, figure 4).
Hospital length of stay and all‐cause mortality
Median hospital length of stay was 7 days (IQR, 3–16 days); it was 6 days (IQR, 3–12 days) for Indigenous people and 8 days (IQR 4–18 days) for non‐Indigenous people.
In 116 cases (5%), the patient had died (of any cause) by 30 days, and in 156 cases (7%) by 90 days (Box 1). All‐cause mortality was lower at 30 days for Indigenous (27 of 755 cases, 4%) than non‐Indigenous patients (89 of 1390, 6%), but the difference was not statistically significant after adjustment for age group and sex (adjusted odds ratio, 0.8; 95% CI, 0.6–1.1). At 30 days, all‐cause mortality was higher in cases with blood culture GAS isolates (86 of 1089, 8%; no blood isolate: 30 of 1148, 3%) and for those in which the patient was admitted to intensive care (23 of 137 cases, 17%; not admitted to intensive care: 93 of 2100, 4%). In cases involving patients aged 85 years or more, 90‐day all‐cause mortality was 29% (26 of 90 cases; Supporting Information, table 2).
Discussion
We report the first population level study of the epidemiology of invasive GAS infections in WA, with the longest coverage period of any study of their epidemiology in Australia. We found that the incidence of invasive GAS infections has increased markedly over the past two decades, particularly among Indigenous Australians.
Our findings accord with a recent review that estimated the incidence of invasive GAS disease in Australia during 2017–18 to be 8.3 cases per 100 000 population.2 Their incidence has also increased in Canada, from 2.8 in 2000 to 8.6 cases per 100 000 population in 2018.3 The incidence of GAS disease is much lower in the United Kingdom (664 cases, or one case per 100 000 population in 2018).20
The high incidence of invasive GAS infections among Indigenous Australians is consistent with other Australian2 and overseas reports21 of higher incidence among indigenous peoples. The mean annual incidence of acute rheumatic fever, an immune‐mediated GAS complication, was also higher during 2013–2017 among Indigenous Australians in WA (mean 67.3 cases per 100 000 population; non‐Indigenous people: mean 0.3 cases per 100 000 population).22 Social determinants such as household overcrowding are the major factors underlying high rates of invasive GAS disease in disadvantaged populations.23 The incidence of impetigo, which predisposes to invasive GAS disease, is higher among Indigenous than non‐Indigenous Australians; measures for preventing impetigo include handwashing and chlorinated or salty swimming pools.24 The higher incidence of invasive GAS disease in tropical areas of WA is consistent with data for lower leg cellulitis in WA, primarily caused by β‐haemolytic streptococci.14 However, the proportion of cases in areas of greatest socio‐economic disadvantage was larger in tropical than non‐tropical regions, indicating that social determinants also play a role.
A combination of pathogen, host, and health system factors may explain the increasing incidence of GAS disease. The emergence of the M1T1 clone has contributed to a global resurgence of invasive GAS disease.1 Prospective emm typing of invasive GAS isolates could aid understanding of transmission and inform the local utility of GAS vaccine candidates.
The question of whether changes in the incidence of immunosuppressive comorbid conditions — for example, the prevalence of diabetes in Australia increased from 3.3% in 2001 to 4.4% in 2017‒1825 — has contributed to the rising incidence of invasive GAS disease could be investigated with the help of the HMDC data.
Health system factors could also be important. For example, awareness campaigns and altered clinical coding guidelines contributed to an increase in diagnoses of sepsis in Australia.26 However, the sharp increases in invasive GAS incidence during 2006‒2008 and 2015–2017 were largely related to increased numbers of microbiologically confirmed cases, so that the effect of any diagnostic coding changes was minor. Changes in testing practices in hospitals served by PathWest might explain some of the increase, and the West Australian Smart Application of Blood Culture Initiative is currently assessing PathWest blood culture practices since 2006.27
Our findings indicate that continued invasive GAS disease monitoring in WA is appropriate. National mandatory notification of invasive GAS disease would be useful for monitoring national incidence and targeting preventive strategies, including prophylaxis during outbreaks.5,28 Notifiability would also facilitate vaccine efficacy assessment and contact tracing.5
Limitations
Although it serves most public hospitals, PathWest is not the sole pathology provider in WA (estimated population coverage for blood cultures, 80%; personal communication, Susan Benson [Curtin University and University of Western Australia], Oct 2020). For this reason, we augmented laboratory data with hospital records, including 287 cases (13%) without laboratory confirmation. The proportion of microbiologically confirmed HMDC cases was larger for public than private hospitals, which suggests that HMDC cases without PathWest confirmations were probably confirmed by private microbiology providers. The conservative diagnostic definition for HMDC cases minimised the effect of any HMDC coding errors. The administrative data we analysed were not collected for research purposes, but the use of these data in clinical practice (PathWest), clinical activity reporting (HMDC), and for informing national mortality data (death registrations) meant that the linked data analysis was appropriate for our study.
Conclusion
The incidence of invasive GAS disease in WA increased between 2000 and 2018, particularly among Indigenous Australians. Mandatory notification of invasive GAS disease would therefore be appropriate. The social determinants of the differences in incidence should be addressed, and other host, pathogen, and health system factors underlying the increasing incidence should be investigated.
Box 1 – Invasive group A streptococcal infection cases, Western Australia, 2000–2018: summary data
|
Characteristic |
|
||||||||||||||
|
|
|||||||||||||||
|
Number of cases |
2237 |
||||||||||||||
|
Sex of patient |
|
||||||||||||||
|
Male |
1283 (57.4%) |
||||||||||||||
|
Female |
937 (41.9%) |
||||||||||||||
|
Missing data/unknown |
17 (0.8%) |
||||||||||||||
|
Age group (years) |
|
||||||||||||||
|
< 1 |
60 (2.7%) |
||||||||||||||
|
1–4 |
91 (4.1%) |
||||||||||||||
|
5–14 |
105 (4.7%) |
||||||||||||||
|
15–24 |
183 (8.2%) |
||||||||||||||
|
25–34 |
292 (13.1%) |
||||||||||||||
|
35–44 |
380 (17.0%) |
||||||||||||||
|
45–54 |
342 (15.3%) |
||||||||||||||
|
55–64 |
259 (11.6%) |
||||||||||||||
|
65–74 |
218 (9.7%) |
||||||||||||||
|
75–84 |
200 (8.9%) |
||||||||||||||
|
≥ 85 |
90 (4.0%) |
||||||||||||||
|
Missing data/unknown |
17 (0.8%) |
||||||||||||||
|
Indigenous status |
|
||||||||||||||
|
Indigenous |
755 (33.8%) |
||||||||||||||
|
Non‐Indigenous |
1390 (62.1%) |
||||||||||||||
|
Missing data/unknown |
92 (4.1%) |
||||||||||||||
|
Region of occurrence |
|
||||||||||||||
|
Non‐tropical |
1791 (80.1%) |
||||||||||||||
|
Tropical |
429 (19.2%) |
||||||||||||||
|
Missing data/unknown |
17 (0.8%) |
||||||||||||||
|
Remoteness* |
|
||||||||||||||
|
Major cities |
1214 (54.3%) |
||||||||||||||
|
Inner regional |
144 (6.4%) |
||||||||||||||
|
Outer regional |
237 (10.6%) |
||||||||||||||
|
Remote |
292 (13.1%) |
||||||||||||||
|
Very remote |
261 (11.7%) |
||||||||||||||
|
Missing data/unknown |
89 (4.0%) |
||||||||||||||
|
Socio‐economic status† |
|
||||||||||||||
|
Most disadvantaged |
834 (37.3%) |
||||||||||||||
|
More disadvantaged |
463 (20.7%) |
||||||||||||||
|
Moderately disadvantaged |
399 (17.8%) |
||||||||||||||
|
Less disadvantaged |
247 (11.0%) |
||||||||||||||
|
Least disadvantaged |
277 (12.4%) |
||||||||||||||
|
Missing data/unknown |
17 (0.8%) |
||||||||||||||
|
All‐cause deaths |
|
||||||||||||||
|
30 days |
116 (5.2%) |
||||||||||||||
|
90 days |
156 (7.0%) |
||||||||||||||
|
|
|||||||||||||||
|
* Australian Statistical Geography Standard (ASGS) remoteness structure.17 † Socio‐Economic Indexes for Areas (SEIFA) Index of Relative Social Disadvantage (IRSD) quintiles.18 |
|||||||||||||||
Box 2 – Age‐standardised incidence of invasive group A streptococcal disease (with 95% confidence intervals for overall incidence), Western Australia, 2000–2018, by confirmation type
Box 3 – Crude incidence of invasive group A streptococcal disease, Western Australia, 2000–2018, by age group
Received 29 October 2020, accepted 8 March 2021
- Cameron M Wright1,2,3,4
- Rachael Moorin3,5
- Glenn Pearson6
- John R Dyer2
- Jonathan R Carapetis1,6,7,8
- Laurens Manning1,2,6
- 1 The University of Western Australia, Perth, WA
- 2 The Fiona Stanley Fremantle Hospitals Group, Perth, WA
- 3 Curtin University, Perth, WA
- 4 University of Tasmania, Hobart, TAS
- 5 Centre for Health Services Research, University of Western Australia, Perth, WA
- 6 Telethon Kids Institute, University of Western Australia, Perth, WA
- 7 Wesfarmers Centre of Vaccines and Infectious Diseases, Telethon Kids Institute, Perth, WA
- 8 Perth Children’s Hospital, Perth, WA
Data acquisition costs for this study were jointly funded by the Telethon Kids Institute and the Department of Infectious Diseases, the Fiona Stanley Fremantle Hospitals Group. We acknowledge the WA Data Linkage Branch for providing the linked data, Ryan Shave (WA Department of Health) for assistance with research governance approvals, Brett Cawley (PathWest) for assisting with identifying PathWest cases, Susan Benson (Curtin University, University of Western Australia) for assisting with blood culture results interpretation, and the people whose data were analysed in this study. Cameron Wright completed this work as part of scholarly activity for his Doctor of Medicine degree from the University of Western Australia.
No relevant disclosures.
- 1. Barnett TC, Bowen AC, Carapetis JR. The fall and rise of Group A Streptococcus diseases. Epidemiol Infect 2018; 147: 1–6.
- 2. Wright CM, Langworthy K, Manning L. The Australian burden of invasive group A streptococcal disease: a narrative review. Intern Med J 2020; https://doi.org/10.1111/imj.14885 [online ahead of print].
- 3. Public Health Agency of Canada. Reported cases from 1924 to 2017 in Canada. Notifiable diseases on‐line. https://dsol-smed.phac-aspc.gc.ca/notifiable/charts?c=pl#c=pl&lang=en_US (viewed Aug 2020).
- 4. Cannon JW, Jack S, Wu Y, et al. An economic case for a vaccine to prevent group A streptococcus skin infections. Vaccine 2018; 36: 6968–6978.
- 5. Mearkle R, Saavedra‐Campos M, Lamagni T, et al. Household transmission of invasive group A Streptococcus infections in England: a population‐based study, 2009, 2011 to 2013. Euro Surveill 2017; 22: 30532.
- 6. Queensland Health. Notifiable conditions annual reporting. https://www.health.qld.gov.au/clinical-practice/guidelines-procedures/diseases-infection/surveillance/reports/notifiable/annual (viewed Mar 2020).
- 7. Northern Territory Department of Health. NT notifications of diseases by onset date and districts. 1 January – 31 December 2017 and 2018. NT Disease Control Bulletin 2019; 26(1): 27. https://digitallibrary.health.nt.gov.au/prodjspui/bitstream/10137/506/567/Vol.%2026%20no%201%20March%202019.pdf (viewed Mar 2020).
- 8. Boyd R, Patel M, Currie BJ, et al. High burden of invasive group A streptococcal disease in the Northern Territory of Australia. Epidemiol Infect 2016; 144: 1018–1027.
- 9. Australian Bureau of Statistics. 3101.0. Australian demographic statistics, Mar 2018. Table 4. Estimated resident population, states and territories (Number). Sept 2018. https://www.abs.gov.au/AUSSTATS/abs@.nsf/DetailsPage/3101.0Mar%202018?OpenDocument (viewed Mar 2019).
- 10. Australian Bureau of Statistics. Estimates and projections, Aboriginal and Torres Strait Islander Australians. July 2019. https://www.abs.gov.au/statistics/people/aboriginal-and-torres-strait-islander-peoples/estimates-and-projections-aboriginal-and-torres-strait-islander-australians/latest-release (viewed Oct 2020).
- 11. Data WA (Government of Western Australia). Regional population data. https://catalogue.data.wa.gov.au/dataset/western-australia-regional-population/resource/eeecaf08-55e3-4026-99fc-f98a383e2812 (viewed Sept 2020).
- 12. Cannon J, Dyer J, Carapetis J, Manning L. Epidemiology and risk factors for recurrent severe lower limb cellulitis: a longitudinal cohort study. Clin Microbiol Infect 2018; 24: 1084–1088.
- 13. Cannon J, Rajakaruna G, Dyer J, Carapetis J. Severe lower limb cellulitis: defining the epidemiology and risk factors for primary episodes in a population‐based case–control study. Clin Microbiol Infect 2018; 24: 1089–1094.
- 14. Manning L, Cannon J, Dyer J, et al. Seasonal and regional patterns of lower leg cellulitis in Western Australia. Intern Med J 2019; 49: 212–216.
- 15. Benchimol EI, Smeeth L, Guttmann A, et al; RECORD Working Committee. The REporting of studies Conducted using Observational Routinely‐collected health Data (RECORD) statement. PLoS Med 2015; 12: e1001885.
- 16. Kelman CW, Bass AJ, Holman CDJ. Research use of linked health data: a best practice protocol. Aust N Z J Public Health 2002; 26: 251–255.
- 17. Australian Bureau of Statistics. The Australian Statistical Geography Standard (ASGS) remoteness structure. 2016. http://www.abs.gov.au/websitedbs/d3310114.nsf/home/remoteness+structure (viewed Oct 2018).
- 18. Australian Bureau of Statistics. Socioeconomic indices for areas. Updated Mar 2018. http://www.abs.gov.au/websitedbs/censushome.nsf/home/seifa (viewed Oct 2018).
- 19. Wright CM, Bulsara MK, Norman R, et al. Increase in computed tomography in Australia driven mainly by practice change: a decomposition analysis. Health Policy 2017; 121: 823–829.
- 20. Public Health England. Notifiable diseases: 2018 annual figures. https://www.gov.uk/government/publications/notifiable-diseases-annual-report (viewed Oct 2020).
- 21. Close RM, McAuley JB. Disparate effects of invasive group A Streptococcus on Native Americans. Emerg Infect Dis 2020; 26: 1971–1977.
- 22. Australian Institute of Health and Welfare. Acute rheumatic fever and rheumatic heart disease data collection report 2013–2017 (cat. no. CVD 86). https://www.aihw.gov.au/reports/indigenous-australians/acute-rheumatic-fever-rheumatic-heart-disease/data (viewed Oct 2020).
- 23. Coffey PM, Ralph AP, Krause VL. The role of social determinants of health in the risk and prevention of group A streptococcal infection, acute rheumatic fever and rheumatic heart disease: a systematic review. PLoS Negl Trop Dis 2018; 12: e0006577.
- 24. Davidson L, Knight J, Bowen AC. Skin infections in Australian Aboriginal children: a narrative review. Med J Aust 2020; 212: 231–237. https://www.mja.com.au/journal/2020/212/5/skin-infections-australian-aboriginal-children-narrative-review
- 25. Australian Institute of Health and Welfare. Diabetes (cat. no. CVD 82). Updated July 2020. https://www.aihw.gov.au/reports/diabetes/diabetes/contents/how-many-australians-have-diabetes (viewed Oct 2020).
- 26. Li L, Sunderland N, Rathnayake K, et al; Australian Commission on Safety and Quality in Health Care. Epidemiology of sepsis in Australian public hospitals. A mixed methods, national longitudinal study (2013‒2018). Feb 2020. https://www.safetyandquality.gov.au/publications-and-resources/resource-library/epidemiology-sepsis-australian-public-hospitals (viewed Aug 2020).
- 27. PathWest Laboratory Medicine WA. Annual report 2018/19. https://www.parliament.wa.gov.au/publications/tabledpapers.nsf/displaypaper/4012846a5b7f259582061a7e482584810006459f/$file/2846.pdf (viewed Aug 2020).
- 28. Centre for Disease Control (Northern Territory). Public health management of invasive group A streptococcal infection. Nov 2015. https://digitallibrary.health.nt.gov.au/prodjspui/bitstream/10137/1187/1/iGAS%20guidelines%20Nov%202015.pdf (viewed Jan 2021).
Abstract
Objective: To quantify the burden of invasive group A Streptococcus (GAS) disease in Western Australia during 2000–2018.
Design, setting: Population‐based data linkage study: Hospital Morbidity Data Collection (HMDC; all WA public and private hospital records), PathWest pathology data (government‐owned pathology services provider), and death registrations.
Participants: People with invasive GAS disease, defined by an isolate from a normally sterile site (PathWest) or a hospital‐based principal ICD‐10‐AM diagnosis code (HMDC).
Main outcome measures: Incidence of invasive GAS disease; median length of hospital stay; all‐cause mortality.
Results: We identified 2237 cases of GAS disease during 2000‒2018; 1283 were in male patients (57%). 1950 cases had been confirmed by GAS isolates from normally sterile tissues (87%; including 1089 from blood [56% of cases] and 750 from tissue [38%]). The age‐standardised incidence increased from 2.0 (95% CI, 1.4–2.7) cases per 100 000 population in 2000 to 9.1 (95% CI, 7.9–10.2) cases per 100 000 in 2017 (by year, adjusted for age group and sex: incidence rate ratio [IRR], 1.09; 95% CI, 1.08–1.10). Incidence was consistently higher among Indigenous than non‐Indigenous Australians (year‐adjusted IRR, 13.1; 95% CI, 11.3–15.1). All‐cause 30‐day mortality was 5% (116 deaths), and 90‐day mortality 7% (156 deaths); 30‐day mortality, adjusted for age group and sex, was not statistically significantly different for cases involving Indigenous or non‐Indigenous patients (adjusted odds ratio, 0.8; 95% CI, 0.6–1.1).
Conclusions: The incidence of invasive GAS disease in WA increased between 2000 and 2018, particularly among Indigenous Australians. Mandatory notification of invasive GAS disease would therefore be appropriate. The social determinants of differences in incidence should be addressed, and other relevant host, pathogen, and health system factors investigated.