


The known: The first epidemic wave of COVID‐19 in Australia was centred in Sydney, predominantly among returned travellers.
The new: Seroprevalence of SARS‐CoV‐2‐specific IgG antibodies in Sydney after the first local wave of the pandemic was below 1% for the three population subgroups examined: people who had pathology blood tests (all ages), women aged 20–39 years who underwent antenatal screening, and Australian Red Cross Lifeblood plasmapheresis donors (aged 20–69 years).
The implications: Community transmission of SARS‐CoV‐2 was low during the first epidemic wave in Sydney, but efforts to minimise transmission are still very important.
The severe acute respiratory syndrome coronavirus 2 (SARS‐CoV‐2) was first detected as a cause of human disease, coronavirus disease 2019 (COVID‐19), in December 2019, in Wuhan, China; a pandemic was declared by the World Health Organization on 11 March 2020.1 In Australia, the first recorded infection was diagnosed in Sydney in a traveller from Wuhan who had provided a nasal sample on 22 January 2020.2
In the following months, the daily number of COVID‐19 diagnoses, based on nucleic acid testing (NAT) for SARS‐CoV‐2, increased in Australia to a peak of 469 on 28 March, followed by a rapid decline as national and state‐based public health measures were imposed. During this first wave (March–April 2020), nearly half of the 6932 confirmed SARS‐CoV‐2 infections in Australia were in New South Wales, including 60% among returned travellers in Sydney, many in quarantine. Community transmission appeared to be sporadic rather than widespread.3,4
The total number of SARS‐CoV‐2 infections in the community exceeds the number of reported cases, primarily because infected people who develop no or only mild symptoms do not attend clinical services for virus testing and diagnosis, while others do not seek testing while unwell.5 Serological surveys (serosurveys) that assess the prevalence of SARS‐CoV‐2‐specific antibodies can help estimate how many people in the community have previously been infected with SARS‐CoV‐2, regardless of symptoms or presentation for testing.5 Such surveys have been undertaken in many countries, applying a variety of sample collection and testing methodologies.6
The Australian Department of Health has endorsed serosurveys as a core component of the national COVID‐19 Surveillance Plan.7 In line with this strategy and the enhanced COVID‐19 surveillance plan of NSW Health,8 we undertook the first large population‐based serosurvey in Australia, with the aim of estimating the seroprevalence of SARS‐CoV‐2‐specific antibodies in metropolitan Sydney following the initial wave of the epidemic. We analysed residual blood specimens collected for other purposes, a cost‐ and time‐efficient serosurveillance strategy that does not require direct contact with participants (particularly important during a pandemic).
Methods
Data sources
De‐identified residual blood specimens (sera and heparinised plasma) from three metropolitan Sydney target subpopulations were collected, providing complementary data:
- people of all ages who had provided blood for testing at selected diagnostic pathology services (general pathology group);
- pregnant women aged 20–39 years who had undergone routine antenatal screening; and
- Australian Red Cross Lifeblood plasmapheresis donors, a healthy adult population aged 20–69 years.
General pathology specimens were obtained from six NSW Health pathology laboratories across Sydney and three large private pathology services (Douglass Hanly Moir Pathology, 4Cyte Pathology, Laverty Pathology). Antenatal screening specimens were obtained from the same private laboratories as the general pathology specimens. Blood donor specimens were obtained from the Australian Red Cross Lifeblood processing centre in Sydney.
We analysed specimens from people living in postcodes within the Statistical Area level 4 (SA4) regions of the Sydney Greater Capital City Statistical Area.9 General pathology specimens were excluded if they were collected from hospital inpatients (to exclude people possibly admitted with COVID‐19) or if SARS‐CoV‐2 antibody testing had been specifically requested during collection (to reduce selection bias). Samples from blood donors actively recruited to donate convalescent plasma after diagnosis with COVID‐19 were also excluded. For each specimen, date of birth, sex, postcode of residence, and date of specimen collection were recorded to ensure that only one specimen per individual was included in our analysis.
Target sample size and distribution
We calculated that a sample size of 350 specimens per 10‐year age group in each collection group was required to exclude seroprevalence exceeding 2.0% at the 95% confidence level, assuming that estimated seropositivity did not exceed 0.6% (2 in 350), consistent with expert judgement that community seroprevalence was unlikely to be more than 20 times as high as the cumulative incidence of notified cases. To obtain a geographically representative sample, we aimed to collect specimens from across the 14 SA4 regions of the Sydney Greater Capital City Statistical Area in numbers proportional to the size of the population in each SA4,9 based on postcode of residence.
SARS‐CoV‐2‐specific antibody testing
Antibody testing was performed at the Institute of Clinical Pathology and Medical Research (Westmead Hospital, Sydney), using a validated in‐house immunofluorescent antibody (IFA) assay.10 Specimens were deemed positive if the SARS‐CoV‐2‐specific IgG titre was at least 10 by IFA (peak titre: > 2560).10 The sensitivity of this test in sera collected from people with suspected COVID‐19 14 days or more after illness onset (compared with the reference standard of SARS‐CoV‐2 NAT of upper respiratory tract swabs at the time of presentation) was 90.7% (95% confidence interval [CI], 83.9–95.3%) and its specificity was 99.3% (95% CI, 98.9–99.6%). IgG‐positive specimens were further tested for IgA and IgM by IFA and for SARS‐CoV‐2‐specific neutralising antibodies with an in‐house micro‐neutralisation assay (titre ≥ 10 deemed positive).
Statistical analysis
The age, sex, and SA4 distribution of each collection group was compared with that of reference populations as appropriate: the 2019 Australian Bureau of Statistics (ABS) estimated residential population (ERP);9 estimated numbers of women who received antenatal care (based on the ERP for women in 2019 and fertility rates during 2016–2018);11 and the numbers of Lifeblood plasmapheresis donors in 2019 (data from the national blood donor management system, supplied by Lifeblood). For each collection group, the crude proportion of samples with IFA IgG titres of 10 or more was calculated. In addition, the distributions of positive samples by age group, sex, and SA4 are reported. The proportions of samples in each collection group with high (≥ 160) and low IgG titres (10) and those also positive for IgA/IgM or neutralising antibodies were compared.
We used Bayesian analysis to estimate the proportions of seropositive people in each collection group, adjusted for test sensitivity and specificity and incorporating the uncertainty in their estimate values (online Supporting Information). Population‐weighted estimates could not be obtained because of the small number of positive samples. Seroprevalence was summarised as the median value with the 95% credible interval (highest posterior density interval) of its posterior distribution. The base case prior distribution for seroprevalence assumed uniform probability density for seroprevalence values between 0.04% (lower bound based on the ratio of notified cases to the ABS ERP) and 100%; this conservative assumption is consistent with preferring non‐informative prior assumptions. We also undertook a sensitivity analysis assuming an alternative prior distribution that assigned a relatively higher probability to lower seroprevalence estimates.
We estimated the cumulative number of SARS‐CoV‐2 infections in the population by multiplying the seroprevalence point estimate and 95% credible interval for the general pathology collection group by the 2019 ABS ERP for Sydney.9 The general pathology collection group was used for this calculation as it included all age groups, was the largest sample, and included the largest number of IgG‐positive samples. We then estimated the ratio of infections to notified NAT‐positive cases (infection‐to‐case ratio), based on the cumulative number of notified cases 14 days before the midpoint of the collection period (30 April 2020; data supplied by NSW Health).
Ethics approval
Ethics approval was provided by the Sydney Children’s Hospital Network Human Research Ethics Committee (reference, HREC/17/SCHN/245) and the Australian Red Cross Lifeblood Ethics Committee (reference, 2020#07).
Results
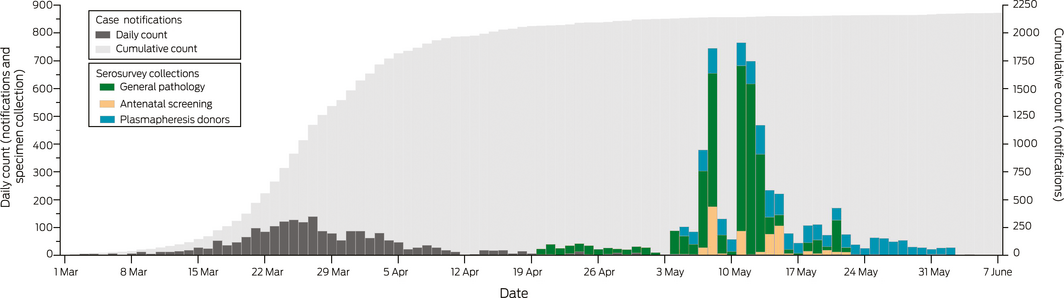
In total, 5339 eligible blood specimens were provided for our study: 3231 general pathology, 560 antenatal screening, and 1548 plasmapheresis donor specimens (Box 1). The specimens had been collected during 20 April – 22 May (general pathology), 4–23 May (antenatal screening), and 5 May – 2 June 2020 (blood donors) (Box 2). The target sample size was reached for most age groups; the largest shortfalls were for children under 10 years of age and for 60–69‐year‐old blood donors. The sex and location distributions of the collection groups were broadly similar to those of the target populations, but the proportion of antenatal collection samples from the Outer West and Blue Mountains was larger and those from Blacktown and the Inner South West regions smaller than for the antenatal screening population (Box 1).
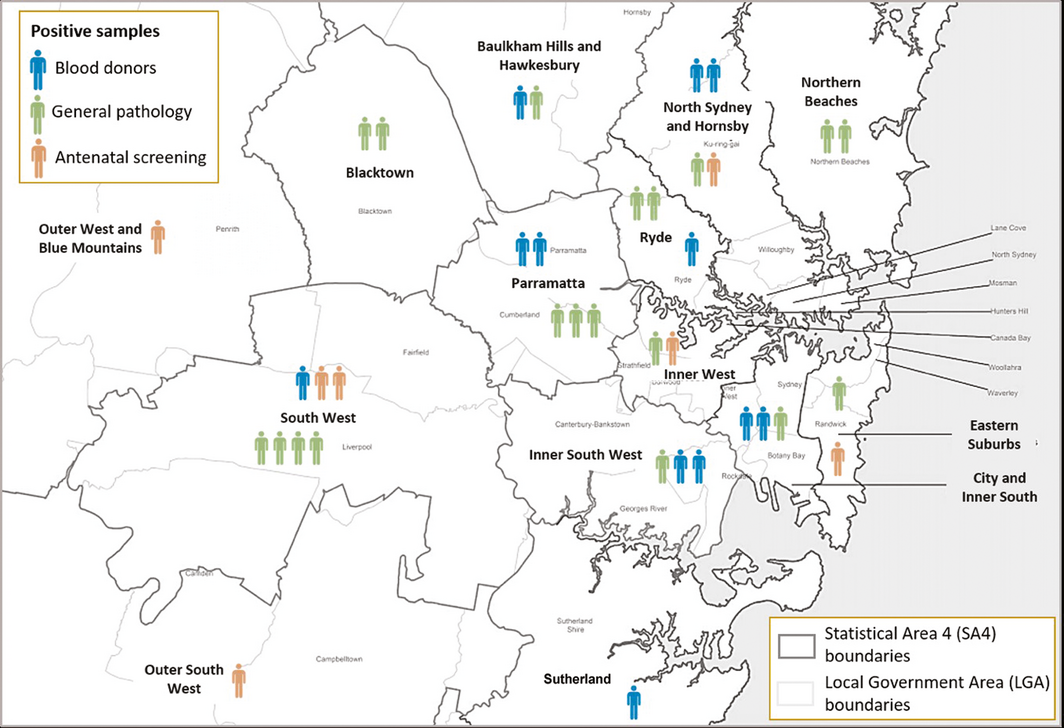
SARS‐CoV‐2‐specific IgG was detected by IFA in 38 samples (19 general pathology, seven antenatal screening, 12 Lifeblood specimens). IgG‐positive samples were derived from across the Sydney metropolitan region, with the highest numbers from the neighbouring South‐West (seven) and Parramatta SA4s (five) (Box 3). Six of the 38 SARS‐CoV‐2‐specific IgG‐positive samples were also positive for IgM or IgA; the IgG titre for 16 of the 38 specimens (including three of six positive for IgM or IgA) was 10. Neutralising antibodies were detected in 24 of 38 IgG‐positive specimens (63%); the proportion was smaller for general pathology samples (eight of 19, 42%) than for antenatal (five of seven, 71%) and plasmapheresis donor samples (11 of 12, 92%) (Box 4).
The crude seroprevalence was 0.6% for general pathology samples, 0.8% for Lifeblood samples, and 1% for antenatal screening samples. The numbers of IgG‐positive samples were insufficient to determine any patterns by age group or sex within collection groups (Box 5). However, the number of seropositive 20–29‐year‐old plasmapheresis donors was higher than for other age groups in this collection, and there were no seropositive children under 10 years of age in the general pathology collection. After adjusting for antibody test sensitivity and specificity, median estimated seroprevalence ranged from 0.15% (general pathology, all ages) to 0.79% (antenatal screening) with the base case prior distribution, and from 0.09% (general pathology, all ages) to 0.41% (antenatal screening) with the alternative prior distribution (Box 6).
Based on the seroprevalence point estimate of 0.15% (95% credible interval, 0.04–0.41%) for the general pathology group (all ages), the estimated cumulative number of SARS‐CoV‐2 infections in Sydney (population, 5 million) was 7450 (plausible range, 2118–20 370), or one in 670 people. As the number of notified cases to 30 April 2020 was 2118, the estimated infection‐to‐case ratio was 3.5:1 (plausible range, 1.0–9.6:1).
Discussion
We report the first large scale assessment of the seroprevalence of SARS‐CoV‐2 in Australia, based on samples from three population groups in Sydney, the city most affected by the first epidemic wave. Estimated seroprevalence was less than 1%, and there were no marked differences by age group, sex, or geographic location. The low seroprevalence we found is consistent with other data, particularly case‐based notifications, indicating that community transmission of SARS‐CoV‐2 during the first wave was limited.
The SARS‐CoV‐2 antibody profiles of seropositive people were consistent with what is known about antibody kinetics. The IgG antibody titre was high in only a few specimens, consistent with evidence that most infections during the first wave were mild or asymptomatic, cases that are associated with lower antibody levels than more severe disease.12 Peak IgM and IgA levels are lower than for SARS‐CoV‐2‐specific IgG, and they decline more rapidly, in most cases to undetectable levels by six weeks.10,12,13 It was therefore unsurprising that few IgG‐positive specimens in our survey were also positive for IgM or IgA, given the period during which they were collected. SARS‐CoV‐2‐neutralising antibody was detected in 24 of 38 of IgG‐positive specimens (63%), but the proportion differed by collection group. Most studies have found that more than 90% of SARS‐CoV‐2‐infected people developed neutralising antibodies,14 but most were studies of hospitalised patients and may therefore reflect the higher antibody levels generated during more severe disease.12,13,15 Alternatively, the IFA detection of IgG in some samples without detectable neutralising antibody may have been false positive results.
Comparisons with other SARS‐CoV‐2 serosurveys are complicated by differences in the target populations and age groups sampled, laboratory tests, and the stage of the pandemic at which samples were collected. However, our results are consistent with the only other Australian SARS‐CoV‐2 serosurvey to date, of specimens from adults admitted to selected hospitals in NSW, Victoria, South Australia, and Western Australia for elective surgery during June–July 2020 (seroprevalence, 0.28%; 95% CI, 0–1.15%; estimated infection‐to‐case ratio, 7–10:1).16 The findings of this and our serosurvey contrast with estimates from many countries in Europe, Asia (particularly India), and the Americas, where pandemic control has been less effective and reported seroprevalence has exceeded 10%.6
Strengths and limitations
A key strength of our study was its inclusion of samples from three different populations with complementary characteristics. Women receiving antenatal care comprise a relatively healthy population that is stable over time, and they probably sought care in a manner not substantially affected by the pandemic. Lifeblood donors are healthy adults from both sexes, but would have been ineligible to donate for 28 days after the resolution of any symptoms consistent with COVID‐19. Patients from all age groups submit blood to diagnostic pathology services, but people with underlying illnesses, who were more likely to have isolated themselves to avoid infection, may be overrepresented. Our samples were reasonably representative of the three populations by location and sex. Further strengths were the high sensitivity and specificity of our assay, validated across a broad range of ages and symptoms (including people with mild disease who were not hospitalised) and using samples derived from the same geographic locations as the specimens in our study.10
On the other hand, in contrast to more recent high throughput enzyme‐linked immunosorbent assay (ELISA)‐based tests that facilitate standardised testing, in‐house IFA and micro‐neutralisation tests are labour‐intensive and require a high level of laboratory expertise. Further, our third group included only plasmapheresis blood donors because specimens appropriate for IFA were not available for other blood donors. The relatively small number of IgG‐positive specimens limited our ability to detect differences between subgroups, and prevented us reliably estimating an infection fatality ratio or performing population‐weighted adjustments of our seroprevalence estimates.
Our estimated infection‐to‐case ratio should be interpreted with caution. The plausible range is wide because of the small numbers of antibody‐positive specimens. Further, NAT testing guidelines changed during the epidemic: the initial focus was on returned travellers and close contacts of people with confirmed infections, but testing criteria were broadened in April 2020 to include anyone with mild respiratory symptoms or unexplained fever, a change supported by increased testing capacity.4 It is likely that the proportion of infections detected by NAT increased with the expanded criteria, potentially reducing the ratio of infections to notified cases.
Conclusion
Our study provides robust evidence that community transmission of SARS‐CoV‐2 was limited during the first COVID‐19 wave in Sydney. This is probably attributable to the early implementation of national and state‐based public health measures, including the rapid expansion of test and contact tracing capacity, strict border controls and quarantining of overseas travellers, restrictions on public movement and mixing, and a high degree of compliance with these measures by the public.17 Our findings highlight the successful control of COVID‐19 in Sydney, but minimising the spread of SARS‐CoV‐2 is still important, as are effective vaccination programs. Our serosurveillance approach provides a feasible framework for repeated assessment of SARS‐CoV‐2 transmission over time; we are currently employing similar methodology to conduct a national serosurvey, but using recommended ELISA assays to facilitate international comparisons. This strategy may also be important for evaluating population‐level immune responses after the introduction of COVID‐19 vaccines.
Data access
The authors have full access to all data (including statistical reports and tables) from this study.
Box 1 – Demographic characteristics of the three collection groups and the corresponding comparator populations
|
Characteristic |
Collection group and comparator |
||||||||||||||
|
General pathology |
2019 ABS estimated residential population9 |
Antenatal screening |
Plasmapheresis donors |
Plasmapheresis donor population |
|||||||||||
|
|
|||||||||||||||
|
Total number |
3231 |
4 968 147 |
560 |
62 617 |
1548 |
25 044 |
|||||||||
|
Age group (years) |
|
|
|
|
|
|
|||||||||
|
0– < 10 |
201 (6.2%) |
628 678 (12.7%) |
— |
— |
— |
— |
|||||||||
|
10– < 20 |
469 (14.5%) |
576 303 (11.6%) |
— |
— |
— |
— |
|||||||||
|
20– < 30 |
419 (13.0%) |
810 753 (16.3%) |
224 (40.0%) |
21 557 (34.4%) |
364 (23.5%) |
8561 (34.2%) |
|||||||||
|
30– < 40 |
282 (8.7%) |
814 907 (16.4%) |
336 (60.0%) |
41 060 (65.6%) |
389 (25.1%) |
6762 (27.0%) |
|||||||||
|
40– < 50 |
357 (11.0%) |
657 063 (13.2%) |
— |
— |
317 (20.5%) |
4271 (17.1%) |
|||||||||
|
50– < 60 |
367 (11.4%) |
566 991 (11.4%) |
— |
— |
287 (18.5%) |
3380 (13.5%) |
|||||||||
|
60– < 70 |
349 (10.8%) |
444 479 (8.9%) |
— |
— |
191 (12.3%) |
2070 (8.3%) |
|||||||||
|
70– < 80 |
350 (10.8%) |
291 759 (5.9%) |
— |
— |
— |
— |
|||||||||
|
≥ 80 |
437 (13.5%) |
177 214 (3.6%) |
— |
— |
— |
— |
|||||||||
|
Sex |
|
|
|
|
|
|
|||||||||
|
Males |
1518 (47.0%) |
2 473 581 (49.8%) |
— |
— |
741 (47.9%) |
13 117 (52.4%) |
|||||||||
|
Females |
1713 (53.0%) |
2 494 566 (50.2%) |
560 |
62 617 |
807 (52.1%) |
11 927 (47.6%) |
|||||||||
|
Region (SA4) |
|
|
|
|
|
|
|||||||||
|
Baulkham Hills and Hawkesbury |
182 (5.6%) |
251 477 (5.1%) |
14 (2.5%) |
2352 (3.8%) |
85 (5.5%) |
1281 (5.1%) |
|||||||||
|
Blacktown |
184 (5.7%) |
377 280 (7.6%) |
29 (5.2%) |
5791 (9.2%) |
91 (5.9%) |
1276 (5.1%) |
|||||||||
|
City and Inner South |
121 (3.7%) |
368 263 (7.4%) |
43 (7.7%) |
3863 (6.2%) |
158 (10.2%) |
2810 (11.2%) |
|||||||||
|
Eastern Suburbs |
197 (6.1%) |
295 054 (5.9%) |
43 (7.7%) |
3352 (5.4%) |
109 (7.0%) |
1673 (6.7%) |
|||||||||
|
Inner South West |
358 (11.1%) |
626 859 (12.6%) |
56 (10%) |
8572 (13.7%) |
149 (9.6%) |
2117 (8.5%) |
|||||||||
|
Inner West |
182 (5.6%) |
324 421 (6.5%) |
36 (6.4%) |
3900 (6.2%) |
119 (7.7%) |
1898 (7.6%) |
|||||||||
|
North Sydney and Hornsby |
316 (9.8%) |
441 358 (8.9%) |
41 (7.3%) |
4635 (7.4%) |
172 (11.1%) |
2784 (11.1%) |
|||||||||
|
Northern Beaches |
215 (6.7%) |
273 499 (5.5%) |
30 (5.4%) |
2900 (4.6%) |
80 (5.2%) |
1126 (4.5%) |
|||||||||
|
Outer South West |
206 (6.4%) |
289 282 (5.8%) |
24 (4.3%) |
4089 (6.5%) |
61 (3.9%) |
957 (3.8%) |
|||||||||
|
Outer West and Blue Mountains |
288 (8.9%) |
327 457 (6.6%) |
76 (14%) |
4259 (6.8%) |
123 (8.0%) |
1949 (7.8%) |
|||||||||
|
Parramatta |
361 (11.2%) |
503 305 (10.1%) |
65 (12%) |
7933 (12.7%) |
129 (8.3%) |
2199 (8.8%) |
|||||||||
|
Ryde |
178 (5.5%) |
204 909 (4.1%) |
21 (3.8%) |
2193 (3.5%) |
76 (4.9%) |
1044 (4.2%) |
|||||||||
|
South West |
320 (9.9%) |
454 801 (9.2%) |
64 (11%) |
6250 (10.0%) |
91 (5.9%) |
1699 (6.8%) |
|||||||||
|
Sutherland |
123 (3.8%) |
230 182 (4.6%) |
18 (3.2%) |
2527 (4.0%) |
105 (6.8%) |
2231 (8.9%) |
|||||||||
|
|
|||||||||||||||
|
ABS = Australian Bureau of Statistics; SA4 = Statistical Area level 4. |
|||||||||||||||
Box 2 – SARS‐CoV‐2 case notifications among residents of the Sydney Greater Capital City Statistical Area, and serosurvey specimen collection, March – June 2020, by date of notification or collection
Box 3 – Geographic distribution of 38 SARS‐CoV‐2‐specific IgG antibody‐positive samples, Sydney, March – June 2020, by Statistical Area level 4
Box 4 – Immune characteristics of SARS‐CoV‐2‐specific IgG antibody‐positive people, by collection group
|
Collection group |
Samples |
IgG‐positive |
IgG titre = 10 |
IgG titre ≥ 160 |
IgA or IgM positive* |
Neutralising antibodies* |
|||||||||
|
|
|||||||||||||||
|
General pathology |
3231 |
19 [0.6%] |
11 (58%) |
3 (16%) |
6 (32%) |
8 (42%) |
|||||||||
|
Antenatal screening |
560 |
7 [1%] |
3 (43%) |
0 |
0 |
5 (71%) |
|||||||||
|
Plasmapheresis donors |
1548 |
12 [0.8%] |
2 (17%) |
1 (8%) |
0 |
11 (92%) |
|||||||||
|
|
|||||||||||||||
|
* Only samples positive for SARS‐CoV‐2‐specific IgG were tested for SARS‐CoV‐2‐specific IgA, IgM, and neutralising antibody. |
|||||||||||||||
Box 5 – Total numbers of specimens and numbers positive for SARS‐CoV‐2‐specific IgG, by collection group, age group, and sex
|
|
General pathology |
Antenatal screening |
Plasmapheresis donors |
||||||||||||
|
Samples |
IgG‐positive |
Samples |
IgG‐positive |
Samples |
IgG‐positive |
||||||||||
|
|
|||||||||||||||
|
Total number |
3231 |
19 (0.6%) |
560 |
7 (1%) |
1548 |
12 (0.8%) |
|||||||||
|
Age group (years) |
|
|
|
|
|
|
|||||||||
|
0– < 10 |
201 |
0 |
— |
— |
— |
— |
|||||||||
|
10– < 20 |
469 |
2 |
— |
— |
— |
— |
|||||||||
|
20– < 30 |
419 |
3 |
224 |
3 |
364 |
8 |
|||||||||
|
30– < 40 |
282 |
0 |
336 |
4 |
389 |
1 |
|||||||||
|
40– < 50 |
357 |
3 |
— |
— |
317 |
3 |
|||||||||
|
50– < 60 |
367 |
2 |
— |
— |
287 |
0 |
|||||||||
|
60– < 70 |
349 |
5 |
— |
— |
191 |
0 |
|||||||||
|
70– < 80 |
350 |
2 |
— |
— |
— |
— |
|||||||||
|
≥ 80 |
437 |
2 |
— |
— |
— |
— |
|||||||||
|
Sex |
|
|
|
|
|
|
|||||||||
|
Males |
1518 |
10 |
— |
— |
741 |
5 |
|||||||||
|
Females |
1713 |
9 |
560 |
7 |
807 |
7 |
|||||||||
|
|
|||||||||||||||
|
|
|||||||||||||||
Box 6 – Estimated seroprevalence (with 95% credible intervals), by age group and collection group, for the base and alternative case prior seroprevalence distributions*
|
Age group |
Collection |
Base case |
Alternative case |
||||||||||||
|
|
|||||||||||||||
|
20–39 years |
General pathology |
0.24% (0.04–0.80%) |
0.12% (0.04–0.53%) |
||||||||||||
|
|
Plasmapheresis donors |
0.69% (0.04–1.59%) |
0.37% (0.04–1.23%) |
||||||||||||
|
|
Antenatal screening |
0.79% (0.04–1.88%) |
0.41% (0.04–1.43%) |
||||||||||||
|
20–69 years |
General pathology |
0.25% (0.04–0.68%) |
0.14% (0.04–0.50%) |
||||||||||||
|
|
Plasmapheresis donors |
0.29% (0.04–0.75%) |
0.15% (0.04–0.57%) |
||||||||||||
|
All ages |
General pathology |
0.15% (0.04–0.41%) |
0.09% (0.04–0.32%) |
||||||||||||
|
|
|||||||||||||||
|
* See online Supporting Information for details. |
|||||||||||||||
Received 29 October 2020, accepted 21 December 2020
- Heather F Gidding1,2,3
- Dorothy A Machalek4
- Alexandra J Hendry1
- Helen E Quinn1,5
- Kaitlyn Vette1
- Frank H Beard1,5
- Hannah S Shilling6
- Rena Hirani7
- Iain B Gosbell7,8
- David O Irving7,9
- Linda Hueston10
- Marnie Downes11
- John B Carlin11,12
- Matthew VN O'Sullivan10,13,14
- Dominic E Dwyer10,13,14
- John M Kaldor4
- Kristine Macartney1,5
- 1 National Centre for Immunisation Research and Surveillance, Children's Hospital at Westmead, Sydney, NSW
- 2 Northern Clinical School, University of Sydney, Sydney, NSW
- 3 Women and Babies Research, Kolling Institute, Sydney, NSW
- 4 The Kirby Institute, University of New South Wales, Sydney, NSW
- 5 The University of Sydney, Sydney, NSW
- 6 Centre for Women’s Infectious Diseases, Royal Women’s Hospital, Melbourne, VIC
- 7 Australian Red Cross Lifeblood, Sydney, NSW
- 8 Western Sydney University, Sydney, NSW
- 9 University of Technology Sydney, Sydney, NSW
- 10 NSW Health Pathology–Institute of Clinical Pathology and Medical Research, Westmead Hospital, Sydney, NSW
- 11 Murdoch Children’s Research Institute, Melbourne, VIC
- 12 The University of Melbourne, Melbourne, VIC
- 13 Centre for Infectious Disease and Microbiology, Westmead Hospital, Sydney, NSW
- 14 Marie Bashir Institute for Infectious Diseases and Biosecurity, University of Sydney, Sydney, NSW
This study was funded by the NSW Ministry of Health. The National Centre for Immunisation Research and Surveillance is supported by the Australian Department of Health, the NSW Ministry of Health, and the Children’s Hospital at Westmead. Heather Gidding and John Kaldor are supported by National Health and Medical Research Council fellowships. Australian governments fund Australian Red Cross Lifeblood to provide blood, blood products and services to the Australian community.
We thank everyone who contributed to this investigation, especially the laboratory staff who collected the specimens and the scientific staff who performed the IFA and neutralisation assays, including Katherine Tudo, Melanie Lograsso and Bassam Al Zahroon (NSW Health Pathology–Institute of Clinical Pathology and Medical Research); Andrew Cullen, Ian Chambers, Annabelle Farnsworth, Karen Wagner and Daniel Clifford (Douglass Hanly Moir Pathology); Agustin Franco, Pratibha James and Michael Mark (4Cyte Pathology); Juliette Holland and Kartik Naidu (Laverty Pathology); Rebecca Burrell, Philip Britton and Alex Micati (Children’s Hospital at Westmead); Elizabeth Knight (Australian Red Cross Lifeblood); and Darren Croese (NSW Health Pathology incident management team). We are grateful to Lucy Armstrong (National Centre for Immunisation Research and Surveillance) for her help with coordinating the study; Heather Whitaker and Nick Andrews (Public Health England) for their statistical advice and sharing their analysis code; James McCaw and Jodie McVernon (Peter Doherty Institute) for their advice on the initial study design; and Michelle Cretikos, Roy Byun, Sheena Adamson and Laura Collie (NSW Ministry of Health) for their helpful advice.
No relevant disclosures.
- 1. World Health Organization. WHO timeline: COVID‐19. Updated 29 June 2020. https://www.who.int/news-room/detail/08-04-2020-who-timeline---covid-19 (viewed Oct 2020).
- 2. Shaban R, Li C, O’Sullivan M, et al. COVID‐19 in Australia: our national response to the first cases of SARS‐CoV‐2 infection during the early biocontainment phase. Intern Med J 2020; https://doi.org/10.1111/imj.15105 [online ahead of print].
- 3. Australian Department of Health. COVID‐19, Australia: epidemiology report 13. Reporting week ending 26 April 2020. May 2020. https://www1.health.gov.au/internet/main/publishing.nsf/Content/novel_coronavirus_2019_ncov_weekly_epidemiology_reports_australia_2020.htm (viewed Oct 2020).
- 4. NSW Ministry of Health. COVID‐19 Weekly surveillance in NSW: epidemiological week 19, ending 9. May, 2020. https://www.health.nsw.gov.au/Infectious/covid-19/Documents/covid-19-surveillance-report-20200512.pdf (viewed Oct 2020).
- 5. Peeling RW, Wedderburn CJ, Garcia PJ, et al. Serology testing in the COVID‐19 pandemic response. Lancet Infect Dis 2020; 20: e245–e249.
- 6. COVID‐19 Immunity Task Force (Public Health Agency of Canada). SeroTracker. https://serotracker.com/Dashboard (viewed Oct 2020).
- 7. Australian Department of Health. Australian National Disease Surveillance Plan for COVID‐19. Updated 30 May 2020. https://www.health.gov.au/resources/publications/australian-national-disease-surveillance-plan-for-covid-19 (viewed Oct 2020).
- 8. NSW Ministry of Health. Enhanced surveillance plan for COVID‐19 in NSW. Updated 22 Nov 2020. https://www.health.nsw.gov.au/Infectious/covid-19/Pages/surveillance-plan.aspx (viewed Nov 2020).
- 9. Australian Bureau of Statistics. Estimated resident population (ERP) and components by SA2 and above (ASGS 2016), 2017 onwards. http://stat.data.abs.gov.au/Index.aspx?DataSetCode=ABS_ERP_COMP_SA (viewed Oct 2020).
- 10. Hueston L, Kok J, Guibone A, et al. The antibody response to SARS‐CoV‐2 infection. Open Forum Infectious Diseases 2020; 7: ofaa387.
- 11. Australian Bureau of Statistics. 3301.0. Births, Australia, 2018. Dec 2019. https://www.abs.gov.au/statistics/people/population/births-australia/2019#data-download (viewed Oct 2020).
- 12. Post N, Eddy D, Huntley C, et al. Antibody response to SARS‐CoV‐2 infection in humans: a systematic review [pre‐print]. 30 Aug 2020. medRxiv 2020; https://doi.org/10.1101/2020.08.25.20178806.
- 13. Brochot E, Demey B, Touzé A, et al. Anti‐spike, anti‐nucleocapsid and neutralizing antibodies in SARS‐CoV‐2 inpatients and asymptomatic carriers. Front Microbiol 2020; 11: 584251.
- 14. Health Information and Quality Authority (Ireland). Evidence summary of the immune response following infection with SARS‐CoV‐2 or other human coronaviruses; version 3. 6 Aug 2020. https://www.hiqa.ie/reports-and-publications/health-technology-assessment/evidence-summary-immunity-response-following (viewed Oct 2020).
- 15. Robbiani DF, Gaebler C, Muecksch F, et al. Convergent antibody responses to SARS‐CoV‐2 in convalescent individuals. Nature 2020; 584: 437–442.
- 16. Hicks SM, Pohl K, Neeman T, et al; SARS‐CoV‐2 Testing in Elective Surgery Collaborators. A dual antigen ELISA allows the assessment of SARS‐CoV‐2 antibody seroprevalence in a low transmission setting. J Infect Dis 2021; 223: 10–14.
- 17. McAnulty JM, Ward K. Suppressing the epidemic in New South Wales. N Engl J Med 2020; 382: e74.
Abstract
Objectives: To estimate SARS‐CoV‐2‐specific antibody seroprevalence after the first epidemic wave of coronavirus disease 2019 (COVID‐19) in Sydney.
Setting, participants: People of any age who had provided blood for testing at selected diagnostic pathology services (general pathology); pregnant women aged 20–39 years who had received routine antenatal screening; and Australian Red Cross Lifeblood plasmapheresis donors aged 20–69 years.
Design: Cross‐sectional study; testing of de‐identified residual blood specimens collected during 20 April – 2 June 2020.
Main outcome measure: Estimated proportions of people seropositive for anti‐SARS‐CoV‐2‐specific IgG, adjusted for test sensitivity and specificity.
Results: Thirty‐eight of 5339 specimens were IgG‐positive (general pathology, 19 of 3231; antenatal screening, 7 of 560; plasmapheresis donors, 12 of 1548); there were no clear patterns by age group, sex, or location of residence. Adjusted estimated seroprevalence among people who had had general pathology blood tests (all ages) was 0.15% (95% credible interval [CrI], 0.04–0.41%), and 0.29% (95% CrI, 0.04–0.75%) for plasmapheresis donors (20–69 years). Among 20–39‐year‐old people, the age group common to all three collection groups, adjusted estimated seroprevalence was 0.24% (95% CrI, 0.04–0.80%) for the general pathology group, 0.79% (95% CrI, 0.04–1.88%) for the antenatal screening group, and 0.69% (95% CrI, 0.04–1.59%) for plasmapheresis donors.
Conclusions: Estimated SARS‐CoV‐2 seroprevalence was below 1%, indicating that community transmission was low during the first COVID‐19 epidemic wave in Sydney. These findings suggest that early control of the spread of COVID‐19 was successful, but efforts to reduce further transmission remain important.