


A key recommendation for controlling the coronavirus disease 2019 (COVID‐19) pandemic is to “test, test, test”.1 If we were able to test everyone using a test that was both 100% sensitive and 100% specific for severe acute respiratory syndrome coronavirus 2 (SARS‐CoV‐2) infection, we would have no false‐positive results (wrong identification of people without the infection) and no false‐negative results (cases of infection are missed). With this perfect test we could identify, isolate and treat all infected individuals away from uninfected individuals. Contact tracing could identify further individuals in the incubation period for quarantine and testing as needed.
However, tests are rarely 100% sensitive and 100% specific, and usually there is a trade‐off between the two.2 Typically, a highly specific test (Sp) has few false positives, so returning a positive (P) result effectively rules in the diagnosis (SpPin), but this is traded off against the greater risk of false negatives. In contrast, a highly sensitive test (Sn) has few false negatives, so returning a negative result (N) effectively rules out the diagnosis (SnNout), but this is traded off against the greater risk of false positives. Although these are useful “rules of thumb”, in order to make clinical decisions we usually need a more defined probability of disease in an individual patient. In this article, we use the clinical example of COVID‐19 to guide the reader through how to apply estimates of diagnostic test accuracy in clinical practice. The process of making a diagnosis can be thought of as an estimation and re‐estimation of the probability of disease in a continuous process. When considered in that way, each item of history and examination as well as laboratory and imaging tests are individual tests in themselves, with the results on each increasing or reducing the probability of disease.
For example, suppose a 26 year‐old man in Sydney presents with a blocked nose, cough and fever in late March 2020. To help you determine whether this could be COVID‐19 rather than something else (eg, other viral respiratory pathogen), you may ask him about contact with anyone with COVID‐19, shortness of breath, recent travel, and where he lives (some areas have higher risk of community transmission). The answers to these and other questions would give you some kind of pre‐test probability for COVID‐19. You would then readjust the disease probability after further questions (eg, loss of smell or taste, duration of symptoms, past medical history), physical examination (if undertaken) and tests results, such as SARS‐CoV‐2 tests, blood tests (eg, full blood count, C‐reactive protein) and chest imaging tests. If we know the test accuracy for each of these steps, then we can continuously recalculate the probability of disease.
Likelihood ratios
The conceptual approach outlined above, updating disease probability for a patient once we have new information from a diagnostic test, can be operationalised by calculating likelihood ratios for the test and using Fagan’s nomogram,3 by estimating post‐test probability (Box 1).4 Likelihood ratios describe the ratio of the probability of a test result in people who truly have the disease to the probability of the same test result in people who truly do not have the disease. In the simplest case of a dichotomous test (positive or negative for SARS‐CoV‐2), we can calculate a positive likelihood ratio to decide on implications of a positive test result for our patient, and a negative likelihood ratio for implications of a negative test result.
Box 2 outlines some relevant formulae for these calculations, and interested readers may enjoy reading more about how the Bayes theorem applies to diagnostic tests.4
When a likelihood ratio is greater than one, the probability of disease after receiving this test result (post‐test probability) is increased from what it was before the test (pre‐test probability). The higher the likelihood ratio, the more powerful the test is at shifting the probability of disease upwards from pre‐ to post‐test, and the better the test is at ruling in disease. Conversely, when the likelihood ratio is less than one, then the probability of disease is decreased from what it was before doing the test. The lower the negative likelihood ratio, the more powerful the test is at shifting the probability of disease downwards from pre‐ to post‐test, and the better the test is at ruling out disease.
Decision thresholds
The decision to request a test for a patient needs to take into consideration not just the accuracy of the test, but also how the test results will help us make clinical decisions. To do this, the first step is to define decision thresholds for different types of management. We use tests to move the probability of disease from one side of these decision thresholds to the other. These thresholds may be set by considering the possible impacts that each course of action may have and by weighing up the benefits and harms of each approach. For example, we may use increasingly higher post‐test probability thresholds of SARS‐CoV‐2 infection to recommend:
- self‐isolation while symptomatic with a respiratory infection;
- strict quarantine for 14 days;
- diagnostic testing in people who have contact with vulnerable members of the community (eg, health care workers, aged care workers);
- diagnostic testing in people who do not have such contact;
- diagnosis of SARS‐CoV‐2 infection with strict isolation, and tracing, quarantining and testing all contacts; and
- diagnosis of COVID‐19 with consideration of treatment and/or of enrolling in a trial of experimental treatment (Box 3).
Pre‐test probability
The next step after setting decision thresholds is to decide on our patient’s pre‐test probability. Often it is not something that we consciously think about, even though we may intuitively use it to make clinical decisions. Although we normally rely on this “clinical intuition” — our best guess of probability of disease from our clinical experience — this may be less useful in the setting of a new disease such as COVID‐19. To explicitly estimate the pre‐test probability of a patient, we may use the prevalence of disease in a similar clinical cohort from the literature or from our local database. We would need to make sure the characteristics of the study cohort used for the prevalence estimate (the denominator of people at risk of infection included in the calculation) match the clinical cohort for our patient. This should include the specific time and place the estimates are based on and, importantly, the testing criteria used.
COVID‐19 diagnostic test accuracy
We now move to finding and applying the evidence on diagnostic test accuracy. After a brief literature search, we identify several test accuracy studies for detecting SARS‐CoV‐2 with reverse transcriptase (RT) polymerase chain reaction (PCR) molecular testing. As we have outlined previously,2 we may use the acronym “RAM” to decide if a diagnostic accuracy study is likely to be valid and applicable in our own setting: representative (covers a similar spectrum of patients), ascertainment (a reference standard is used to verify all test results) and measurement (an accurate reference standard is applied independently and without knowledge of the test result). There is generally a high risk of bias in the currently available diagnostic accuracy studies on COVID‐19 tests6,7 as well as important applicability issues.8 Nevertheless, we find an article that reports on 1014 patients presenting to a hospital in Wuhan, China, who underwent both chest computed tomography (CT) and RT‐PCR tests for the evaluation of possible COVID‐19.9 Using a reference standard that combines all clinical information and all test results available in the article, we calculate sensitivity, specificity, and likelihood ratios for RT‐PCR and chest CT (Box 4) (RT‐PCR estimates for sensitivity are similar to those reported in other studies6,7,10). This retrospective hospital‐based study may overestimate diagnostic accuracy for our intended test use in the community; however, the study appears to have a lower risk of bias than many others published to date.
Post‐test probability
Back to the 26 year‐old man in Sydney presenting with a blocked nose, cough and fever in late March 2020. He tells us that he lives in Bondi, and using available prevalence data, we estimate that his pre‐test probability estimate is around 6%. His pre‐test probability is above the testing threshold of 2% (general population) and so we collect a nasopharyngeal swab and request an RT‐PCR test for SARS‐CoV‐2, and recommend that he self‐isolates at home. Two days later, we receive the RT‐PCR results, which are negative. He has a positive result for another respiratory virus; however, we are aware that co‐infection is possible and that this alone does not rule out COVID‐19.11 Using Fagan’s nomogram and the negative likelihood ratio we calculated, we revise the probability of COVID‐19 downwards to 3%, which is still above the testing threshold (Box 1, blue line). A second negative RT‐PCR result is needed before the probability of disease is sufficiently low to rule out COVID‐19 and stop testing (but he still needs to self‐isolate while symptomatic). In the scenario where his housemate (a close contact) has COVID‐19, more than two negative RT‐PCR results are needed to rule out the disease and a chest CT may be helpful (Box 5, scenarios 1C–1G). The process of test interpretations in this and three other clinical scenarios are presented in Box 5, along with key concepts illustrated.
Conclusion
Tests for COVID‐19, like tests for other diseases, are not perfect and will sometimes miss people who are infected and falsely identify others who are not infected. Despite this, by using likelihood ratios to estimate the post‐test probability of disease, we can make the important clinical decisions needed to provide patient‐centred care while also preventing the spread of COVID‐19.
Box 1 – Fagan’s nomogram for coronavirus disease 2019 (COVID‐19)
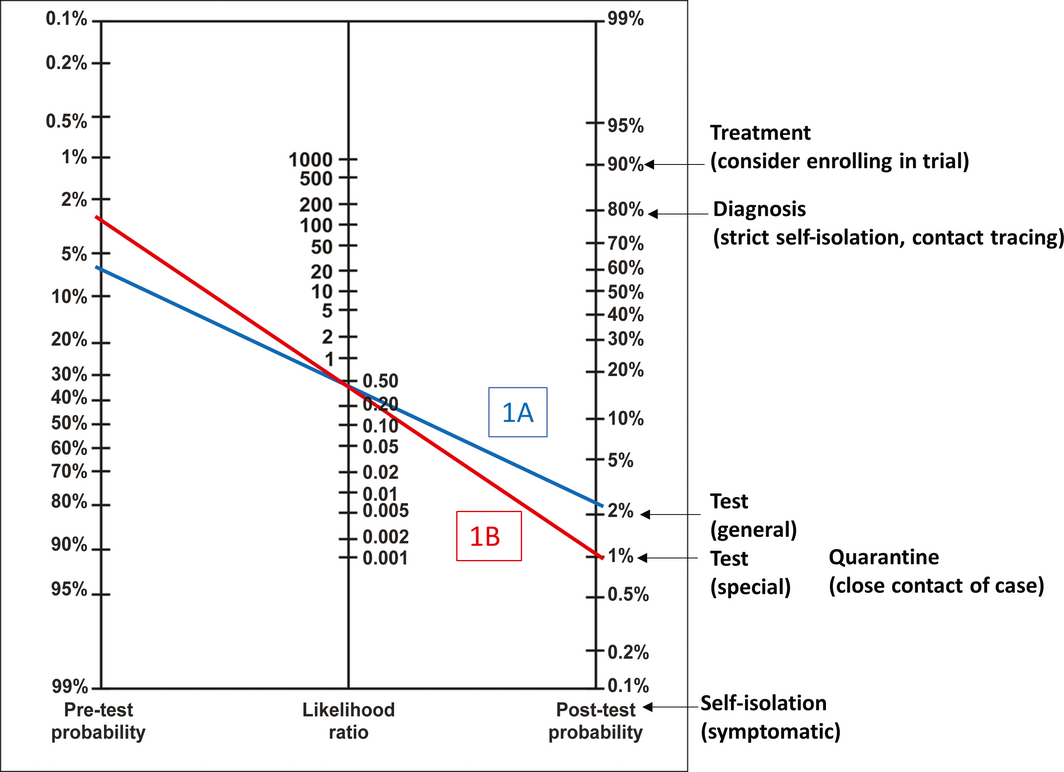
Fagan’s nomogram modified from Jaeschke et al.4 To use the nomogram, draw a straight line from the pre‐test probability for the patient (left‐hand side) through the likelihood ratio for the patient’s test result (middle) to arrive at the estimated post‐test probability of disease (right‐hand side). The figure depicts scenario 1 from Box 5: 26‐year‐old man from Bondi presents with blocked nose, cough and fever; pre‐test probability 6%. Blue line (Box 5, 1A): first RT‐PCR test negative; negative likelihood ratio = 0.41; post‐test probability = 3%. Red line (Box 5, 1B): second RT‐PCR test negative; post‐test probability = 1%.
Box 2 – Likelihood ratio (LR) definitions
|
|
|||||||||||||||
|
• The LR is the probability of a given test result in a patient with the disease, compared with the probability of same result in a patient without the disease5 |
|||||||||||||||
|
• Positive LR = probability of a positive result among people with disease (sensitivity) and probability of a positive result among people without disease (1‐specificity) |
|||||||||||||||
|
• Negative LR = probability of a negative result among people with disease (1‐sensitivity) and probability of a negative result among people without disease (specificity) |
|||||||||||||||
|
• As well as allowing application of diagnostic test accuracy estimates to a patient in the clinic, LRs have other advantages over sensitivity and specificity, including allowing for multicategory results (interval LRs) |
|||||||||||||||
|
|
|||||||||||||||
|
|
|||||||||||||||
Box 3 – Possible decision thresholds* for coronavirus disease 2019 (COVID‐19)1
|
Management |
Individual disease: probability threshold before recommendation |
||||||||||||||
|
|
|||||||||||||||
|
Self‐isolate (while symptomatic) |
≥ 0% |
||||||||||||||
|
Quarantine (14 days) |
> 1% |
||||||||||||||
|
Testing threshold |
|
||||||||||||||
|
Special (health care workers, aged care workers) |
> 1% |
||||||||||||||
|
General (not in contact with vulnerable people) |
> 2% |
||||||||||||||
|
Diagnostic threshold (strict isolation, trace and test all contacts) |
> 80% |
||||||||||||||
|
Treatment threshold (may include enrolment in trial of experimental COVID‐19 treatment) |
> 90% |
||||||||||||||
|
|
|||||||||||||||
|
* These decision thresholds are for illustrative purposes only and are not based on evidence of benefits versus harms; readers may choose to use their own. |
|||||||||||||||
Box 4 – Sensitivity and specificity of reverse transcriptase (RT) polymerase chain reaction (PCR) and chest computed tomography (CT) for coronavirus disease 2019 (COVID‐19) in 1014 patients suspected of having COVID‐19
|
|
COVID‐19‐positive |
COVID‐19‐negative |
Total |
Sensitivity |
Specificity |
Positive |
Negative |
||||||||
|
|
|||||||||||||||
|
RT‐PCR positive (single test) |
500 |
1 |
501 |
|
|
|
|
||||||||
|
RT‐PCR negative (single test) |
350 |
163 |
513 |
|
|
|
|
||||||||
|
Total |
850 |
164 |
1014 |
59% |
99% |
96.47 |
0.41 |
||||||||
|
Chest CT positive |
830 |
58 |
888 |
|
|
|
|
||||||||
|
Chest CT negative |
20 |
106 |
126 |
|
|
|
|
||||||||
|
Total |
850 |
164 |
1014 |
98% |
65% |
2.76 |
0.04 |
||||||||
|
|
|||||||||||||||
|
LR = likelihood ratio. The table was constructed from data presented in Ai et al.9 We assumed that all 580 patients with positive RT‐PCR and positive chest CT, 20/21 patients with positive RT‐PCR and negative chest CT, and 250/308 patients with negative RT‐PCR tests and positive chest CT had COVID‐19. We assumed that the remaining 164 people did not have COVID‐19, including one person with positive initial RT‐PCR and negative chest CT, and negative subsequent RT‐PCR tests and serial chest CTs. Similarly, we assumed that 58/308 people with negative RT‐PCR and positive chest CT, and all 105 people with negative RT‐PCR and negative chest CT did not have COVID‐19. RT‐PCR results for a single test are calculated as follows. In the report by Ai et al,9 individuals had up to three repeat tests after the initial RT‐PCR, and were classified as RT‐PCR‐positive if any of the tests were positive. Among 90 individuals for whom RT‐PCR was ultimately positive (and at least 4 days between repeated tests), 15 individuals were initially RT‐PCR‐negative. We therefore assumed that 17% (15/90) of the 600 RT‐PCR‐positive patients with COVID‐19 would be RT‐PCR‐negative on a single test. This means that of the 850 patients with COVID‐19, 500 would be RT‐PCR‐positive on a single test. |
|||||||||||||||
Box 5 – Hypothetical scenarios of patients in the community setting1
|
Scenario |
Pre‐test probability |
New test result |
Post‐test probability |
Decision threshold |
Management1 |
Key concepts |
|||||||||
|
|
|||||||||||||||
|
1. 26‐year‐old man from Bondi, Sydney, presents in late March 2020 with blocked nose, cough, and fever |
|||||||||||||||
|
1A. Nil |
6% |
RT‐PCR–ve |
3% |
|
Keep testing (go to 1B) |
|
|||||||||
|
1B. First RT‐PCR –ve |
3% |
RT‐PCR–ve |
1% |
|
Stop testing |
|
|||||||||
|
1C. Housemate has been diagnosed with COVID‐19 |
15% |
RT‐PCR–ve |
7% |
|
Keep testing (go to 1D), repeat RT‐PCR |
|
|||||||||
|
1D. Housemate has been diagnosed with COVID‐19; first RT‐PCR –ve |
7% |
RT‐PCR–ve |
3% |
|
Keep testing (go to 1E), move on to CT |
|
|||||||||
|
1E. Housemate has been diagnosed with COVID‐19; two RT‐PCR tests –ve |
3% |
Chest CT–ve |
0% |
|
Stop testing |
|
|||||||||
|
1F. Housemate has been diagnosed with COVID‐19; two RT‐PCR tests –ve |
3% |
Chest CT+ve |
8% |
|
Keep testing (go to 1G), repeat RT‐PCR |
|
|||||||||
|
1G. Housemate has been diagnosed with COVID‐19; two RT‐PCR tests –ve and chest CT +ve |
8% |
RT‐PCR+ve |
89% |
|
Strict isolation, trace and test all contacts |
|
|||||||||
|
2. 42‐year‐old woman in Brisbane, close contact of a confirmed case in late April 2020, with no symptoms |
|||||||||||||||
|
2A. Nil |
1% |
Nil |
1% |
|
Do not test |
|
|||||||||
|
2B. Develops sore throat |
6% |
RT‐PCR–ve |
3% |
|
Keep testing (go to 2C), repeat RT‐PCR |
|
|||||||||
|
2C. Develops sore throat; first RT‐PCR –ve |
3% |
RT‐PCR–ve |
1% |
|
Stop testing |
|
|||||||||
|
2D. Develops sore throat |
6% |
RT‐PCR+ve |
86% |
|
Strict isolation, trace and test all contacts |
|
|||||||||
|
3. 56‐year‐old woman in Melbourne; works as nurse in an aged care facility; has a sore throat and fever in June 2020 |
|||||||||||||||
|
3A. Nil |
2% |
RT‐PCR–ve |
1% |
|
Stop testing |
|
|||||||||
|
3B. Nil |
2% |
RT‐PCR+ve |
66% |
|
Keep testing (go to 3C), repeat RT‐PCR |
|
|||||||||
|
3C. First RT‐PCR +ve |
66% |
RT‐PCR–ve |
45% |
|
Keep testing (go to 3D), repeat RT‐PCR |
|
|||||||||
|
3D. First RT‐PCR +ve, second RT‐PCR –ve |
45% |
RT‐PCR–ve |
25% |
|
Keep testing (go to 3E), move on to CT |
|
|||||||||
|
3E. RT‐PCR results: +ve, –ve, –ve |
25% |
Chest CT–ve |
1% |
|
Stop testing |
|
|||||||||
|
4. 72‐year‐old man in Melbourne, presents in July 2020 with sore throat, fever, myalgia |
|||||||||||||||
|
4A. Nil |
4% |
RT‐PCR–ve |
2% |
|
Stop testing |
|
|||||||||
|
4B. Nil |
4% |
RT‐PCR+ve |
80% |
|
Strict isolation, trace and test all contacts (go to 4C) |
|
|||||||||
|
4C. First RT‐PCR +ve |
80% |
RT‐PCR+ve |
100% |
|
Consider treatment and/or enrolling in trial of experimental treatment |
|
|||||||||
|
|
|||||||||||||||
|
COVID‐19 = coronavirus disease 2019; CT = computed tomography; RT‐PCR = reverse transcriptase polymerase chain reaction; –ve = negative; +ve = positive. The suggested management in these scenarios is for illustrative purposes only and should not be taken as clinical guidance recommendations. |
|||||||||||||||
Provenance: Not commissioned; externally peer reviewed.
- 1. World Health Organization. WHO Director‐General’s opening remarks at the media briefing on COVID‐19— 16 March 2020 [press release]. https://www.who.int/dg/speeches/detail/who-director-general-s-opening-remarks-at-the-media-briefing-on-covid-19–-16-march-2020 (viewed Aug 2020).
- 2. Bell KJ, Macaskill P, Loy C. Test accuracy and potential sources of bias in diagnostic test evaluation. Med J Aust 2020; 212: 10–13. https://www.mja.com.au/journal/2020/212/1/test-accuracy-and-potential-sources-bias-diagnostic-test-evaluation
- 3. Fagan T. Nomogram for Bayes theorem. N Engl J Med 1975; 293: 257.
- 4. Jaeschke R, Guyatt GH, Sackett DL. Users’ guides to the medical literature. III. How to use an article about a diagnostic test. B. What are the results and will they help me in caring for my patients? The Evidence‐Based Medicine Working Group. JAMA 1994; 271: 703–707.
- 5. Deeks JJ, Altman DG. Diagnostic tests 4: likelihood ratios. BMJ 2004; 329: 168–169.
- 6. Watson J, Whiting PF, Brush JE. Interpreting a COVID‐19 test result. BMJ 2020; 369: m1808.
- 7. Arevalo‐Rodriguez I, Buitrago‐Garcia D, Simancas‐Racines D, et al. False‐negative results of initial RT‐PCR assays for COVID‐19: a systematic review [preprint]. medRxiv 2020.04.16.20066787. 13 Aug 2020; 2020, https://doi.org/10.1101/2020.04.16.20066787 (viewed Aug 2020).
- 8. Bossuyt PM. Testing COVID‐19 tests faces methodological challenges. J Clin Epidemiol 2020; 126: 172–176.
- 9. Ai T, Yang Z, Hou H, et al. Correlation of chest CT and RT‐PCR testing for coronavirus disease 2019 (COVID‐19) in China: a report of 1014 cases. Radiology 2020; 296: E32–E40.
- 10. Woloshin S, Patel N, Kesselheim AS. False negative tests for SARS‐CoV‐2 infection — challenges and implications. N Engl J Med 2020; 383: e38.
- 11. Kim D, Quinn J, Pinsky B, et al. Rates of co‐infection between SARS‐CoV‐2 and other respiratory pathogens. JAMA 2020; 323: 2085–2086.
Katy Bell is the recipient of a National Health and Medical Research Council Investigator Grant (No. 1174523). The funding source had no role in the planning, writing, or publication of the work.
No relevant disclosures.