




Medical education
Key research skills
Volume 212 - Issue 1
Test accuracy and potential sources of bias in diagnostic test evaluation
Authors: Katy JL Bell, Petra Macaskill and Clement Loy
Med J Aust 2020; 212 (1): 10-13.e1. || doi: 10.5694/mja2.50449
Published online: 13 January 2020
Published online: 13 January 2020
Understanding how to interpret diagnostic test accuracy studies is a key skill that health practitioners need to develop in order to
undertake evidence- based practice
Understanding how to interpret diagnostic test accuracy studies is a key skill that health practitioners need to develop in order to undertake evidence‐based practice.1 In this article we guide the reader through how to interpret a diagnostic test accuracy study, including the potential for bias. In subsequent articles we will discuss how diagnostic tests may be applied in clinical practice and consider key concepts in population screening and overdiagnosis.
Sensitivity and specificity
Suppose we are interested in a new test that measures the width of blood vessel bulge for the diagnosis of aneurysms in the cerebral circulation. A reference standard is the best available method of assessing whether or not the disease is present2 (a gold standard is an error‐free reference standard).3 The reference standard for aneurysms is digital subtraction angiography (DSA), an invasive procedure that involves arterial catheterisation and dye. Time‐of‐flight magnetic resonance angiography (MRA) is non‐invasive but may not be as accurate. We found a study that compared MRA to DSA results in 31 people with clinical suspicion of cerebral aneurysm.4 How can we use these data to determine the diagnostic accuracy of MRA? Box 1 presents a two‐by‐two classification table from data in the study. Sensitivity is the proportion of people with the disease (DSA positive) who test positive (MRA positive; 21/23, 91% in this example). Specificity, on the other hand, is the proportion of people without the disease (DSA negative) who test negative (MRA negative; 6/8, 75% in this example).
Typically, tests with higher sensitivity have lower specificity and vice versa, so the main purpose of applying the test must be considered when deciding on choice of test.5 A highly specific test (Sp) returning a positive result (P) effectively rules in the diagnosis (SpPin); for example, meningococcal rash in meningococcal meningitis. Conversely, a highly sensitive test (Sn) returning a negative result (N) effectively rules out the diagnosis (SnNout); for example, repeated highly sensitive cardiac troponin assays for myocardial infarction.
Positive and negative predictive values
Predictive values are regarded by many as more useful for patient care than sensitivity and specificity, because you can directly estimate the probability of your patient having a disease based on their test results. The positive predictive value is the proportion of people who test positive who actually have disease. This is also called post‐test probability of a positive test result, and is 91% in the study under discussion (Box 1).4 The negative predictive value is the proportion of people who test negative who do not have disease (75% in the study; Box 1). Although these happen to be the same values as calculated for sensitivity and specificity respectively in this study, this is not usually the case.
People in the study were selected to undergo imaging because they had a clinical picture that was suspicious of an aneurysm or a subarachnoid haemorrhage. Thus, the prevalence of cerebral aneurysm was high at 74% (23/31). In a lower risk screening population of 100 000 people, we would expect the prevalence of disease to be much lower, around 2%.6 If we assume that the sensitivity and specificity of MRA are the same in this low risk population as those that we calculated from the clinical population, then the positive predictive value of MRA is only 6.9% (1826/26 326), while the negative predictive value is 99.8% (73 500/73 674) (Box 1).
You can see from these examples that as the prevalence of the disease decreases, the negative predictive value increases and the positive predictive value decreases. So, although predictive values may be easier to apply in clinical practice, we must be sure that we are using results from a study population with a very similar prevalence of disease to that of the population being tested. Despite appearing to be independent of disease prevalence according to how they are computed, sensitivity and specificity are also likely to vary with the underlying prevalence of disease. This is because prevalence is often a proxy for other factors such as disease severity, clinical setting, and place of the test in the diagnostic pathway. For this and a number of other reasons, these measures of test accuracy often differ between populations with differing underlying prevalence of the disease.7
Diagnostic test thresholds and receiver operating characteristic curves
In the diagnostic accuracy study of MRA versus DSA for cerebral aneurysms,4 the MRA results were actually reported as the width of blood vessel bulges, but we dichotomised the MRA results as positive for ≥ 3 mm and negative for < 3 mm for illustrative purposes. Box 2 shows the MRA results for the 31 patients on the original quantitative scale (Supporting Information). If the diagnostic threshold for aneurysm is set at ≥ 4 mm, then a smaller proportion of people with disease would be correctly classified MRA positive (sensitivity, 74% [17/23]). However, a larger proportion of people without disease would then be correctly classified as MRA negative (specificity, 87.5% [7/8]).
Box 2 also shows the sensitivity (1 − specificity) pairs across all possible thresholds. By plotting and joining these points, we create a receiver operating characteristic (ROC) curve. The choice of threshold for clinical use will depend on the purpose of the test. Using the SpPin SnNout mnemonic defined earlier, when we are primarily interested in ruling in the disease, we maximise specificity at the expense of sensitivity (SpPin) and set diagnosis to a more stringent (usually higher) threshold. Where we are primarily interested in ruling out the disease, we maximise sensitivity at the expense of specificity (SnNout) and set diagnosis to a less stringent (usually lower) threshold. It is worthwhile noting that threshold setting can also be implicit or even unconscious; for instance, radiologists’ interpretations of imaging as abnormal.2
The area under the curve (AUC; equivalent to the C statistic) gives a measure of the test's ability to discriminate patients with and without disease.8 The ROC curve for a perfect test follows the vertical axis to the left and horizontal axis at the top (AUC, 1), while that for an uninformative test is a diagonal 45° line (AUC, 0.5) (Box 2, B). The tangent at a particular point on the ROC curve is the same as the likelihood ratio for that test value,9 and we will consider likelihood ratios in our next article.
Although we have focused on single diagnostic test accuracy studies so far, ideally we should seek out systematic reviews of the test we are interested in, so that we have estimates of test accuracy based on the totality of the evidence. Specific statistical methods have been developed for meta‐analysis of diagnostic test accuracy studies to pool estimates of sensitivity and specificity across studies while allowing for the effects of differing thresholds.10,11
Potential sources of bias and applicability of estimates in diagnostic test evaluation studies
Key validity issues in diagnostic studies are considered in Box 3 and include representativeness (spectrum of patients), ascertainment (lack of reference standard ascertainment leading to verification bias), and measurement issues relating to the reference standard (lack of independence/blinding and imperfect reference standard). A suggested acronym to help you remember these key issues is RAM (representativeness, ascertainment and measurement).12
When the spectrum of disease in the study population does not represent the intended population where the test will be used, test accuracy estimates may not be applicable. An extreme example of this is the bias resulting from poorly designed case–control studies, which tend to overestimate test accuracy.13,14 Spectrum of disease issues can be minimised by enrolling consecutive patients who are representative of the clinical population where the test will be used. Ascertainment issues occur when the test result influences the probability of being verified using the reference standard (partial verification bias) or the type of reference standard used (differential verification). Measurement issues relating to the reference standard are a further important source of bias and include lack of blinding when interpreting the test or reference standard, lack of independence of the test and reference standard, post hoc selection of the test threshold based on results from the study, and use of a reference standard that imperfectly measures whether or not the condition is present.
The Standards for Reporting Diagnostic Accuracy 2015 checklist of essential items for reporting diagnostic accuracy studies incorporates updated evidence about sources of bias and variability in diagnostic accuracy.3 Most journals now require that authors of diagnostic accuracy studies submit a completed checklist along with their manuscript. Although the checklist is primarily aimed at improving the completeness and transparency of reporting on a diagnostic study, it may also be used to help researchers in the design of their study in order to minimise bias and maximise applicability.
Conclusion
Sensitivity, specificity, positive predictive value and negative predictive value are all commonly used measures of test accuracy. As these measures tend to vary across settings with differing prevalence of the target condition, care should be taken to ensure the study population broadly represents the clinical population where the test will be used. In our next article, we will review methods for assessing test accuracy that facilitate clinical decision making at the individual level (likelihood ratios and pre‐ and post‐test probabilities).
Box 1 – Diagnostic accuracy of magnetic resonance angiography (MRA) for detection of cerebral aneurysm in people with clinical suspicion of aneurysm and in a screening population of asymptomatic adults aged ≥ 30 years
Cinical suspicion of aneurysm |
Screening population | ||||||||||||||
DSA positive |
DSA negative |
Total |
DSA positive |
DSA negative |
Total | ||||||||||
MRA positive |
21 |
2 |
23 |
1826 |
24 500 |
26 326 |
|||||||||
MRA negative |
2 |
6 |
8 |
174 |
73 500 |
73 674 |
|||||||||
Total |
23 |
8 |
31 |
2000 |
98 000 |
100 000 |
|||||||||
DSA = digital subtraction angiography | |||||||||||||||
Box 2 – Magnetic resonance angiography (MRA) results in 31 patients with clinical suspicion of cerebral aneursysm: scatterplot (A) and receiver operating characteristic curve (B)*
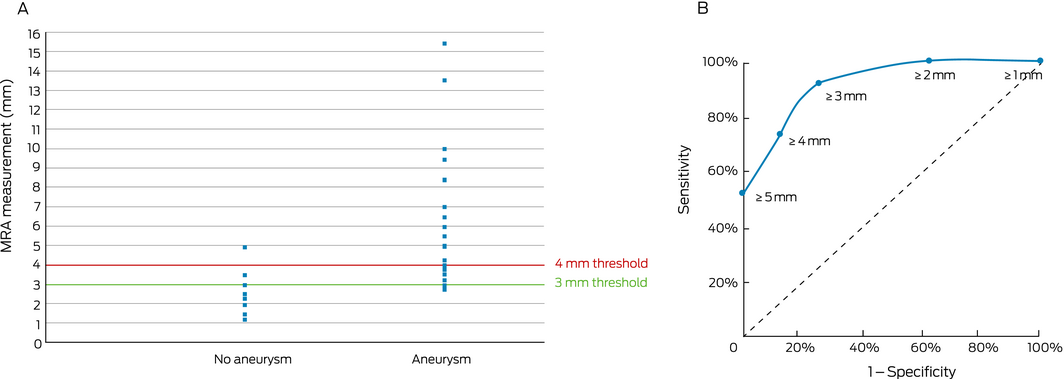
*Based on data from Mallouhi et al.4 Presence of aneurysm defined by results on digital subtraction angiography. Dashed line represents uninformative test (area under the curve, 0.5). Receiver operating characteristic curve for perfect test follows the vertical axis to the left and horizontal axis at the top (area under the curve, 1).
Box 3 – Sources of bias in diagnostic accuracy studies
Bias/applicability issue |
Definition |
Example |
Consequence | ||||||||||||
Representativeness |
|||||||||||||||
Spectrum of disease |
When the spectrum of disease in the study population differs from the population where the test will be used, because subjects are selected for the study on the basis of specific demographic features, disease severity, results of prior testing, or where patients with indeterminate disease are excluded from the study |
Case–control study that uses cases with severe disease and controls who are healthy volunteers |
|||||||||||||
Ascertainment |
|||||||||||||||
Verification bias |
Not all patients are verified with the reference standard |
||||||||||||||
Partial verification bias |
The test result influences the probability of being verified, and those who are not verified are omitted from analysis |
People with a positive cancer screening test result are more likely to be verified with histopathology than people with a negative cancer screening test result |
May overestimate test sensitivity and underestimate specificity13,14 |
||||||||||||
Differential verification bias |
The test result influences the choice of reference standard |
People with a positive cancer screening test result are more likely to be verified with histopathology, while people with a negative cancer screening test result are more likely to be verified with clinical follow‐up |
|||||||||||||
Measurement |
|||||||||||||||
Lack of blinding |
Interpretation of the test is unblinded to the reference standard (test review bias) or vice versa (diagnostic review bias) |
Person interpreting the test is aware of the results of the reference standard or vice versa |
May overestimate test sensitivity and overall test accuracy13,14 |
||||||||||||
Lack of independence |
The errors between the test and reference standard are not independent |
Short screening questionnaire that is actually part of the reference standard |
May overestimate test accuracy15 |
||||||||||||
Data‐driven threshold selection |
Threshold is not pre‐specified, and results from the study are used to set the test threshold |
The diagnostic threshold is selected based on that which gives optimum specificity and sensitivity in the study, rather than using a pre‐specified threshold |
May overestimate test accuracy15 |
||||||||||||
Imperfect reference standard |
Measurement error in the reference standard (both systematic and random) causes the observed result to differ from the “truth” |
Histopathology of borderline cancerous lesions |
May overestimate or underestimate diagnostic accuracy (depending on the prevalence, the true test accuracy, and the correlation in test errors between the test and reference standard)15 |
||||||||||||
Competing interests
No relevant disclosures.
Acknowledgements
Katy Bell receives funding from the National Health and Medical Research Council of Australia via a Centre of Research Excellence grant (1104136) and a project grant (1163054).
References
- Albarqouni L, Hoffmann T, Straus S, et al. Core competencies in evidence‐based practice for health professionals: consensus statement based on a systematic review and delphi survey. JAMA Netw Open 2018; 1: e180281.
- Irwig L, Tosteson ANA, Gatsonis C, et al. Guidelines for meta‐analyses evaluating diagnostic tests. Ann Intern Med 1994; 120: 667–676.
- Bossuyt PM, Reitsma JB, Bruns DE, et al. STARD 2015: an updated list of essential items for reporting diagnostic accuracy studies. BMJ 2015; 351: h5527.
- Mallouhi A, Felber S, Chemelli A, et al. Detection and characterization of intracranial aneurysms with MR angiography: comparison of volume‐rendering and maximum‐intensity‐projection algorithms. AJR Am J Roentgenol 2003; 180: 55–64.
- Bossuyt PM, Irwig L, Craig J, Glasziou P. Comparative accuracy: assessing new tests against existing diagnostic pathways. BMJ 2006; 332: 1089–1092.
- Miller TD, White PM, Davenport RJ, et al. Screening patients with a family history of subarachnoid haemorrhage for intracranial aneurysms: screening uptake, patient characteristics and outcome. J Neurol Neurosurg Psychiatry Res 2012; 83: 86.
- Leeflang MM, Bossuyt PM, Irwig L. Diagnostic test accuracy may vary with prevalence: implications for evidence‐based diagnosis. J Clin Epidemiol 2009; 62: 5–12.
- Choi BC. Slopes of a receiver operating characteristic curve and likelihood ratios for a diagnostic test. Am J Epidemiol 1998; 148: 1127–1132.
- Hanley JA, McNeil BJ. The meaning and use of the area under a receiver operating characteristic (ROC) curve. Radiology 1982; 143: 29–36.
- Macaskill P, Gatsonis C, Deeks JJ, Harbord RM, Y. T. Chapter 10: Analysing and presenting results. In: Deeks JJ, Bossuyt PM, Gatsonis C, editors. Handbook for systematic reviews of diagnostic test accuracy, version 10. The Cochrane Collaboration, 2010. https://methods.cochrane.org/sites/methods.cochrane.org.sdt/files/public/uploads/Chapter%2010%20-%20Version%201.0.pdf (viewed Nov 2019).
- Bossuyt P, Davenport C, Deeks J, et al. Chapter 11: Interpreting results and drawing conclusions. In: Deeks JJ, Bossuyt PM, Gatsonis C, editors. Handbook for systematic reviews of diagnostic test accuracy, version 9 The Cochrane Collaboration, 2013. https://methods.cochrane.org/sites/methods.cochrane.org.sdt/files/public/uploads/DTA%20Handbook%20Chapter%2011%20201312.pdf (viewed Nov 2019).
- Straus SE, Glasziou P, Richardson WS, Haynes RB. Evidence‐based medicine: how to practice and teach EBM. Amsterdam: Elselvier, 2019.
- Leeflang MM, Deeks JJ, Gatsonis C, Bossuyt PM. Systematic reviews of diagnostic test accuracy. Ann Intern Med 2008; 149: 889–897.
- Whiting PF, Rutjes AW, Westwood ME, Mallett S. A systematic review classifies sources of bias and variation in diagnostic test accuracy studies. J Clin Epidemiol 2013; 66: 1093–1104.
- Walter SD, Macaskill P, Lord SJ, Irwig L. Effect of dependent errors in the assessment of diagnostic or screening test accuracy when the reference standard is imperfect. Stat Med 2012; 31: 1129–1138.
Provenance: Commissioned; externally peer reviewed.
Interpreting Australian Stillbirth Rate Trends: Implications for Surveillance and Continuous Quality Improvement
Aleena M. Wojcieszek, Kirstine Sketcher-Baker, Christine Andrews, Michael Coory, Imogen Kettle, Melissa Malivoire, David Ellwood, Vicki Flenady
Paracetamol in Pregnancy: Uncertain Evidence, Certain Consequences
David J. Tunnicliffe, Miranda Cumpston, Debra Kennedy, Margie Danchin, Armando Teixeira-Pinto
Fatty Liver Disease in Australia: A Narrative Review on the Epidemiology, Natural History, Prognostication and Management in People With Metabolic Dysfunction
Karl Vaz, Daniel Clayton-Chubb, William W. Kemp, Stuart K. Roberts, Ammar Majeed
Birth prevalence, clinical sequelae, and management of congenital cytomegalovirus infections in Australia, 1999–2023: a national prospective study
Ece Egilmezer, Suzy M Teutsch, Carlos Nunez, Stuart T Hamilton, Adam W Bartlett, Pamela Palasanthiran, Elizabeth J Elliott, William D Rawlinson
The number of cancer‐related deaths that could be attributable to spatial disparities in survival in Australia, 2010–2019: a retrospective population‐based cohort study
Charlotte K Bainomugisa, Jessica Cameron, Paramita Dasgupta, Peter Baade
Mandatory research projects during medical specialist training in Australia and New Zealand
Paulina Stehlik, Caitlin Brandenburg, David A Henry