


Stage 3 lockdown measures in Victoria reduced COVID‐19 transmission, but more was required to control the epidemic
Australia, like many other countries, had an initial rise in coronavirus disease 2019 (COVID‐19) cases in March and April 2020; however, this was followed by a relatively sharp decline in May 2020 after federal and state governments introduced strict community controls. These included mandatory quarantine periods for people returning from overseas, and physical distancing policies, such as closing pubs, bars, entertainment venues, churches and places of worship, restricting restaurants and cafes to take‐away only, and limiting public gatherings to two people.
Two months after the initial control measures were introduced, available epidemic data indicated that they successfully disrupted COVID‐19 transmission.1 The control measures were relaxed during June 2020 to reduce their social and economic disruption. This relaxation was accompanied by further public health measures to mitigate the risk of a resurgence of infection, including the introduction of the COVIDSafe smartphone application and a scale‐up of testing capacity and contact tracing.
At the time of this analysis (30 July), new cases of COVID‐19 remained low in most jurisdictions, with the exception of Victoria, where the case numbers rose again in late June and early July.2 The resurgence of COVID‐19 in Victoria led to multiple control measures being reintroduced in urban Melbourne. These included:
- implementation of Stage 3 restrictions (closure of pubs, bars, entertainment venues, churches and places of worship, restricting restaurants and cafes to take‐away only, and limiting public gatherings to two people) in ten postcodes at 11:59 pm on 1 July 2020;
- expansion of Stage 3 restrictions to 12 postcodes and complete quarantine and isolation being imposed in several high‐rise public housing estates in the inner north on 3 July; and
- extension of Stage 3 restrictions to the whole of metropolitan Melbourne and Mitchell Shire on 8 July.
The resurgence also led to the closing of borders between Victoria and other states and jurisdictions to try to contain the infection. Despite these restrictions, the daily cases continued to climb following the expansion of Stage 3 restrictions, leading to the introduction of the compulsory use of masks in public settings on 22 July.
The ongoing high number of daily cases in Victoria led to concern in the community and the media about whether the Stage 3 measures before the mandatory use of mask had prevented COVID‐19 transmission. In this article, we examine the effectiveness of these measures compared with the projected pre‐intervention growth.
We used the daily diagnosed COVID‐19 cases in Victoria (excluding cases in travellers in quarantine) as reported by the Victorian Department of Health and Human Services3 to estimate infection growth rates before and after the introduction of the Stage 3 measures in ten postcodes in Melbourne on 1 July 2020. We expected a time lag between the intervention being introduced and detecting its effect due to both the generation interval for the infection (estimated as 4 days)4 and delays in testing and reporting (estimated as 3 days). Hence, we regarded 14 June to 7 July inclusive as the pre‐intervention period. We assumed that the initial growth rates would have continued, unchanged by the Stage 3 restrictions, until the cases reported on 7 July 2020. We then measured the impact of the Stage 3 restrictions from 10 July, allowing a 2‐day transition between pre‐ and post‐intervention. We assumed that the introduction of compulsory masks in Melbourne at midnight on 22 July would not have affected the daily cases over the subsequent 7 days to 30 July. Thus, the post‐intervention period was 10–30 July 2020.
For exponential growth, the logarithm of the daily cases should increase linearly with time. Therefore, to determine the growth rates of the epidemic, we performed non‐weighted linear regressions of the natural log of the daily cases versus days since 14 June 2020 for the pre‐ and post‐intervention periods separately to determine the growth constants as the slopes of the regression lines. The effective reproduction number (Reff) was calculated from the growth constants as the factor increase over one generation interval, assuming an average 4‐day generation interval with a normal distribution4 (ie, Reff = exp (4 × k), for the growth constant k).
Both the pre‐ and post‐intervention data closely fit an exponential model (Box). The regression of the log daily cases with time gave an excellent fit to the linear model, with no deviation of the residuals from a normal distribution. The linearity of the exponential growth was assessed by fitting a second‐order polynomial model to the log‐transformed data. There was no evidence of any curvature in either the pre‐ or post‐intervention regressions (P = 0.60 and 0.74, for the difference of the second‐order coefficient to zero for pre‐ and post‐intervention data respectively).
The pre‐ and post‐intervention growth constants were 0.140 per day (standard error, 0.008) and 0.0379 per day (standard error, 0.009) respectively. The latter was significantly greater than zero (P < 0.001). Thus, the epidemic growth continued during the post‐intervention period but was significantly lower than in the pre‐intervention period (P < 0.001; t test). These growth rates correspond to effective pre‐ and post‐intervention Reff 1.75 and 1.16 respectively.
The model projected 27 000 cases (95% CI, 17 000–45 000) would occur from 1 to 30 July if the growth rate had continued unchanged (Reff 1.75), as opposed to the 8314 cases diagnosed in Victoria during this period.
Our results show that the control measures introduced by the Victorian Government in early July were highly effective in reducing the resurgence in COVID‐19 transmission, leading to a reduction in Reff from an estimated 1.75 to 1.16. Despite this reduction, Victoria was still experiencing a slow but significant ongoing post‐intervention growth in cases. To achieve a genuine “flattening of the curve” (Reff < 1), a further 14% reduction in Reff was needed.
Victoria faced a huge challenge to reduce transmissions to the level needed to get the COVID‐19 epidemic under control. There was hope that the introduction of compulsory face coverings would be sufficient to achieve the estimated 14% additional reduction in Reff required. A recent systematic review and meta‐analysis5 suggested that masks could reduce COVID‐19 transmission by 85%, although the real‐world impact was expected to be less, as most evidence comes from the use of surgical masks in health care settings rather than face coverings or masks in community settings. At the same time, there was recognition that even stricter restrictions may be required to reduce the Reff and new infections.
A significant challenge for Victoria was community fatigue and reduced adherence to this second round of government control measures compared with the first.6,7 To date, most of the initial measures to control COVID‐19 — restrictions on personal, business and community activities, mass media campaigns, and translated resources in selected minority languages — have been top‐down control responses. While successful in the short term, this approach is unlikely to be sustainable for the length of the epidemic; community cooperation is essential. To gain sustainable community cooperation, rapid research and community engagement approaches are needed to identify and address specific needs and information gaps, and to empower civil society groups to lead in selected elements of the response.
A limitation of this analysis was the use of a single post‐intervention period, even though the geographical area of restrictions expanded on three occasions. Given that about 7 days are required to observe the impact of an intervention, and that there were only a few days between the various geographical expansion of restrictions, we considered a single period to be the most appropriate way to measure the intervention effect. We did not observe an impact of the further expansion of the restrictions, but this may be due to a high proportion of cases continuing to arise from the original ten suburbs even after the restrictions were expanded. The inherent variability in the daily case numbers may hide the effect of an intervention over short periods. Similarly, measuring the total number of cases, as opposed to the number of new community transmissions, potentially underestimates the effect of interventions in the short term because these data do not account for clusters of infection.
In conclusion, the control measures introduced in Victoria from 1 July reduced the transmission of COVID‐19, averting 9000–37 000 infections between 2 and 30 July. Importantly, there remained small but significant ongoing growth. Subsequent to the analysis in this report, further controls, including compulsory masks, were imposed, Stage 3 lockdown was extended to regional Victoria, and Stage 4 lockdown commenced in metropolitan Melbourne. The sustained decline in daily COVID‐19 case numbers to zero by 1 November8 suggests that these control measures were successful in controlling the epidemic.
Box – Victorian coronavirus disease 2019 (COVID‐19) daily cases
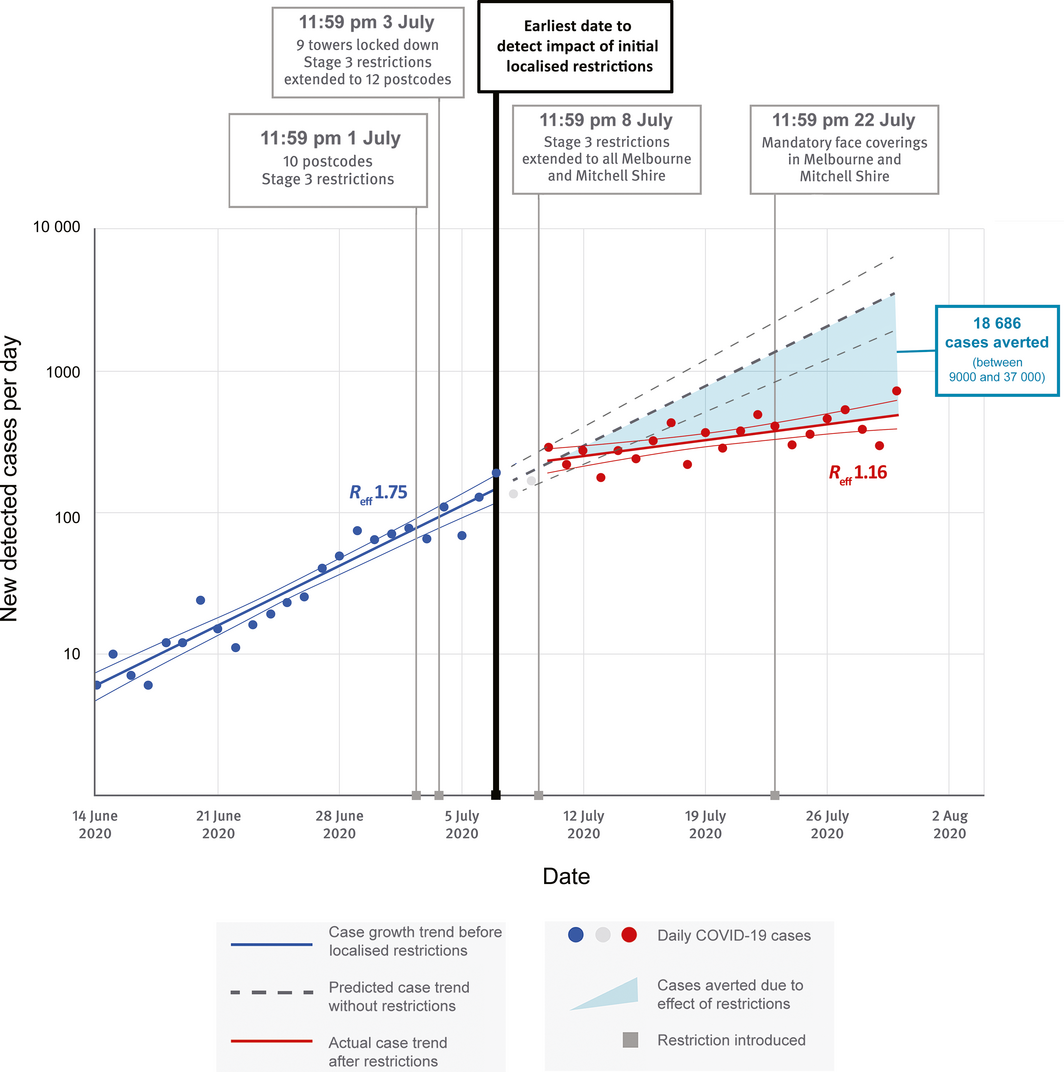
Dots = observed daily cases. Solid thick lines = fitted exponential growth curves; thinner lines = upper and lower 95% confidence intervals (CIs) on the fitted growth curves. Dashed lines = projected exponential increase in daily cases, with upper and lower 95% CIs assuming no intervention. Blue = pre-intervention period (14 June – 7 July); red = post-intervention period (10–30 July); grey = transition period. The vertical black line marks the time when the initial ten-postcode Stage 3 restrictions could begin to influence daily cases.
Provenance: Not commissioned; externally peer reviewed.
- 1. Australian Government, Department of Health. Coronavirus (COVID‐19) current situation and case numbers [website]; 16 May 2020. https://www.health.gov.au/news/health-alerts/novel-coronavirus-2019-ncov-health-alert/coronavirus-covid-19-current-situation-and-case-numbers#total-cases-recoveries-and-deaths (viewed May 2020).
- 2. Australian Government. 3‐Step Framework for a COVIDSafe Australia [website]; 26 June 2020. https://www.health.gov.au/resources/publications/3-step-framework-for-a-covidsafe-australia (viewed Aug 2020).
- 3. Department of Health and Human Services. Coronavirus update for Victoria [media release]; 14 June to 30 July 2020. https://www.dhhs.vic.gov.au/coronavirus/updates (viewed July 2020).
- 4. Du Z, Xu X, Wu Y, et al. Serial interval of COVID‐19 among publicly reported confirmed cases. Emerg Infect Dis 2020; 26: 1341–1343.
- 5. Chu DK, Akl EA, Duda S, et al. Physical distancing, face masks, and eye protection to prevent person‐to-person transmission of SARS‐CoV-2 and COVID‐19: a systematic review and meta‐analysis. Lancet 2020; 395: 1973–1987.
- 6. Teasdale E, Santer M, Geraghty A, et al. Public perceptions of non‐pharmaceutical interventions for reducing transmission of respiratory infection: systematic review and synthesis of qualitative studies. BMC Public Health 2014; 14: 589.
- 7. Fischer C, Lee JY, McGuiness K, Park S. Coronavirus “news fatigue” starts to bite for Australians in lockdown. The Conversation 2020; 6 May. https://theconversation.com/coronavirus-news-fatigue-starts-to-bite-for-australians-in-lockdown-137780 (viewed Aug 2020).
- 8. Victorian Government, Department of Health and Human Services. Victorian coronavirus (COVID‐19) data [website]; 4 November 2020. https://www.dhhs.vic.gov.au/victorian-coronavirus-covid-19-data (viewed Nov 2020).
We thank Amanda Rotberg for the development of the figure, and Campbell Aitken for his help editing the manuscript.
No relevant disclosures.