


Social restrictions of various degrees have been implemented in many countries to reduce viral transmission during the coronavirus disease 2019 (COVID‐19) pandemic. Analysis of responses in the United States during the 1918–1919 influenza pandemic indicated that early imposition of local social restrictions reduced the number of deaths.1 But restrictions on personal mobility have economic consequences. Comparing data on the numbers of confirmed COVID‐19 infections with mobility data for Australia, Sweden, and South Korea, countries with distinctly different approaches to mobility restrictions, may provide insights into the efficacy of such interventions.
To assess changes in residential and workplace mobility, we analysed Google COVID‐19 community mobility data (https://www.google.com/covid19/mobility; data status, 23 July 2020; online Supporting Information).2 We expressed mobility changes as proportional deviations from levels for the baseline period, 3 January – 6 February 2020. Residential mobility data refer to time spent at home; workplace mobility data refer to the total number of visitors to places of work. We applied automated change point detection, using a time series forecasting model,2 to ascertain inflection points in the residential mobility curve in order to determine the effective lockdown date; that is, the time point from which people stayed home.
The Johns Hopkins University COVID‐19 dataset3 was transformed to track the number of confirmed infections in the three countries and to calculate the doubling times. We defined growth rate on day t as:
As 97.5% of COVID‐19 patients develop symptoms within 11 days of viral exposure,4 we accounted for incubation lag and testing delays by applying an interrupted time series analysis at 14 days after the effective lockdown date to determine the delayed effect on doubling time. Analyses were conducted in Stata 15.1. The Google and Johns Hopkins University datasets provide publicly available de‐identified data. Consistent with the Australian National Statement on Ethical Conduct in Human Research 2007 (updated 2018),5 we deemed this study exempt from formal ethics review.
The effective lockdown date +14 days was reached in Australia on day 23, Sweden on day 19, and in South Korea on day 14 after the recording of the first 50 confirmed cases (Box 1). Interrupted time series analysis indicated that this date (effective lockdown date +14 days) was associated with significant increases in doubling time in all three countries; that is, slowing of growth in the number of new confirmed infections 14 days after the effective lockdown date (Box 2; online Supporting Information).
Three distinct patterns of societal reaction to social restrictions, causing different degrees of economic shutdown, can be differentiated: near complete lockdown (Australia), relaxed lockdown with preserved workplace activity (Sweden), and minimal lockdown with preservation of both workplace and commercial activity (South Korea). The mobility data curves for Australia exhibited large converse changes in the residential (20% of baseline) and workplace mobility curves (50% of baseline), suggesting that people did not go to their workplaces but simply stayed home. In Sweden, the change in workplace mobility was smaller (20–40%), suggesting relative preservation of workplace activity despite reduced residential mobility. For South Korea, the changes in residential and workplace mobility were both small (about 10%), with a progressive loss of symmetry over time, suggesting that people engaged in other activity (eg, recreational or commercial) that did not affect the infection doubling time (Box 1).
Our study is limited by biases inherent in the datasets analysed. Firstly, the baseline period for Sweden included several weeks of the Christmas holidays (ending in early January), but the baseline periods for South Korea and Australia included fewer weeks of holiday, so that baseline mobility was lower for Sweden than for the other two countries. This may have contributed to smaller excursions from baseline during restrictions in Sweden. Secondly, the changes in residential and workplace mobility data cannot be directly compared, as they reflect changes in different parameters.
Early social restrictions reduced the spread of COVID‐19 in all three countries, as indicated by increased infection doubling times within 14 days of measurable changes in public mobility. Mobility data may help to inform public policy that achieves a balance between the economic and social effects of mobility restrictions and controlling the spread of COVID‐19.
Box 1 – Changes in mobility (relative to baseline mobility): A. Residential mobility; B. Workplace mobility*
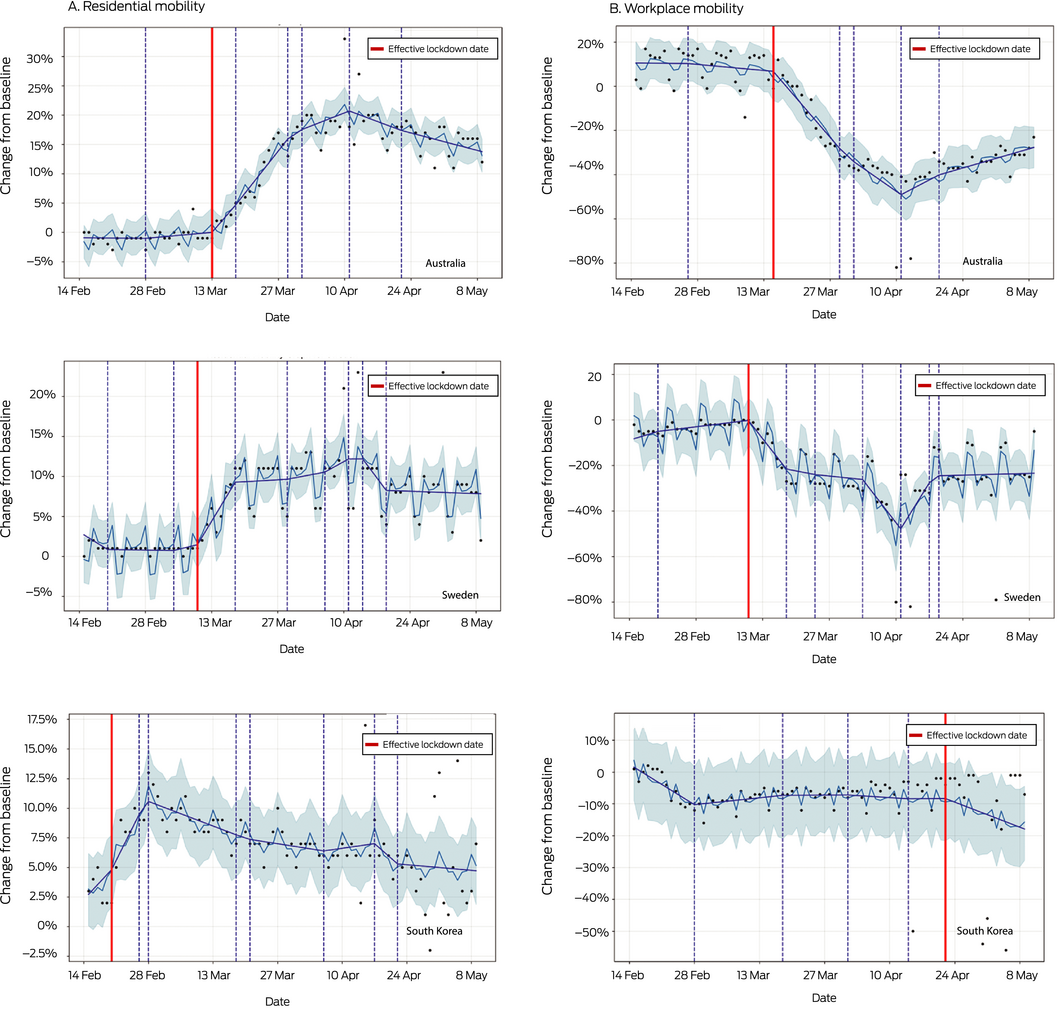
* Source: Google COVID‐19 community mobility data (https://www.google.com/covid19/mobility). The dark blue lines depict mobility curves based on inflection points identified by automated change point detection using time series analysis;2 the light blue lines depict the mean lines for the mobility data estimator used for predicting inflection points; the shaded regions indicate uncertainty in the mobility data estimator (two standard deviations around mean line); the dashed vertical lines indicate inflection points of statistical significance.
Box 2 – Doubling time in numbers of confirmed COVID‐19 infections*
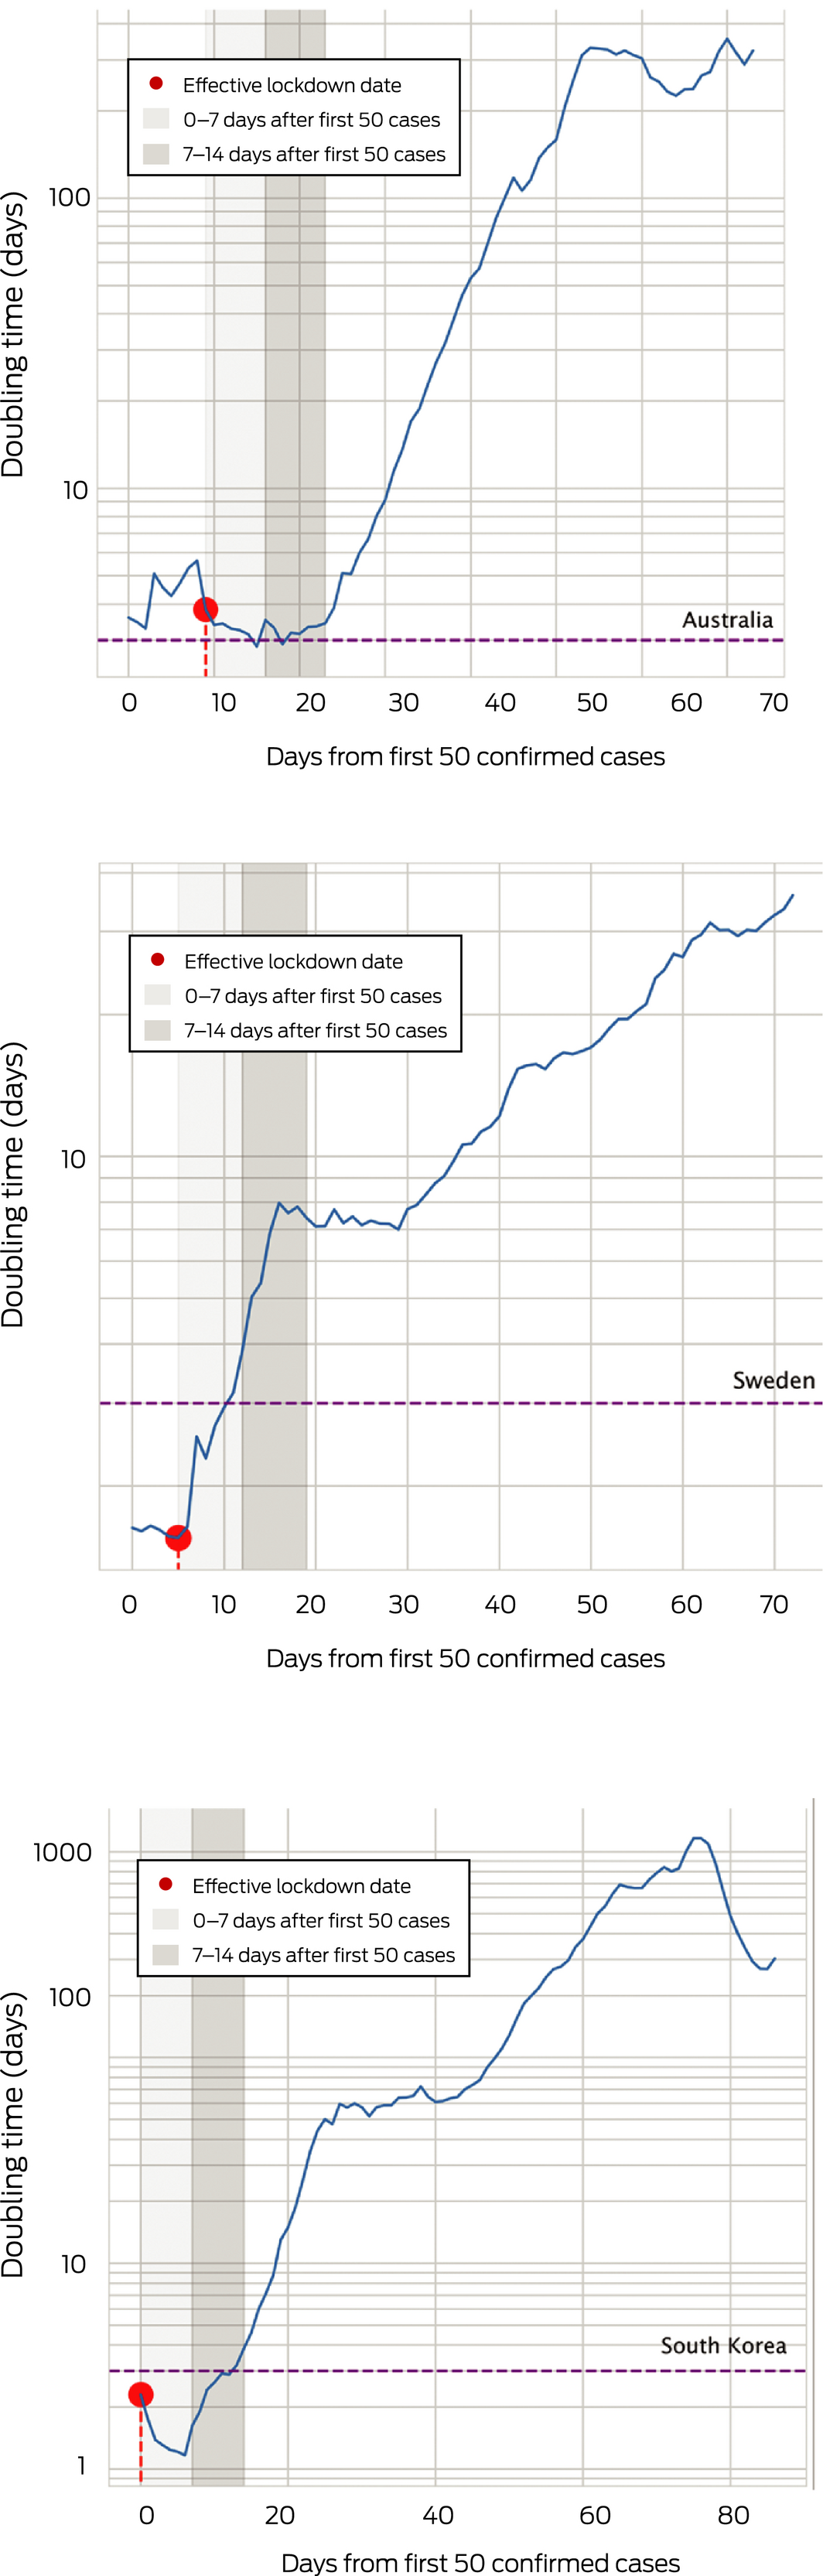
* Source: Johns Hopkins University COVID‐19 dataset (https://github.com/CSSEGISandData/COVID-19). The vertical dashed lines depict the three‐day thresholds (ie, case numbers double in less than one week).
Received 14 April 2020, accepted 11 September 2020
- 1. Markel H, Lipman HB, Navarro JA, et al. Nonpharmaceutical interventions implemented by US cities during the 1918–1919 influenza pandemic. JAMA 2007; 298: 644–654.
- 2. Taylor SJ, Letham B. Forecasting at scale. American Statistician 2017; 72: 37–45.
- 3. Dong E, Du H, Gardner L. An interactive web‐based dashboard to track COVID‐19 in real time. Lancet Infect Dis 2020; 20: 533–534.
- 4. Lauer SA, Grantz KH, Bi Q, et al. The incubation period of coronavirus disease 2019 (Covid‐19) from publicly reported confirmed case: estimation and application. Ann Inter Med 2020; 172: 577–582.
- 5. National Health and Medical Research Council. National statement on ethical conduct in human research 2007 (updated 2018). www.nhmrc.gov.au/guidelines/publications/e72 (viewed July 2020).
We acknowledge the following members of the Artificial Intelligence for Society (AIFS) Collective for their help in conceiving the idea underlying this project: Angela Makris (Western Sydney University, Liverpool Hospital, Bankstown Hospital), Conceicao Santos (Campbelltown Hospital, Western Sydney University), Zaidon Al‐Falahi (Liverpool Hospital, University of New South Wales), Dhruv Nayyar (Liverpool Hospital, University of Western Sydney), Viren Joseph (Microsoft Technology Centre, Sydney), Udo Bhuiyaan (Hessian AI Labs, University of New South Wales), and Antoinette Pavithra Joseph (Australian Institute of Health Innovation, Macquarie University).
No relevant disclosures.