


The prevalence of food allergy among Victorian children is rising.1 In Victoria, children with suspected food allergies can be on hospital outpatient clinic waiting lists for months before being assessed.2 This may lead families to consider alternative avenues, which can lead to poor allergy management and the need for emergency care. Increasing numbers of Victorian children are presenting to emergency departments,3 but we do not know whether the number visiting with food allergy is also rising.
We analysed Victorian Emergency Minimum Dataset (VEMD) data for the period 2005–06 to 2014–15. The VEMD is a statewide administrative dataset that includes non‐identifiable patient‐level data for all Victorian public emergency department encounters. We included all food allergy‐related presentations by children and young people aged 0–19 years, selected according to International Classification of Diseases, tenth revision, Australian modification (ICD‐10‐AM) codes: T78.0 (anaphylactic shock due to a food reaction), T78.1 (other adverse food reactions, not elsewhere classified), T78.4 (allergy, unspecified: includes non‐food‐related allergies), and L27.2 (dermatitis due to ingested food). Presentation rates by age group were calculated using Australian Bureau of Statistics (ABS) age‐stratified population data for Victorians aged 0–19 years;4 rates for regions were calculated using ABS population data for Statistical Areas 2 (SA2).5
The study was deemed exempt from the need for formal ethics approval by the Royal Children's Hospital Human Research Ethics Committee.
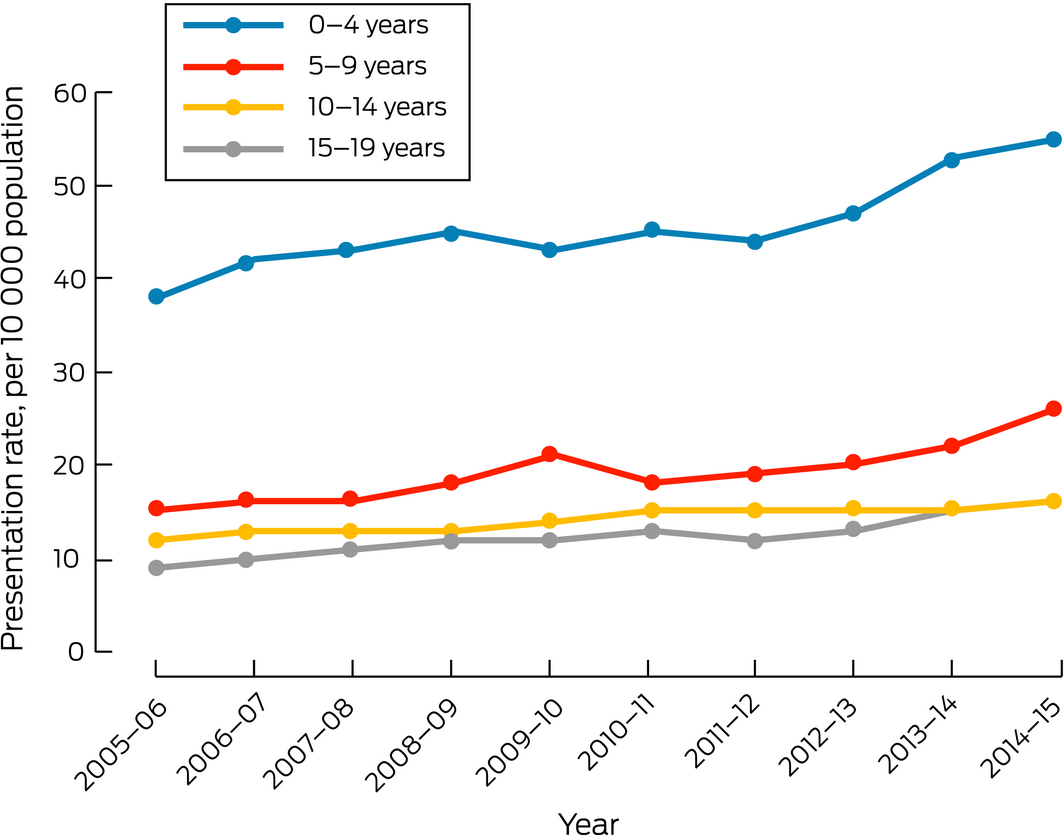
The number of children presenting to emergency departments with food allergy‐related problems increased from 2368 in 2005–06 to 4263 in 2014–15; the presentation rate increased from 18 to 29 per 10 000 population (Box 1). About half the children who presented with food allergy‐related problems were aged 0–4 years, the rate for this age group increasing from 38 to 55 per 10 000 population (Box 2). The proportion of presentations triaged as being more urgent (triage categories 1–3) also increased, from 51% to 63% (Box 1).
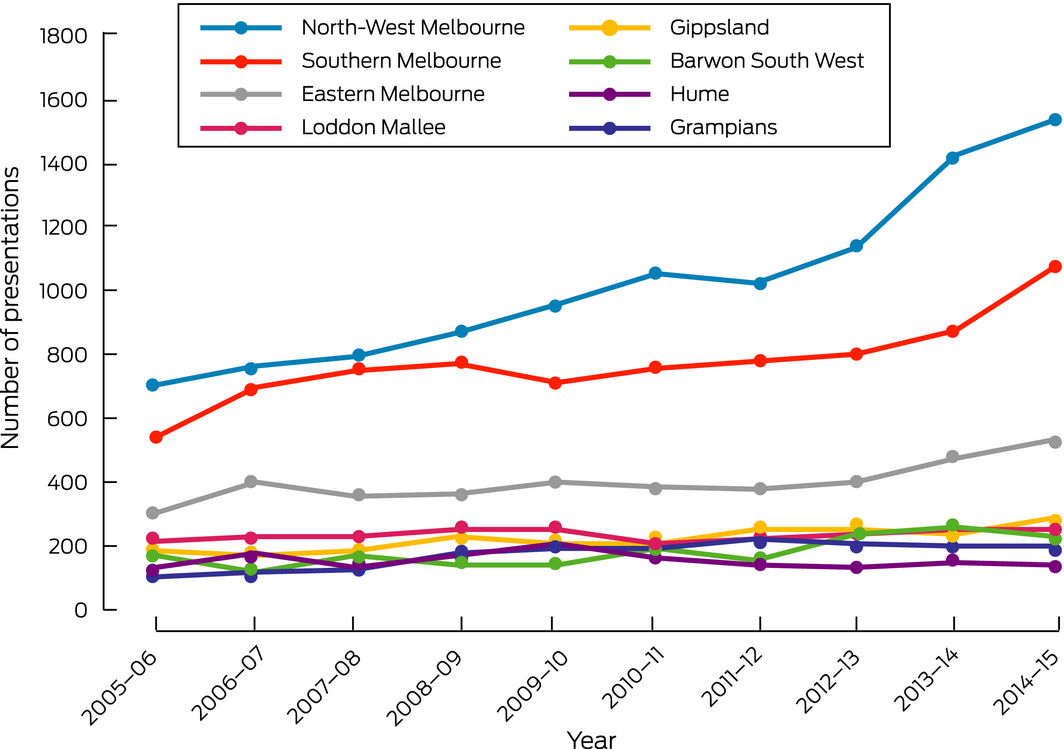
The rate of presentations to metropolitan hospitals increased more (from 18 per 10 000 in 2005–06 to 32 per 10 000 in 2014–15; 78% increase) than did the rate for rural hospitals (26 per 10 000 in 2005–06 to 36 per 10 000 in 2014–15; 38% increase) (Box 1). Hospitals in the North‐West Melbourne region received about one‐third of all allergy‐related emergency department visits, and the number in this region doubled over the study period (706 in 2005–06; 1536 in 2014–15) (Box 3).
These data indicate that the demand for emergency services associated with food allergy‐related problems in children increased during 2005–15. The increase was particularly marked for children aged 0–4 years and for children and young people in the North‐West Melbourne and Southern Melbourne regions. While the reason for the increased burden is not clear — that is, whether the prevalence of allergy had increased (including because of a change in population composition), management plans had changed, or access to community services was reduced — the consequence is greater demand on emergency services across Melbourne.
Box 1 – Presentations to Victorian public emergency departments by childen and young people (0–19 years) with food allergy‐related problems
|
|
2005–06 |
2006–07 |
2007–08 |
2008–09 |
2009–10 |
2010–11 |
2011–12 |
2012–13 |
2013–14 |
2014–15 |
|||||
|
|
|||||||||||||||
|
All food allergy presentations |
|||||||||||||||
|
Number |
2368 |
2680 |
2754 |
2991 |
3082 |
3159 |
3185 |
3422 |
3881 |
4263 |
|||||
|
Rate (per 10 000 population)* |
18 |
20 |
21 |
22 |
23 |
23 |
23 |
24 |
27 |
29 |
|||||
|
ICD‐10‐AM diagnostic codes |
|||||||||||||||
|
T78.0 |
141 (6.0%) |
152 (5.7%) |
154 (5.6%) |
168 (5.6%) |
233 (7.6%) |
283 (9.0%) |
289 (9.1%) |
339 (9.9%) |
437 (11.3%) |
501 (11.8%) |
|||||
|
T78.1 |
800 (33.8%) |
948 (35.4%) |
962 (34.9%) |
1127 (37.7%) |
1167 (37.9%) |
1152 (36.5%) |
1117 (35.1%) |
1288 (37.6%) |
1464 (37.7%) |
1624 (38.1%) |
|||||
|
T78.4 |
1234 (52.1%) |
1351 (50.4%) |
1441 (52.3%) |
1488 (49.8%) |
1552 (50.4%) |
1597 (50.6%) |
1633 (51.3%) |
1702 (49.7%) |
1881 (48.5%) |
2031 (47.6%) |
|||||
|
L27.2 |
193 (8.2%) |
229 (8.5%) |
197 (7.2%) |
208 (7.0%) |
130 (4.2%) |
127 (4.0%) |
146 (4.6%) |
93 (2.7%) |
99 (2.6%) |
107 (2.5%) |
|||||
|
Age |
|
|
|
|
|
|
|
|
|
|
|||||
|
Number |
|
|
|
|
|
|
|
|
|
|
|||||
|
0–4 years |
1202 (50.8%) |
1364 (50.9%) |
1424 (51.7%) |
1537 (51.4%) |
1520 (49.3%) |
1595 (50.5%) |
1593 (50.0%) |
1759 (51.4%) |
2015 (51.9%) |
2152 (50.5%) |
|||||
|
5–9 years |
466 (19.7%) |
515 (19.2%) |
521 (18.9%) |
573 (19.2%) |
673 (21.8%) |
608 (19.3%) |
660 (20.7%) |
702 (20.5%) |
813 (21.0%) |
967 (22.7%) |
|||||
|
10–14 years |
305 (12.9%) |
335 (12.5%) |
355 (12.9%) |
405 (13.5%) |
403 (13.1%) |
426 (13.5%) |
383 (12.0%) |
433 (12.7%) |
515 (13.3%) |
561 (13.2%) |
|||||
|
15–19 years |
395 (16.7%) |
466 (17.4%) |
454 (16.5%) |
476 (15.9%) |
486 (15.8%) |
530 (16.8%) |
549 (17.3%) |
528 (15.4%) |
538 (13.8%) |
583 (13.7%) |
|||||
|
Rate (per 10 000 population)* |
|||||||||||||||
|
0–4 years |
38 |
42 |
43 |
45 |
43 |
45 |
44 |
47 |
53 |
55 |
|||||
|
5–9 years |
15 |
16 |
16 |
18 |
21 |
18 |
19 |
20 |
22 |
26 |
|||||
|
10–14 years |
9 |
10 |
11 |
12 |
12 |
13 |
12 |
13 |
15 |
16 |
|||||
|
15–19 years |
12 |
13 |
13 |
13 |
14 |
15 |
15 |
15 |
15 |
16 |
|||||
|
Sex |
|
|
|
|
|
|
|
|
|
|
|||||
|
Number |
|
|
|
|
|
|
|
|
|
|
|||||
|
Boys |
1284 (54.2%) |
1435 (53.5%) |
1476 (53.6%) |
1625 (54.3%) |
1663 (54.0%) |
1723 (54.5%) |
1779 (55.9%) |
1867 (54.6%) |
2158 (55.6%) |
2388 (56.0%) |
|||||
|
Girls |
1084 (45.8%) |
1245 (46.5%) |
1278 (46.4%) |
1366 (45.7%) |
1419 (46.0%) |
1436 (45.5%) |
1406 (44.1%) |
1555 (45.4%) |
1723 (44.4%) |
1875 (44.0%) |
|||||
|
Rate (per 10 000 population)* |
|||||||||||||||
|
Boys |
19 |
21 |
21 |
23 |
24 |
25 |
25 |
26 |
29 |
32 |
|||||
|
Girls |
17 |
19 |
20 |
21 |
21 |
22 |
21 |
22 |
24 |
26 |
|||||
|
Hospital region |
|
|
|
|
|
|
|
|
|
|
|||||
|
Number |
|
|
|
|
|
|
|
|
|
|
|||||
|
Metropolitan† |
1560 (65.9%) |
1860 (69.4%) |
1907 (69.2%) |
2008 (67.1%) |
2071 (67.2%) |
2194 (69.5%) |
2186 (68.6%) |
2345 (68.5%) |
2781 (71.7%) |
3149 (73.9%) |
|||||
|
Rural‡ |
808 (34.1%) |
820 (30.6%) |
847 (30.8%) |
983 (32.9%) |
1011 (32.8%) |
965 (30.5%) |
999 (31.4%) |
1077 (31.5%) |
1100 (28.3%) |
1114 (26.1%) |
|||||
|
Rate (per 10 000 population)* |
|||||||||||||||
|
Metropolitan† |
18 |
22 |
22 |
23 |
23 |
25 |
24 |
25 |
29 |
32 |
|||||
|
Rural‡ |
26 |
27 |
27 |
32 |
33 |
31 |
32 |
35 |
35 |
36 |
|||||
|
Triage category |
|||||||||||||||
|
Categories 1–3 |
1198 (50.6%) |
1429 (53.3%) |
1568 (57.0%) |
1707 (57.0%) |
1830 (59.3%) |
1861 (59.0%) |
1807 (56.8%) |
2047 (59.8%) |
2365 (61.0%) |
2694 (63.2%) |
|||||
|
Categories 4, 5 |
1170 (49.4%) |
1251 (46.7%) |
1186 (43.0%) |
1284 (43.0%) |
1252 (40.7%) |
1298 (41.0%) |
1378 (43.2%) |
1375 (40.2%) |
1516 (39.0%) |
1569 (36.8%) |
|||||
|
|
|||||||||||||||
|
ICD‐10‐AM = International Classification of Diseases, tenth revision, Australian modification. * All presentation rates are per 10 000 children in Victoria aged 0–19 years in the corresponding category. † Victorian Emergency Minimum Dataset (VEMD) regions: North‐West, Southern, and Eastern Melbourne. ‡ VEMD regions: Loddon Mallee, Gippsland, Barwon South West, Hume, Grampians. |
|||||||||||||||
Received 19 July 2019, accepted 6 February 2020
- 1. Osborne NJ, Koplin JJ, Martin PE, et al. HealthNuts Investigators. Prevalence of challenge‐proven IgE‐mediated food allergy using population‐based sampling and predetermined challenge criteria in infants. J Allergy Clin Immunol 2011; 127: 668–676.
- 2. Hiscock H, Perera P, Danchin MH, et al. Improving timely access to food allergy care: a pragmatic controlled trial. Allergy 2019; https://doi.org/10.1111/all.14105 [Epub ahead of print].
- 3. Hiscock H, Neely RJ, Lei S, Freed G. Paediatric mental and physical health presentations to emergency departments, Victoria, 2008–15. Med J Aust 2018; 208: 343–348. https://www.mja.com.au/journal/2018/208/8/paediatric-mental-and-physical-health-presentations-emergency-departments.
- 4. Australian Bureau of Statistics. 3101.0. Australian demographic statistics, Dec 2016; table 52. June 2017. https://www.abs.gov.au/AUSSTATS/abs@.nsf/DetailsPage/3101.0Dec%202016?OpenDocument (viewed July 2019).
- 5. Australian Bureau of Statistics. ERP by SA2 and above (ASGS 2011), 1991 to 2016. http://stat.data.abs.gov.au/Index.aspx?DataSetCode=ABS_ANNUAL_ERP_ASGS (viewed Nov 2019).
Harriet Hiscock is supported by a National Health and Medical Research Council Practitioner Fellowship (1136222). The Health Services Research Unit is funded by the Royal Children's Hospital Foundation. The Murdoch Children's Research Institute is supported by the Victorian Government Operational Infrastructure Support Program.
No relevant disclosures.