


The known: Investigations of the characteristics and outcomes for critically ill Indigenous patients after trauma have included only small numbers of patients.
The new: The population‐standardised incidence of admissions to intensive care units (ICUs) was more than three times as high for Indigenous as for non‐Indigenous Australians. In‐hospital mortality was similar for Indigenous and non‐Indigenous patients, but Indigenous patients were more likely to be discharged to another hospital and less likely to be discharged home.
The implications: The significantly higher population rate of major trauma‐related ICU admissions for Indigenous people suggests a health gap similar to those for chronic disease and mental health disorders.
Trauma is the second most frequent cause of death among Aboriginal and Torres Strait Islander (Indigenous) Australians.1 Indigenous Australians have higher rates of almost all physical and mental illnesses than non‐Indigenous Australians — at all ages, in men and women, and in remote and non‐remote areas2,3,4,5 — despite the Closing the Gap strategy adopted by all Australian governments in 2008.6 Life expectancy at birth during 2010–2012 was 69.1 years for Indigenous men (10.6 years lower than for non‐Indigenous men) and 73.7 years for Indigenous women (9.5 years lower than for non‐Indigenous women).1 About 20% of Indigenous people live in remote or very remote areas of Australia,1 and their median age is lower than that of the non‐Indigenous population (2011: 22 v 37 years).7
Rates of trauma‐related hospital admission are higher for Indigenous than non‐Indigenous people8,9,10 However, investigations of outcomes for critically ill patients with trauma‐related injuries have included only small numbers of Indigenous patients or have been restricted to single trauma centres.10,11,12 It is therefore unclear whether mortality and morbidity are similar for critically ill Indigenous and non‐Indigenous Australians admitted to intensive care units (ICUs) after major trauma.
We accordingly investigated the admission characteristics and hospital outcomes for Indigenous and non‐Indigenous patients admitted to ICUs after major trauma by analysing data from 92 Australian public hospital ICUs for the period 2010–2015. Although we anticipated differences between Indigenous and non‐Indigenous patients in terms of age and illness severity, we hypothesised that outcomes for patients surviving to ICU admission would be similar because of the nature of ICU treatment (individual nursing care, close monitoring, ready availability of interventional radiology and surgery).
Methods
Patients older than 17 years of age admitted to an ICU with a primary diagnosis of trauma were identified in the Australian and New Zealand Intensive Care Society (ANZICS) Adult Patient Database (APD), one of four clinical quality registries operated by the ANZICS Centre for Outcome and Resource Evaluation (CORE).13 Data from 170 Australian ICUs for the period 1 January 2010 – 31 December 2015, encompassing 80% of trauma‐related ICU admissions in Australia, were initially selected; we then restricted data to patients admitted to the 92 contributing public hospital ICUs, 70 of which (76%) contributed data for all 6 years of the study period. Data for private hospitals were excluded because the case numbers were small (2.6% of trauma‐related ICU admissions) and may have biased the analysis.
Trauma was classified in the ANZICS‐APD in five coded categories that specified the nature of the injury: burns, head injury with or without multi‐trauma, multi‐trauma without head injury, multi‐trauma with spinal injury, and isolated cervical spine injury. To avoid double‐counting of patients, those transferred from one ICU to another at the point of critical care discharge were excluded from our analysis.
The patients’ baseline characteristics (age, sex) were recorded, as were the presence of comorbid conditions (ANZICS‐APD chronic disease categories), physiological status (including need for ventilation support during the first 24 hours of ICU admission), and adverse events during the 24 hours preceding ICU admission, including respiratory or cardiac arrest.
The severity of illness was scored according to the Acute Physiology and Chronic Health Evaluation (APACHE), revision III14 and the Australia and New Zealand Risk of Death (ANZROD) model.15 The ANZROD model was derived from the APACHE II and III scoring systems; it is a mortality prediction model specifically calibrated for Australian and New Zealand ICUs, and its discrimination and calibration is better than APACHE III for critical care patients admitted with trauma.15,16,17 Despite its good predictive performance, the ANZROD model cannot be directly adjusted for changes over time, for which reason we included year of admission as a factor in our analyses.
In order to account for the remoteness of many Indigenous communities, we classified the residential postcodes of each patient in the five Accessibility and Remoteness Index of Australia (ARIA+) categories — major city, and inner regional, outer regional, remote, and very remote locations — and incorporated remoteness as a factor into our multivariable models. ARIA+ is an index of the accessibility by road of locations to service centres.18
Statistical analysis
Results are reported as numbers and proportions, means with standard deviations (SDs), or medians with interquartile range (IQRs). Data were assessed for normality, and groups compared in χ2, Student t, or Wilcoxon rank‐sum tests as appropriate. Incidence projections were calculated using annual Australian Bureau of Statistics population data.19
Multivariable analysis of three dichotomous outcomes (hospital mortality, discharge home, discharge to a rehabilitation facility) was undertaken as hierarchical logistic regression, adjusted for year of admission, patient severity score (ANZROD), and remoteness (ARIA+), with patients nested within sites and site treated as a random effect. Results are reported as odds ratios (ORs) with 95% confidence intervals (CIs). Model discrimination and goodness of fit were assessed by area under the curve (AUC) and the Hosmer–Lemeshow test. Changes over time were assessed by comparing annual rates of admission with those of the initial year (2010), expressed as ORs with 95% CIs. To compare changes between groups over time, an interaction between Indigenous status group and year was fitted. The significance of changes over time relative to population was determined by linear regression. P < 0.01 (two‐sided) was deemed statistically significant. All analyses were performed in SAS 9.4 (SAS Institute).
Ethics approval
The study was approved by the Alfred Hospital Ethics Committee (approval number: 631/17).
Results
Baseline characteristics
During 2010–2015, 23 804 people over 17 years of age were admitted with trauma‐related diagnoses to 92 Australian public hospital ICUs; 1754 (7.4%) had an Indigenous background, and most were men. The mean age of Indigenous patients (42.0 years; SD, 18.3 years) was lower than that of non‐Indigenous patients (48.3 years; SD, 21.1 years); the proportions with most chronic diseases were similar for the Indigenous and non‐Indigenous groups (Box 1).
The mean and median severity of illness scores (APACHE III, ANZROD) were similar for Indigenous and non‐Indigenous patients, and similar proportions of Indigenous and non‐Indigenous patients had required mechanical ventilation (57% v 55%); a larger proportion of Indigenous patients were admitted with burns (11% v 5.1%). A smaller proportion of Indigenous than non‐Indigenous patients resided in major cities and inner regional areas (49% v 78%); 18.5% of Indigenous patients lived in very remote areas, compared with 2.2% of non‐Indigenous patients (Box 1).
Incidence of ICU admissions with trauma‐related injuries
The population‐standardised incidence of ICU trauma‐related admissions was consistently higher for the Indigenous than for the non‐Indigenous population (incidence ratio [2010–2015], 3.37; 95% CI, 3.19–3.57). The incidence of trauma‐related ICU admissions of Indigenous people increased from 621 per million population in 2010 to 1054 per million population in 2015, but was fairly consistent for non‐Indigenous Australians during the study period (Box 2; online Supporting Information, figure 1).
Mortality associated with trauma‐related admissions to ICUs
Hospital mortality was similar for Indigenous and non‐Indigenous patients, both unadjusted (7.8% v 9.0%; OR 0.85; 95% CI 0.71–1.01) and after adjusting for remoteness, severity of illness, and year of admission (adjusted OR, 1.04; 95% CI 0.82–1.31) (Box 3). Hospital mortality was also similar for Indigenous and non‐Indigenous patients in each of the five diagnosis subgroups (Box 4).
Projected unadjusted trauma mortality rates by population were more than three times as high for Indigenous as for non‐Indigenous patients throughout the study period (Box 5). The interaction between Indigenous status and year was not significant (P = 0.77; Supporting Information, figure 2).
Discharge destination after ICU admission with trauma
Median ICU and hospital lengths of stay were similar for Indigenous and non‐Indigenous patients. Indigenous patients were also less likely to be discharged home and more likely to be discharged to another hospital than non‐Indigenous patients (Box 3).
Discussion
Our analysis of data for 23 804 patients admitted to 92 Australian ICUs after major trauma, including 1754 Indigenous Australians, includes the largest study of admission characteristics and outcomes for Indigenous patients admitted to ICUs after major trauma. The projected incidence of ICU admission was more than three times as high for Indigenous as for non‐Indigenous people during 2010–2015, and the admission rate per million population increased almost 70% between 2010 and 2015. Hospital mortality for admitted patients was similar for both groups, both before and after adjusting for year of admission, severity of illness, and remoteness. The median overall hospital length of stay was similar for Indigenous and non‐Indigenous patients.
Comparison with previous studies
Our finding that the population trauma‐related ICU admission rate is higher for Indigenous than non‐Indigenous Australians is consistent with previous reports.9,20 Indigenous patients accounted for 45% of general ICU admissions to the Royal Darwin Hospital during 2000, but constituted only 28% of the Northern Territory population; the authors suggested that living in a rural location was a risk factor.20 More than half of all road‐related trauma in Australia is sustained in rural settings;21 the higher prevalence of alcohol misuse in Indigenous communities has also been seen as a factor.3,22 Poor compliance with road safety legislation — not wearing seatbelts, vehicle overcrowding, speeding — were also identified as factors linked with the high rate of road trauma among Indigenous Australians.22 In addition, lower socio‐economic status may mean that Indigenous people drive older, less safe motor vehicles.23
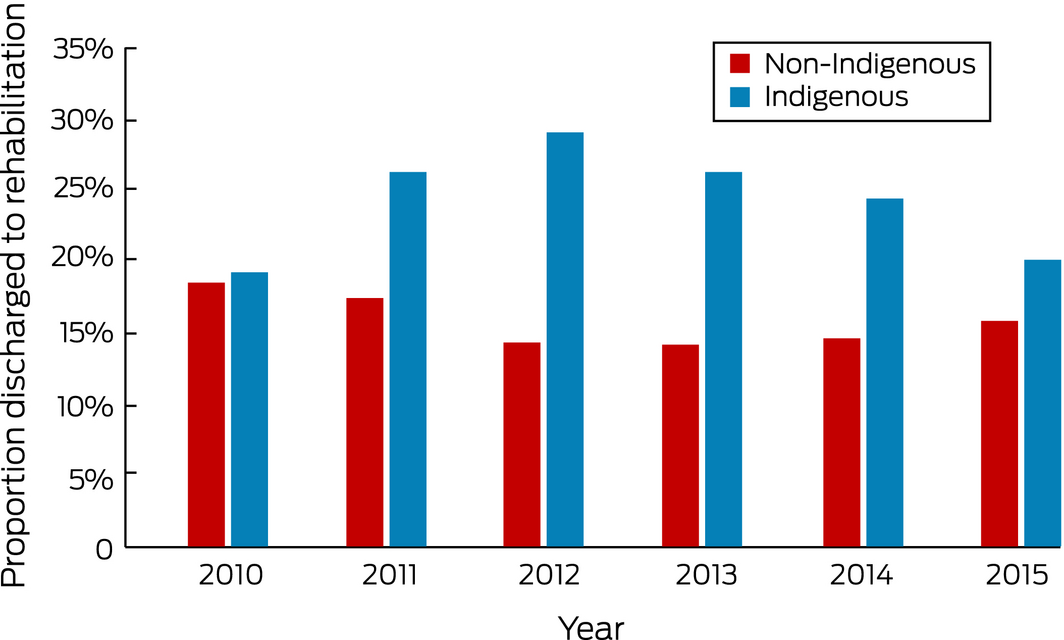
Major trauma can also cause patients significant functional impairment.24 The need for rehabilitation after discharge from hospital may indicate poorer functional outcomes. We found similar rates of discharge to rehabilitative facilities for Indigenous and non‐Indigenous patients. This contrasts with the findings of an investigation of discharge decisions for patients with traumatic brain injury, which found that Indigenous status was strongly associated with deciding to discharge patients to rehabilitation, possibly because of the remote location of many Indigenous communities and the lack of alternatives for ongoing care.25
Implications
The significantly higher population rate of major trauma‐related ICU admissions of Indigenous people suggests a health gap similar to that for chronic disease and mental health disorders.7 The higher proportion of Indigenous patients residing in remote communities, and therefore more likely to require inter‐hospital transfer, may partially explain the higher ICU admission rate. Further reasons should be explored, and public health initiatives developed to reduce the difference; these will include improving alcohol management strategies, seatbelt compliance, driver licensing, vehicle safety, road quality, and access to public transport.26
Despite some differences in baseline characteristics between Indigenous and non‐Indigenous, mortality after major trauma requiring ICU admission was similar. Our findings therefore have no implications for ICU‐specific care of Indigenous patients. The increasing admission rate between 2010 and 2015 requires further investigation, although it may reflect improved compliance with coding for Indigenous status in the ANZICS dataset.
Strengths and limitations
This is the first national study of the admission characteristics and outcomes for Indigenous Australians admitted to ICUs after major trauma. We analysed data from a large, multicentre database, and the external validity of our study is therefore strong. It was strengthened by hierarchical multivariable adjustment for year of admission, illness severity, remoteness, and hospital site.
There were, however, limitations. Documentation of the Indigenous status of patients has been a mandatory component of the minimum hospital dataset since 2007, but it is possible that not all contributing ICUs were fully compliant by 2010, which may explain the low admission numbers for Indigenous patients in this year. There may also have been barriers to patients identifying as Indigenous, particularly for younger Aboriginal patients.27 About 80% of Australian ICUs contributed data to the ANZICS database, so that the population incidence of admissions could only be estimated, but this limitation would have affected documentation of Indigenous and non‐Indigenous patients to a similar degree. We excluded data from the original ICU if patients had been transferred between units, and the probably higher rate of inter‐hospital transfer of Indigenous patients may have caused lead‐time bias resulting from pre‐transfer physiological stabilisation in the referring unit. Excluding data from private hospitals may have biased our analysis.
The ANZICS CORE database has unique categories for trauma diagnoses and does not record an Injury Severity Score (ISS) for patients, making it difficult to compare our results with other series of patients hospitalised for trauma. However, we found the ANZROD score offered predictive performance similar to and perhaps better than that of the ISS for all trauma categories.28 In addition, the ANZICS CORE database does not record information on the mechanism of trauma, pre‐ICU care, or access to an ICU, so we could not explore these variables as explanations for differences between Indigenous and non‐Indigenous patients. Finally, the ANZICS CORE data did not enable us to discriminate between patients being discharged to chronic care facilities or nursing homes, both of which were subsumed under “rehabilitation facilities”.
Conclusion
The population rate of trauma‐related ICU admissions is substantially higher for Indigenous than non‐Indigenous patients, but hospital mortality rates after ICU admission were similar. Indigenous patients were more likely to be discharged to another hospital and less likely to be discharged home than non‐Indigenous patients. This may reflect higher rates of remote residence and inter‐hospital transfers for Indigenous people, as well as barriers to being discharged directly home.
Box 1 – Baseline characteristics of 23 804 patients admitted to 92 Australian public hospital intensive care units (ICUs) with trauma‐related injuries, 2010–2015
|
|
All patients |
Non‐Indigenous |
Indigenous |
P |
|||||||||||
|
|
|||||||||||||||
|
Number of patients |
23 804 |
22 050 |
1754 |
|
|||||||||||
|
Age in years (years), mean (SD) |
47.8 (21.0) |
48.3 (21.1) |
42.0 (18.3) |
< 0.001 |
|||||||||||
|
Sex (men) |
17 612 (74%) |
16 324 (74.0%) |
1288 (73.4%) |
0.58 |
|||||||||||
|
Mechanically ventilated |
13 130 (55.2%) |
12 135 (55.0%) |
995 (56.7%) |
0.17 |
|||||||||||
|
APACHE III score, mean (SD) |
44.3 (26.2) |
44.5 (26.1) |
41.7 (27.0) |
< 0.001 |
|||||||||||
|
ANZROD, mean (SD) |
8.3 (18.0) |
8.8 (0.18) |
7.6 (0.16) |
< 0.001 |
|||||||||||
|
ANZROD, median (IQR) |
1.6 (0.48–6.8) |
1.6 (0.48–6.8) |
1.2 (0.40–5.6) |
< 0.001 |
|||||||||||
|
Comorbid conditions (APACHE II) |
|||||||||||||||
|
Chronic respiratory disease |
463 (1.9%) |
431 (2.0%) |
32 (1.8%) |
0.70 |
|||||||||||
|
Chronic cardiovascular disease |
469 (2.0%) |
445 (2.0%) |
24 (1.4%) |
0.06 |
|||||||||||
|
Chronic liver disease |
226 (0.95%) |
196 (0.89%) |
30 (1.7%) |
0.001 |
|||||||||||
|
Chronic renal failure |
177 (0.74%) |
148 (0.67%) |
29 (1.7%) |
< 0.001 |
|||||||||||
|
Insulin‐requiring diabetes |
270 (1.1%) |
254 (1.2%) |
16 (1.1%) |
0.11 |
|||||||||||
|
Adverse events during 24 hours before ICU admission |
|||||||||||||||
|
Respiratory arrest |
429 (1.8%) |
391 (1.8%) |
38 (2.2%) |
0.23 |
|||||||||||
|
Cardiac arrest |
517 (2.2%) |
478 (2.2%) |
39 (2.2%) |
0.88 |
|||||||||||
|
Trauma category |
< 0.001 |
||||||||||||||
|
Head injury with/without multi‐trauma |
9345 (39.3%) |
8671 (39.3%) |
674 (38.4%) |
|
|||||||||||
|
Multi‐trauma without head injury |
11 144 (46.8%) |
10 385 (47.1%) |
759 (43.3%) |
|
|||||||||||
|
Multi‐trauma with spinal injury |
1457 (6.1%) |
1374 (6.2%) |
83 (4.7%) |
|
|||||||||||
|
Isolated cervical spine Injury |
551 (2.3%) |
506 (2.3%) |
45 (2.6%) |
|
|||||||||||
|
Burns |
1307 (5.5%) |
1144 (5.1%) |
193 (11.0%) |
|
|||||||||||
|
Source of ICU admission |
|
|
|
< 0.001 |
|||||||||||
|
Operating theatre |
6716 (28.2%) |
6355 (28.8%) |
361 (20.6%) |
|
|||||||||||
|
Ward |
1003 (4.2%) |
928 (4.2%) |
75 (4.3%) |
|
|||||||||||
|
Emergency |
14 033 (59.0%) |
12 955 (58.8%) |
1078 (61.5%) |
|
|||||||||||
|
Other ICU or hospital |
2040 (8.5%) |
1802 (8.2%) |
238 (13.6%) |
|
|||||||||||
|
Postcode location (n = 22 999) |
|
|
|
< 0.001 |
|||||||||||
|
Major city |
11 905 (51.8%) |
11 401 (53.5%) |
504 (29.7%) |
|
|||||||||||
|
Inner regional |
5581 (24.3%) |
5259 (24.7%) |
322 (19.0%) |
|
|||||||||||
|
Outer regional |
4027 (17.5%) |
3585 (16.8%) |
442 (26.1%) |
|
|||||||||||
|
Remote |
710 (3.1%) |
597 (2.8%) |
113 (6.7%) |
|
|||||||||||
|
Very remote |
776 (3.1%) |
462 (2.2%) |
314 (18.5%) |
|
|||||||||||
|
Treating hospital |
|
|
|
< 0.001 |
|||||||||||
|
Rural |
3717 (15.6%) |
3228 (14.6%) |
489 (27.9%) |
|
|||||||||||
|
Metropolitan |
2384 (10.0%) |
2088 (9.5%) |
296 (16.9%) |
|
|||||||||||
|
Tertiary |
17 704 (74.4%) |
16 734 (75.9%) |
969 (55.2%) |
|
|||||||||||
|
|
|||||||||||||||
|
ANZROD = Australia and New Zealand Risk of Death; APACHE = Acute Physiology and Chronic Health Evaluation; IQR = interquartile range; SD = standard deviation. ◆ |
|||||||||||||||
Box 2 – Trauma‐related admissions to 92 Australian public hospital intensive care units (ICUs), 2010–2015, by year
|
Year |
Indigenous Australians |
Non‐Indigenous Australians |
ICU admission incidence ratio |
||||||||||||
|
Estimated adult Indigenous population |
Trauma‐related ICU admission incidence, per million population |
Estimated adult non‐Indigenous population |
Trauma‐related ICU admission incidence, per million population |
||||||||||||
|
|
|||||||||||||||
|
2010 |
402 697 |
621 |
17 546 553 |
272 |
2.28 (1.98–2.63) |
||||||||||
|
2011 |
414 705 |
711 |
17 823 946 |
269 |
2.64 (2.30–3.04) |
||||||||||
|
2012 |
422 146 |
856 |
18 143 970 |
253 |
3.38 (2.94–3.89) |
||||||||||
|
2013 |
432 495 |
925 |
18 463 784 |
241 |
3.84 (3.33–4.42) |
||||||||||
|
2014 |
444 554 |
914 |
18 807 543 |
225 |
4.06 (3.51–4.70) |
||||||||||
|
2015 |
455 300 |
1054 |
19 131 800 |
246 |
4.29 (3.73–4.92) |
||||||||||
|
2010–2015 |
423 319 |
847 |
18 319 599 |
251 |
3.37 (3.19–3.57) |
||||||||||
|
|
|||||||||||||||
|
|
|||||||||||||||
Box 3 – Outcomes for patients admitted to 92 Australian public hospital intensive care units (ICUs) with trauma‐related injuries, 2010–2015
|
|
All patients |
Non‐Indigenous |
Indigenous |
Odds ratio (95% CI) |
|||||||||||
|
Unadjusted |
Adjusted* |
||||||||||||||
|
|
|||||||||||||||
|
Number of patients |
23 804 |
22 050 |
1754 |
|
|
||||||||||
|
Length of stay |
|
|
|
|
|
||||||||||
|
ICU (days), median (IQR) (n = 23 800) |
2.5 (1.2–5.8) |
2.6 (1.2–5.8) |
2.4 (1.1–5.2) |
— |
— |
||||||||||
|
Hospital (days), median (IQR) (n = 23 300) |
10.3 (4.9–22.6) |
10.5 (5.0–22.9) |
8.4 (3.8–19.2) |
— |
— |
||||||||||
|
Hospital: survivors (days), median (IQR) (n = 21 373) |
11.0 (5.3–23.7) |
11.2 (5.4–24.0) |
8.9 (4.0–20.2) |
— |
— |
||||||||||
|
Mortality |
|
|
|
|
|
||||||||||
|
In‐hospital |
2129 (8.9%) |
1993 (9.0%) |
136 (7.8%) |
0.85 (0.71–1.01) |
1.04 (0.82–1.31) |
||||||||||
|
Discharge destination |
|
|
|
|
|
||||||||||
|
Discharge home |
14 003 (58.8%) |
12 897 (58.5%) |
1106 (63.1%) |
1.21 (1.10–1.34) |
1.17 (1.04–1.31) |
||||||||||
|
Discharge to rehabilitation |
4046 (17.0%) |
3276 (14.9%) |
222 (12.7%) |
0.69 (0.60–0.80) |
0.88 (0.75–1.02) |
||||||||||
|
Discharge to another hospital |
3558 (14.9%) |
3276 (14.9%) |
282 (16.1%) |
1.10 (0.96–1.25) |
0.84 (0.72–0.96) |
||||||||||
|
Projected population incidence |
|
|
|
|
|
||||||||||
|
Overall incidence ratio for ICU admission† |
— |
1 |
3.37 (3.19–3.57) |
— |
— |
||||||||||
|
|
|||||||||||||||
|
aOR = adjusted odds ratio; CI = confidence interval; IQR = interquartile range; OR = odds ratio. * Adjusted for severity of illness, site, remoteness, and year, with patients nested within site. † Standardised to Australian Bureau of Statistics population estimates for adult population of Australia. ◆ |
|||||||||||||||
Box 4 – Outcomes for patients admitted to 92 Australian public hospital intensive care units (ICUs), 2010–2015, by injury type
|
Injury type |
Hospital mortality rate |
aOR* (95% CI) |
P |
||||||||||||
|
Non‐Indigenous |
Indigenous |
||||||||||||||
|
|
|||||||||||||||
|
Total number of patients |
22 050 |
1754 |
|
|
|||||||||||
|
Burns (n = 1307) |
9.2% (7.4–10.9%) |
5.7% (2.4–9.0%) |
0.55 (0.23–1.34) |
0.19 |
|||||||||||
|
Head injury with/without multi‐trauma (n = 9345) |
15.5% (14.8–16.3%) |
13.5% (10.9–16.1%) |
1.07 (0.79–1.46) |
0.64 |
|||||||||||
|
Multi‐trauma without head injury (n = 11 144) |
3.9% (3.5–4.3%) |
3.4% (2.1–4.7%) |
1.14 (0.70–1.86) |
0.60 |
|||||||||||
|
Multi‐trauma with spinal injury (n = 1457) |
6.3% (5.0‐7.6%) |
6.0% (0.77–11.3%) |
1.05 (0.31–3.57) |
0.94 |
|||||||||||
|
Isolated cervical spine injury (n = 551) |
10.3% (7.6–13.0%) |
6.7% (–0.85 to 14.2%) |
0.84 (0.18–3.81) |
0.82 |
|||||||||||
|
|
|||||||||||||||
|
Injury type |
Discharge home rate |
aOR* (95% CI) |
P |
||||||||||||
|
Non‐Indigenous |
Indigenous |
||||||||||||||
|
|
|||||||||||||||
|
Total number of patients |
22 050 |
1754 |
|
|
|||||||||||
|
Burns (n = 1307) |
74.4% (71.8–77.0%) |
79.3% (73.4–85.1%) |
1.50 (0.95–2.34) |
0.08 |
|||||||||||
|
Head injury with/without multi‐trauma (n = 9345) |
50.0% (48.9–51.1%) |
50.6% (46.7–54.4%) |
0.90 (0.75–1.08) |
0.25 |
|||||||||||
|
Multi‐trauma without head injury (n = 11 144) |
66.8% (65.8–67.7%) |
72.6% (69.4–75.8%) |
1.24 (1.03–1.49) |
0.02 |
|||||||||||
|
Multi‐trauma with spinal injury (n = 1457) |
46.4% (43.7–49.1%) |
49.4% (38.4–60.4%) |
1.12 (0.69–1.82) |
0.64 |
|||||||||||
|
Isolated cervical spine injury (n = 551) |
32.0% (27.9–36.2%) |
44.4% (29.5–59.4%) |
1.90 (0.95–3.79) |
0.07 |
|||||||||||
|
|
|||||||||||||||
|
Injury type |
Discharge to rehabilitation rate |
aOR* (95% CI) |
P |
||||||||||||
|
Non‐Indigenous |
Indigenous |
||||||||||||||
|
|
|||||||||||||||
|
Total number of patients |
22 050 |
1754 |
|
|
|||||||||||
|
Burns (n = 1307) |
7.1% (5.6–8.6%) |
4.1% (1.3–7.0%) |
0.67 (0.30–1.52) |
0.35 |
|||||||||||
|
Head injury with/without multi‐trauma (n = 9345) |
20.3% (17.9–19.6%) |
19.1% (16.1–22.2%) |
1.12 (0.91–1.38) |
0.29 |
|||||||||||
|
Multi‐trauma without head injury (n = 11 144) |
13.7% (13.0–14.3%) |
7.6% (5.7–9.6%) |
0.76 (0.57–1.01) |
0.06 |
|||||||||||
|
Multi‐trauma with spinal injury (n = 1457) |
27.3% (22.8–27.7%) |
20.5% (11.6–29.4%) |
0.87 (0.49–1.53) |
0.62 |
|||||||||||
|
Isolated cervical spine injury (n = 551) |
37.5% (33.2–41.9%) |
22.2% (9.7–34.8%) |
0.48 (0.19–0.81) |
0.07 |
|||||||||||
|
|
|||||||||||||||
|
aOR = adjusted odds ratio; CI = confidence interval. * Non‐Indigenous v Indigenous Australians, adjusted for site, severity and year, with patients nested within site. ◆ |
|||||||||||||||
Received 10 April 2018, accepted 11 July 2018

Abstract
Objectives: To investigate the admission characteristics and hospital outcomes for Indigenous and non‐Indigenous patients admitted to intensive units (ICUs) after major trauma.
Design, setting: Retrospective analysis of Australian and New Zealand Intensive Care Society (ANZICS) Adult Patient Database data from 92 Australian ICUs for the 6‐year period, 2010–2015.
Participants: Patients older than 17 years of age admitted to public hospital ICUs with a primary diagnosis of trauma.
Main outcome measures: ICU and overall hospital lengths of stay, hospital discharge destination, and ICU and overall hospital mortality rates for Indigenous and non‐Indigenous patients.
Results: 23 804 people were admitted to Australian public hospital ICUs after major trauma; 1754 (7.4%) were Indigenous Australians. The population‐standardised incidence of admissions was consistently higher for Indigenous Australians than for non‐Indigenous Australians (847 per million v 251 per million population; incidence ratio, 3.37; 95% CI, 3.19–3.57). Overall hospital mortality rates were similar for Indigenous and non‐Indigenous patients (adjusted odds ratio [aOR], 1.04; 95% CI, 0.82–1.31). Indigenous patients were more likely than non‐Indigenous patients to be discharged to another hospital (non‐Indigenous v Indigenous: aOR, 0.84; 95% CI, 0.72–0.96) less likely to be discharged home (non‐Indigenous v Indigenous: aOR, 1.17; 95% CI, 1.04–1.31).
Conclusion: The population rate of trauma‐related ICU admissions was substantially higher for Indigenous than non‐Indigenous patients, but hospital mortality rates after ICU admission were similar. Indigenous patients were more likely to be discharged to a another hospital and less likely to be discharged home than non‐Indigenous patients.