




Medical education
Key research skills
Volume 209 - Issue 4
Network meta-analysis in health care decision making
Authors: Bram Rochwerg, Romina Brignardello-Petersen and Gordon Guyatt
Med J Aust 2018; 209 (4): 151-154. || doi: 10.5694/mja18.00001
Published online: 20 August 2018
Published online: 20 August 2018
Network meta-analysis helps determine which treatments are viable options and which are not, but its interpretation to inform clinical decision making remains a challenge
Systematic reviews and meta-analyses play a crucial role in clinical decision making.1,2 By combining all studies that directly compare two alternative management strategies and providing a pooled estimate of effect, meta-analyses allow optimal understanding of the potential benefits and harms of available treatments.
A traditional pairwise meta-analysis works well if the clinician is considering an intervention compared with standard of care or deciding between two active treatments. Consider, however, what is becoming the more common scenario in which a patient has to choose between multiple treatment options (eg, treatments A, B and C). Now, consider that a systematic review reveals multiple randomised controlled trials (RCTs): there are many large RCTs comparing A, B and C with placebo; a few comparing A with B; only one small RCT comparing B and C; and none comparing A and C. How can one summarise this literature? One option would be multiple pairwise meta-analyses examining each potential comparison in isolation (each of A, B and C against placebo, A v B, and B v C, and none for A v C).
Network meta-analysis (NMA) provides an alternative superior approach to addressing this situation.2 NMAs present clinicians with a figure, called a network graph, depicting the available comparisons. Box 1 presents the network graph for the body of evidence summarised in the previous paragraph. For each comparison, an NMA considers the pairwise comparisons (Box 1, solid black lines), which we refer to as direct evidence. However, the NMA also incorporates information obtained through one or more common comparators, which we call indirect evidence.3 In some network graphs, the size of the nodes (ie, the interventions) corresponds to the number of patients that received that intervention while the width of the line connecting two interventions (sometimes called “edges”) corresponds with the number of studies included in the direct comparison; some graphs specify the number of the studies associated with each edge (Box 2).4
In Box 1, the broken line connecting A and C (for which there are no studies providing direct evidence) represents an indirect comparison inferred from considering the effects of A versus B relative to C versus B. For instance, if the odds ratio for an adverse outcome in RCTs of A versus B is 0.5, and for C versus B the odds ratio is 0.8, we would infer that A is superior to C and estimate the odds ratio of A versus C as 0.4 (Box 1).
It is clear that the indirect comparison allows us to estimate the relative effect of one intervention versus another when no direct comparison exists. But what is the advantage of including indirect evidence when direct evidence does exist? In our hypothetical network, there is only one small RCT directly comparing B with C, but multiple large RCTs examining B versus placebo and C versus placebo; these RCTs can inform the B versus C comparison.
For instance, if the B versus placebo and C versus placebo RCTs show similar small reductions in adverse events with B and C, the indirect comparison will be consistent with the direct evidence (ie, no difference between B and C). In this case, adding the indirect data to the analysis, only possible through NMA, will substantially improve the precision of the overall pooled estimate. That is, the confidence interval around the network estimate will be substantially narrower than that seen in the single small RCT of B versus C, and will therefore increase our certainty in the comparative effectiveness of B versus C.
Similar to a pairwise meta-analysis, an NMA is only useful if the included studies are similar in their design, the type of patients included, and the outcomes that are measured. If important differences do exist, NMA may not be appropriate, or at the very least our overall certainty in the pooled effect estimates may be lower. Given that substantial heterogeneity is common in NMA, at least in some parts of the network, NMA authors more frequently use random effects rather than fixed effect analysis.
Interpreting network meta-analysis results
When considering clinical questions with multiple treatment options, NMA has clear benefits in comparison with traditional pairwise meta-analysis. But how can patients and clinicians use the output of an NMA to better inform clinical decision making? NMAs often present clinicians with a large body of difficult-to-digest information. When many options exist, there will be a large number of comparisons of alternative treatments. For example, a network with four treatment options will have six estimates; a network with seven treatment options will have 21 comparative estimates to consider; and some with more comparisons are even more complex (Box 3). How to best interpret this output when trying to determine which treatments remain worthy of consideration?
If there are a small number of comparisons, assessment of treatments that remain worthy of consideration, and those that the clinician can reject, may be straightforward; the more treatments, the more challenging this judgement becomes. Further complicating interpretation is the fact that we seldom choose treatments on the basis of a single outcome: almost invariably, we are trading off benefits and harms, and there may well be more than one critical benefit and one critical harm. The output of an NMA needs to provide results in a way that allows the clinician to decide on the relative merits of multiple treatments across multiple outcomes. The task is daunting, and this particular problem is far from being solved. However, NMA practitioners have come up with initial approaches, which we describe here.
One option is to use ranking of interventions: NMA reports often provide such rankings,5 the most common of which uses a statistical measure called SUCRA (surface under the cumulative ranking), which is generated based on cumulative probability plots and provides a numeric presentation of overall ranking.6 SUCRA values range from 0% to 100%, with higher values suggesting a higher rank and a lower value suggesting a lower rank (online Appendix). Ranking is inherently attractive as a simplifying strategy. It has, however, important limitations:
-
ranking of interventions does not provide any assessment of how trustworthy the evidence is informing the rankings;
-
ranking only allows for considering a single outcome at a time;
-
ranking presented by the NMA may not include other factors that are important to decision making (eg, cost, feasibility);
-
ordinal rankings may obscure the magnitude of difference between interventions; and
-
ranking does not consider the possibility that chance alone may have influenced the difference between treatments.7,8
Given these limitations, clinicians must look beyond rankings in helping guide patients to optimal treatment decisions; indeed, the wisest approach may be to ignore the rankings. Instead, clinicians must consider — with the help of the NMA author — the pooled NMA point estimates and assessments of the certainty associated with those estimates. The need for simultaneous consideration of multiple outcomes, including both beneficial and harmful, an issue also present in traditional pairwise meta-analysis, is magnified in NMA due to the multiple comparisons. One potential solution to this challenge is clustering. Authors can plot SUCRA rankings for multiple interventions for two relevant outcomes, with one outcome on the x axis and the other on the y axis. Interventions that cluster towards a higher ranking for increased benefit and decreased harm would be more optimal compared with the opposite situation.
Assessing certainty in network meta-analysis estimates
As with traditional pairwise meta-analysis, the output from NMA is only as trustworthy as the information that goes into the analysis. How do we decide how certain we are in the estimated treatment effects? The Grading of Recommendations Assessment, Development and Evaluation (GRADE) working group provides guidance on how to assess certainty (also known as quality or confidence) in NMA estimates.9 The approach for rating the certainty of evidence from NMA is very similar to that of pairwise meta-analysis and assigns a certainty of high, moderate, low or very low to each comparison for each outcome (eg, one certainty estimate for myocardial infarction for A v B, another for bleeding for A v B). In the context of pairwise meta-analysis of RCTs — or direct comparisons within the NMA — the certainty in the pooled estimate is assessed according to the domains of risk of bias, consistency, directness, precision and publication bias.10,11
Assessing the certainty of the evidence from NMA output has an added layer of complexity because the NMA estimate combines both direct and indirect evidence.9,12 Assessing the certainty in an indirect estimate involves first finding the indirect comparison (there are often several) that contributes most to the network estimate. This comparison will typically be the one with the largest number of RCTs or participants.
In the comparison A versus C in Box 1, assuming the indirect loop through B provides the largest amount of data, the contributing direct comparisons are B versus A and B versus C. The certainty of the indirect comparison will be the lower of the B versus A and B versus C. For instance, if the certainty of evidence is moderate for B versus A and low for B versus C; the certainty of the evidence for the indirect comparison would be low.
Ultimately, the certainty of the network estimate is based on the certainty of both the contributing direct and indirect evidence, how much each of these sources of evidence contribute to the network estimate, the extent to which the two sources agree with each other (which we call their coherence), and the precision of the network estimate.9,12 A statistical test of coherence addresses the likelihood that apparent differences between direct and indirect estimates is significant and can be interpreted in addition to the similarity of their point estimates and an assessment of how much their confidence intervals overlap.13,14 It is likely to be useful for NMA authors to present the direct and indirect estimates of effect in addition to the NMA estimate to allow readers to appreciate the magnitude of difference in the two estimates, the relative contributions of the direct and indirect evidence as reflected in their confidence intervals, and thus better understand the information that was used to generate the pooled NMA estimate.
Returning to the interpretation of the NMA, the candidate treatments will be those with the largest benefits and the smallest harms, but only if those treatments also have high or moderate certainty evidence in their support (or at least, no lower certainty than other treatments that appear inferior). Box 4 provides the results of a previously reported NMA that examined the effect of different intravenous fluids on the outcome of mortality in critically ill patients with sepsis.15 In this example, balanced crystalloid and albumin appear as good candidates for the best treatments, although most of the comparison data examining these interventions are based on low or very low certainty evidence. Light starch is more clearly inferior to the alternatives as all the comparison data are based on moderate certainty evidence.
Conclusion
NMA represents an extension of pairwise meta-analysis that allows for the simultaneous comparison of three or more interventions by considering both direct and indirect evidence. NMA thus provides an estimate of the relative effectiveness of all pairs of comparisons for both benefits and harms and represents the best way of deciding which available treatments remain viable options and which should no longer be considered. Nevertheless, interpretation of NMA to inform clinical decision making remains a challenge. Ranking interventions, although attractive to end users, has important limitations that NMA authors who choose to use ranking must make evident to their clinician readers. Evaluation of the certainty of evidence from NMA, using tools such as GRADE, is imperative. The use of NMA in the medical literature will continue to expand, and clinicians can look forward to advances that will further simplify guidance in the application of NMA to medical decision making.
Box 1 – Network meta-analysis network map*
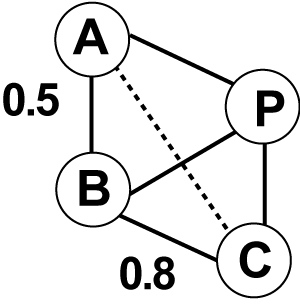
* A, B and C represent alternative treatments. P represents placebo. Direct comparisons exist between all three treatments and placebo, and between A and B and B and C. These direct comparisons are represented by solid lines. There is no direct comparison between A and C; the indirect comparison between A and C is represented by a broken line. Indirect comparison loops for A versus C exist through B and through P. For this example, we will assume the indirect comparison of A versus C through the common comparator of B provides the most data. In that indirect comparison, A reduces the odds of an adverse outcome relative to B by 50% (odds ratio [OR], 0.5) while C relative to B reduces the odds of an adverse outcome by 20% (OR 0.8).
Box 2 – Network graph showing all comparisons for treatment options in Helicobacter pylori infection*
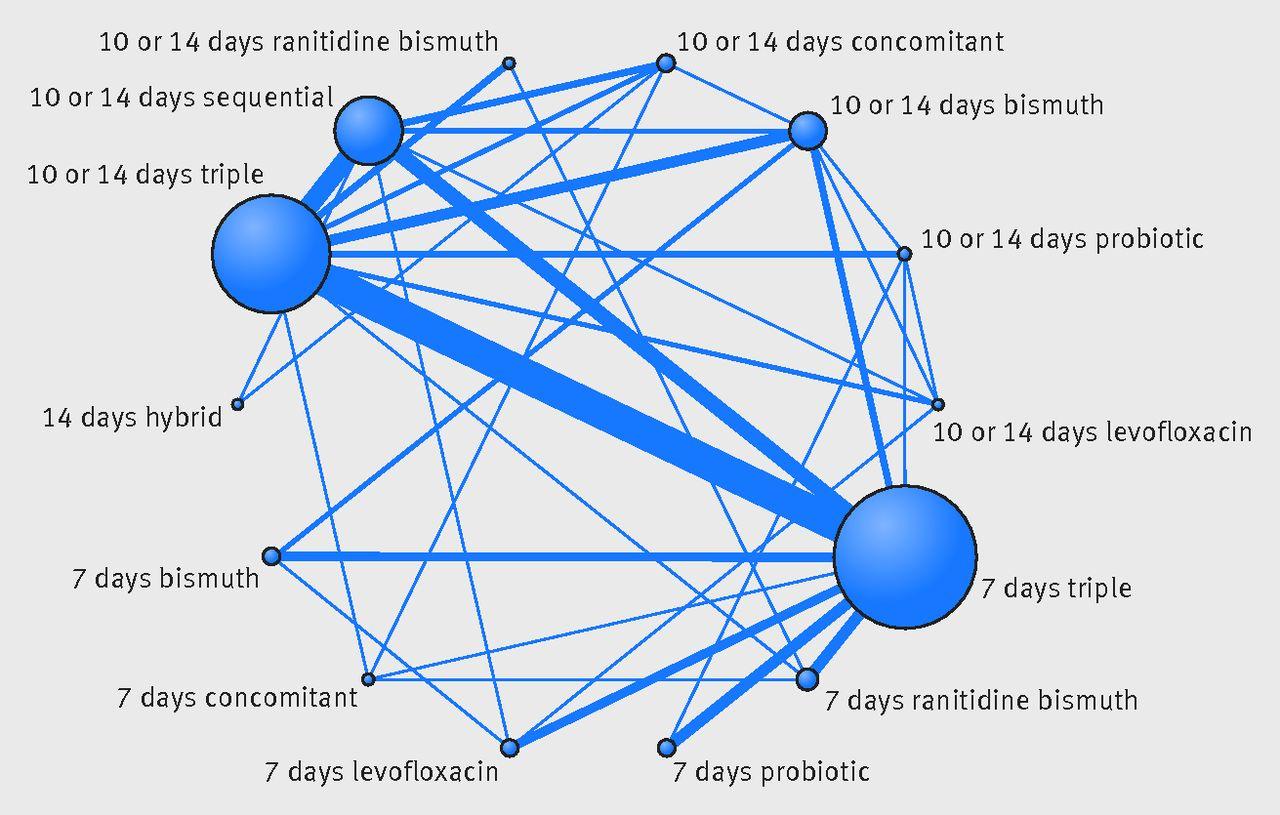
* The size of the nodes is proportional to the number of participants in each node, while the width of the connecting lines correlates with the number of studies in the direct comparison. Reproduced with permission from Li et al.4
Box 3 – Comparative pooled network meta-analysis estimates with 95% credible intervals for treatment options in Helicobacter pylori infection*
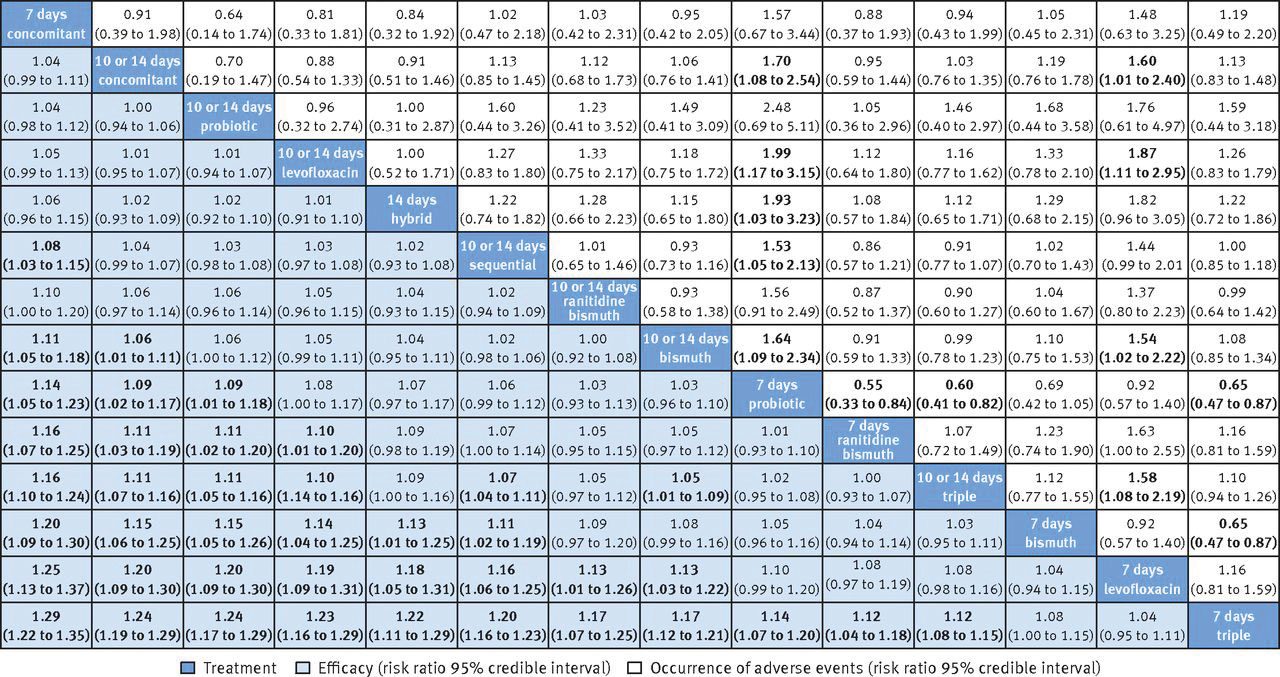
* Highlighted numbers represent significant difference. Reproduced with permission from Li et al.4
Box 4 – Results from a network meta-analysis examining the effect of administering different intravenous fluids on hospital mortality in patients with sepsis*15
|
Comparison |
Mortality NMA estimate (OR; 95% credible intervals) |
GRADE certainty |
|||||||||||||
|
|
|||||||||||||||
|
Albumin v saline |
0.82 (0.65–1.04) |
Moderate |
|||||||||||||
|
Albumin v balanced crystalloid |
1.05 (0.72–1.53) |
Very low |
|||||||||||||
|
Albumin v light starch |
0.79 (0.59–1.06) |
Moderate |
|||||||||||||
|
Balanced crystalloid v saline |
0.78 (0.58–1.05) |
Low |
|||||||||||||
|
Balanced crystalloid v light starch |
0.75 (0.58–0.97) |
Moderate |
|||||||||||||
|
Saline v light starch |
0.96 (0.80–1.15) |
Moderate |
|||||||||||||
|
|
|||||||||||||||
|
GRADE = Grading of Recommendations Assessment, Development and Evaluation. NMA = network meta-analysis. OR = odds ratio. * Balanced crystalloid and albumin appear as good candidates for the best treatments; however, most of the comparison data are based on low or very low certainty evidence. Light starch appears inferior to the alternatives and this is based on moderate certainty evidence for all comparisons. |
|||||||||||||||
Competing interests
No relevant disclosures.
References
- Guyatt GH, Oxman AD, Kunz R, et al. Going from evidence to recommendations. BMJ 2008; 336: 1049-1051.
- Hutton B, Salanti G, Caldwell DM, et al. The PRISMA extension statement for reporting of systematic reviews incorporating network meta-analyses of health care interventions: checklist and explanations. Ann Intern Med 2015; 162: 777-784.
- Mills EJ, Thorlund K, Ioannidis JP. Demystifying trial networks and network meta-analysis. BMJ 2013; 346: f2914.
- Li BZ, Threapleton DE, Wang JY, et al. Comparative effectiveness and tolerance of treatments for Helicobacter pylori: systematic review and network meta-analysis. BMJ 2015; 351: h4052.
- Bafeta A, Trinquart L, Seror R, Ravaud P. Reporting of results from network meta-analyses: methodological systematic review. BMJ 2014; 348: g1741.
- Salanti G, Ades AE, Ioannidis JP. Graphical methods and numerical summaries for presenting results from multiple-treatment meta-analysis: an overview and tutorial. J Clin Epidemiol 2011; 64: 163-171.
- Mbuagbaw L, Rochwerg B, Jaeschke R, et al. Approaches to interpreting and choosing the best treatments in network meta-analyses. Syst Rev 2017; 6: 79.
- Brignardello-Petersen R, Rochwerg B, Guyatt GH. What is a network meta-analysis and how can we use it to inform clinical practice? Pol Arch Med Wewn 2014; 124: 659-660.
- Puhan MA, Schünemann HJ, Murad MH, et al. A GRADE Working Group approach for rating the quality of treatment effect estimates from network meta-analysis. BMJ 2014; 349: g5630.
- Balshem H, Helfand M, Schünemann HJ, et al. GRADE guidelines: 3. Rating the quality of evidence. J Clin Epidemiol 2011; 64: 401-406.
- Alhazzani W, Guyatt G. An overview of the GRADE approach and a peak at the future. Med J Aust 2018. In press.
- Brignardello-Petersen R, Bonner A, Alexander PE, et al. Advances in the GRADE approach to rate the certainty in estimates from a network meta-analysis. J Clin Epidemiol 2018; 93: 36-44.
- White IR, Barrett JK, Jackson D, Higgins JP. Consistency and inconsistency in network meta-analysis: model estimation using multivariate meta-regression. Res Synth Methods 2012; 3: 111-125.
- Efthimiou O, Debray TP, van Valkenhoef G, et al. GetReal in network meta-analysis: a review of the methodology. Res Synth Methods 2016; 7: 236-263.
- Rochwerg B, Alhazzani W, Sindi A, et al. Fluids in Sepsis and Septic Shock Group. Fluid resuscitation in sepsis: a systematic review and network meta-analysis. Ann Intern Med 2014; 161: 347-355.
Provenance: Commissioned; externally peer reviewed.
Interpreting Australian Stillbirth Rate Trends: Implications for Surveillance and Continuous Quality Improvement
Aleena M. Wojcieszek, Kirstine Sketcher-Baker, Christine Andrews, Michael Coory, Imogen Kettle, Melissa Malivoire, David Ellwood, Vicki Flenady
Paracetamol in Pregnancy: Uncertain Evidence, Certain Consequences
David J. Tunnicliffe, Miranda Cumpston, Debra Kennedy, Margie Danchin, Armando Teixeira-Pinto
Fatty Liver Disease in Australia: A Narrative Review on the Epidemiology, Natural History, Prognostication and Management in People With Metabolic Dysfunction
Karl Vaz, Daniel Clayton-Chubb, William W. Kemp, Stuart K. Roberts, Ammar Majeed
Birth prevalence, clinical sequelae, and management of congenital cytomegalovirus infections in Australia, 1999–2023: a national prospective study
Ece Egilmezer, Suzy M Teutsch, Carlos Nunez, Stuart T Hamilton, Adam W Bartlett, Pamela Palasanthiran, Elizabeth J Elliott, William D Rawlinson
The number of cancer‐related deaths that could be attributable to spatial disparities in survival in Australia, 2010–2019: a retrospective population‐based cohort study
Charlotte K Bainomugisa, Jessica Cameron, Paramita Dasgupta, Peter Baade
Mandatory research projects during medical specialist training in Australia and New Zealand
Paulina Stehlik, Caitlin Brandenburg, David A Henry