




Volume 208 - Issue 7
Climate change: a brief overview of the science and health impacts for Australia
Authors: Elizabeth G Hanna and Lachlan J McIver
Med J Aust 2018; 208 (7): 311-315. || doi: 10.5694/mja17.00640
Published online: 9 April 2018
Published online: 9 April 2018
Global warming is associated with intensifying climatic extremes and disruption to human society and human health
Summary
- The scientific relationship between atmospheric CO2 and global temperatures has been understood for over a century.
- Atmospheric concentrations of CO2 due to burning of fossil fuels have contributed to 75% of the observed 1°C rise in global temperatures since the start of the industrial era (about 1750).
- Global warming is associated with intensifying climatic extremes and disruption to human society and human health.
- Mitigation is vital for human health as continued current emission rates are likely to lead to 4°C of warming by 2100.
- Further escalation of Australia’s hot and erratic climate will lead to more extreme climate-related disasters of heatwaves, droughts, fires and storms, as well as shifts in disease burdens.
In 2017, The Lancet reported that “human symptoms of climate change are unequivocal and potentially irreversible — affecting the health of populations around the world today” and added that the “delayed response to climate change over the past 25 years has jeopardised human life and livelihoods”.1 The gravity of this situation warrants inspection, and urgent action. In this article, our aim is to provide an overview of the most recent scientific and organisational literature to inform readers about the current state of knowledge on climate change and its relationship to human health. The issue has global relevance, but here we focus primarily on Australia.
The ambient climate shapes cultural life, so the relationship between human societies and their climate is extremely powerful. Ecological services such as food and water resources, strategies required to feed a community throughout the year, clothing, and housing design are all determined by climate and its direct threats of heat, droughts, fires, storms and floods. Indeed, human survival and societal flourishing depend on successful adaptation to the proclivities of regional climate.
More than a century ago, science accurately explained the relationship between atmospheric carbon dioxide (CO2) levels, greenhouse effect and planetary energy balance, and in the 1930s global warming was observed.2 Yet, the prevailing public thinking was that humans could never significantly influence planetary forces or the climate.
During the past 2.6 million years (Pleistocene and Holocene), atmospheric CO2 levels have oscillated between about 180 parts per million (ppm) during ice ages, and about 280 ppm during warmer interglacial periods.3 Closely aligned with atmospheric CO2 levels is global mean temperature. Importantly, a mere 5°C differentiates ice ages from interglacial periods4 (Box 1).
The evidence for human influence on climate change
Human interference in the global climate is now apparent. Over the past 150 years, atmospheric CO2 concentrations have risen rapidly from a 12 000 year steady level of 280 ppm to 410 ppm,6 a level not seen since the Pliocene (5.3–2.6 million years ago) 7 As projected by the laws of thermodynamics, this 46% rise in atmospheric CO2 has been accompanied by rising global average temperatures. Human influences on climate change arise primarily from combustion of fossil fuels and changes in land use.8
The capacity of a gas or other agent to affect atmospheric energy balance, thereby contributing to climate change, is measured as radiative forcing (watts per square metre). Human activities cause significant changes in concentrations of long-lived gases (eg, CO2, halocarbons, nitrous oxide), short-lived gases (eg, methane that lingers in the atmosphere for a year to a few decades), surface albedo, aerosols and contrails in the atmosphere. Box 2 provides a summary of these principal components of the radiative forcing of climate change for 2011 relative to the start of the industrial era (about 1750). Positive forcings lead to warming of climate and negative forcings lead to cooling. Anthropogenic emissions elicit a warming effect, whereas atmospheric aerosols cool the atmosphere by blocking incoming energy from the sun. Natural variation in solar radiance provides a relatively very small positive forcing (warming) effect. Box 3 shows the effective radiative forcing, which is the net effect of the positive forcing of greenhouse gases, moderated by the cooling effect of aerosols to give the total anthropogenic forcing in watts per square metre over the Earth.
Despite growing awareness, by 2017 emissions had not yet stabilised. Over the past two years, global emissions have continued to increase at a record rate of almost 3 ppm per year.10 This is more than 100 times faster than when the last ice age ended.11
Future warming is dependent on levels of economic and population growth, and future emission trajectories. Developed in 2010,12 the Intergovernmental Panel on Climate Change in its most recent assessment report adopted scenarios to serve as the basis for modelling and describing climate projections.13 These four representative concentration pathways (RCPs) are based on possible radiative forcing values. The RCPs range from the worst-case scenario of business as usual with continued high growth and high emissions (RCP8.5), to the best-case scenario where emissions stabilise at 2013 levels until 2020, followed by decline and becoming negative by 2100 (RCP2.6), and include two intermediary scenarios (Box 4).
The urgent need to reduce emissions
The urgency of initiating emissions reductions is well recognised as scientists are increasingly arguing that limiting warming to 2°C is no longer feasible; yet this level of warming may have unacceptable social and environmental costs and trigger irreversible climate feedbacks.14,15 Mitigating climate change now is less disruptive than the consequences of not mitigating; moreover, delayed mitigation will need to be very drastic. For example, palaeoclimate records indicate that temperatures matching 2016 did, when sustained, correspond to a global sea level between 6 and 9 metres higher than that of today,16 a change which would likely create millions of climate refugees seeking refuge in Australia. Currently, 30% of the world’s population are exposed to climatic conditions exceeding lethal heat thresholds (defined as precipitating multiple heat deaths) for at least 20 days a year. By 2100, this proportion is projected to increase to 48% with drastic reductions of greenhouse gas emissions, and to 74% under a scenario of growing emissions.17
Even if drastic emission reductions were immediately introduced, embedded climate system inertia dictates that observed global trends such as rainfall anomalies, extreme temperatures and sea level rises will continue for many millennia.18 Control of future global warming therefore depends upon global cooperation and efficacy in reducing carbon emissions.
Evidence that the combustion of fossil fuels is responsible for about 75% of the additional atmospheric carbon19 is found in the carbon embedded within tree rings and bubbles within ice cores.20 These show that the atmospheric 13C:12C isotope ratio has distinctively decreased since the industrial revolution.21 The photosynthetic process alters the 13C:12C ratio in plants from the atmospheric ratio, and burning fossilised plant material releases the 12C isotopes that plants absorbed millions of years ago into the atmosphere in the form of CO2 molecules.22
In addition to absorbing 90% of the additional heat,23 global oceans have absorbed about 27% of anthropogenic CO2 emissions since the beginning of the industrial revolution,19 which has lowered ocean pH by 0.1 units.24 Marine organisms and ecosystems are particularly sensitive to ocean acidification.25 For example, exoskeleton formation of krill, at the base of the marine food web, relies on a stable marine carbonate system. Currently, 3.1 billion people derive at least 20% of their animal protein sources from fish.26 Significant nutritional deficits could arise from marine fisheries stock losses when acidification and warming sea temperatures compound existing threats from overfishing.
Climate change threats to the health of Australians
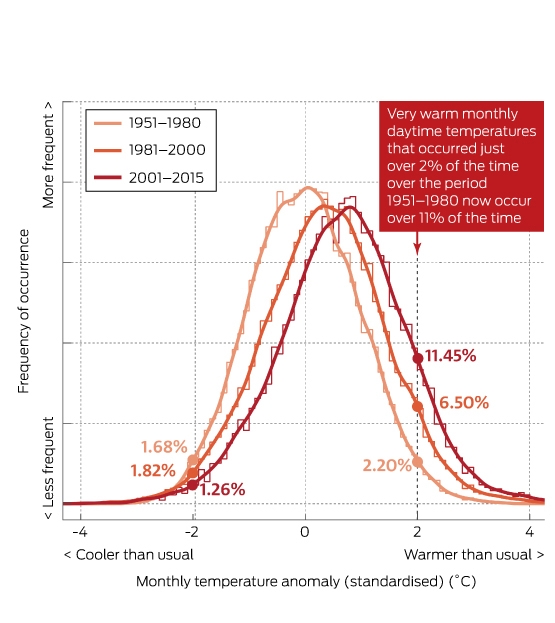
Despite being a wealthy developed nation, Australia is highly vulnerable to climate change, due largely to its unique geoclimatic features. Australia is the driest inhabited continent on earth27 and has the greatest variability of rainfall of any country. Further, Australia’s average daily temperature is 13.7°C warmer than the global average of 8.1°C28 and is getting hotter, with newly observed hot-to-cold temperature records now at a ratio of 12:1.29 Heat extremes are the most risky. Box 5 demonstrates the almost fivefold increase in frequency of extreme temperatures (> 2 standard deviations above the average) despite relatively small increases in mean temperatures.30
Claiming at least 5332 fatalities between 1844 and 2010, heat exposure is more lethal than any other natural disaster31 and represents Australia’s greatest current climate-related health burden. Winter cold-related deaths arise predominantly through respiratory diseases, often with contributing socio-economic determinants, rather than through direct exposure.32 In contrast, heat deaths are exposure related. Heat death occurs when heat gain exceeds the capacity to shed heat to a hot ambient environment. Thermoregulatory response fails, and cardiac compromised patients succumb due to the inability of the heart to meet perfusion needs of increased shunting of blood for temperature control, especially when dehydrated.33 Heat gain ultimately results in multi-organ failure.
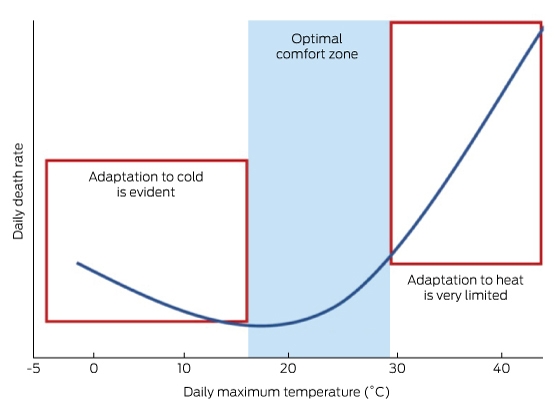
Entire populations cannot exist permanently in air-conditioned environments during heat waves. Human thermoregulatory limitations therefore place upper boundaries to human heat tolerance and thus survivability in a warming climate.33 International consistency exists in the temperature–mortality relationship as a J-shaped curve. Adaptation to cold environments is reflected in variability and a relative shallow rise, whereas above the comfort threshold, heat mortality rises steeply, indicating thermotolerance and adaptation limitations (Box 6).
A combination of heat and drought precipitates high fire risk. In the period 1901–2011, 260 Australian bushfires resulted in 825 reported civilian and firefighter fatalities.36 The number of admitted and non-admitted injuries and burns cases since 1901 remains unknown. Large fires exacerbate existing respiratory conditions37 and elicit chronic mental health morbidity secondary to loss and grief, and sometimes guilt.38 Extreme fire weather has increased over recent decades, and across large parts of Australia, the fire season now extends further into spring and autumn.30,39
Climate change influence on Australia’s rainfall variability has led to increased droughts and floods.39 May–July rainfall has reduced by about 19% since 1970 in the southwest of Australia, whereas the continental southeast has experienced an 11% decline in rainfall since the mid-1990s during the important April–October growing season. All climate models project increases in extreme droughts across Southern Australia (occurring between 1.5 and 2.7 times every 20 years), and by 2090, time spent in drought ranges from 35% to 80%.30,39 Droughts reduce water supply and quality, posing health risks to stock and to communities reliant on inland river systems for their water supply40 and economic livelihood.
Despite near-national water restrictions during the protracted Millennium drought, many farmers and rural townships ran out of water, and some were listed as unviable. Rural families and regional communities suffered deep economic losses and rural suicides spiked.41 About 9% of total deaths in New South Wales men aged 30–49 years between 1970 and 2007 were drought-related suicides.41
Between 1900 and 2015, the total number of recorded deaths from floods in Australia was 1859, an average national annual death rate of 2.91 fatalities per 100 000 people per year.42 Death rates have steadily declined over time. The Queensland floods of 2011 claimed the lives of 23 people, and generated 56 200 insurance claims, with payouts totalling $2.55 billion.43 Many were uninsured, and payouts do not fully recompense loss and wide scale lingering grief among affected communities. Emergency and recovery response capacities can be overwhelmed in natural disasters.
Attributing probability risks of rainfall changes to climate change is a more difficult task than attributing temperature changes. This is especially so in Australia, where intrinsic rainfall variability on interannual and interdecadal timescales is uncommonly large. Notwithstanding, studies suggest that the high sea surface temperatures currently contribute 20% (mean estimate) of rainfall anomalies.39 Continued current high emission scenarios will result in more severe flooding events.44
Australia’s large geographical landmass delivers variation in regional rainfall patterns and differentiated future climate projections. Excluding southwestern Western Australia, extreme rainfall events (wettest day of the year and wettest day in 20 years) are projected to increase in intensity with high confidence (defined by the Intergovernmental Panel on Climate Change as > 80% probability of being correct).39
Tropical cyclones are the most devastating weather systems affecting northern Australia. Strong natural variability prevents detection of statistically robust trends; however, a 50% increase in the proportion of tropical cyclones reaching category 3 or higher was recorded from the period 1960–85 to the period 1985–2010.45 The low frequency of tropical cyclones making landfall in Australia prevents statistical certitude in projecting future probabilities. The physical science, however, suggests clear risks: higher sea surface temperatures are associated with more energy, higher wind speeds, more intense tropical cyclones and higher rainfall intensity,46 and thus likely greater damage to human systems. The total numbers of tropical cyclones are expected to be similar or decline in frequency in the Australian region by 2050, yet their severity will potentially increase, with an associated poleward shift in the regions of both genesis and dissipation.47
Extensive flooding and cyclone damage impede essential services, delivery of health care, repairs to infrastructure and economic recovery. Affected communities face a gauntlet of associated health problems including acute effects of drownings, falls, electrocutions, bites, skin infections and mosquito- and gastrointestinal-borne illnesses, as well as protracted grief and psychological health issues.
A growing body of literature links climate change to food and water insecurity and increased disease burden.48 Recent and historical experiences indicate that infectious disease outbreaks often follow extreme rainfall events,49 although Australians’ health risk is considerably less than that of developing countries.50 Many vector-borne diseases are climate sensitive, as mosquito densities relate to rainfall and temperature. In Australia, Ross River virus, Barmah Forest virus and dengue fever are three of the most common and clinically important vector-borne diseases,51 yet the relationship between disease outbreaks and climate change is less clear. For example, rainfall was the weakest predictor of vector-borne disease burden in a recent Australian study that explored climate variables on Ross River virus, Barmah Forest virus and dengue transmission rates, as the homophilic vector breeding cycle responds also to human intervention such as travel, habitation patterns, water containers51 and prevention campaigns.
Locally acquired dengue transmission only occurs in urban areas of north Queensland from Townsville to the Torres Strait, where the vector (Aedes aegypti) is present.52 Australia’s increasing incidence of dengue fever is thought to result primarily from the long term growth in the travel sector, notably to South East Asian locations where dengue is endemic.51 With global increases in vectorial capacity since the late 1970s of A. aegypti and A. albopictus,48 endemicity of dengue fever in northern Queensland is regarded as a very real possibility.52 A warming world suggests that the environmental niche for mosquitos will move southward, yet the complexities of human–environment interactions and efficacy of prevention campaigns, surveillance and medical management make future disease burdens difficult to quantify.
Conclusion
Australia’s climate is changing. Adaptation is required and, perhaps more importantly, mitigation to avoid the worst of future health burdens. Current trends suggest a future of increasing heatwaves, even greater rainfall variability, and more fires. Additional heat is likely to generate fewer winter respiratory deaths yet more heat exposure morbidity and mortality. Further exacerbations of Australia’s extreme rainfall variability will intensify water shortages and storm and flood damage, compounded by likely societal interruptions and health challenges. The picture for climate-sensitive vector-borne diseases remains unclear, although cases spreading to southern regions remain possible. A realignment of health services to address the shift in disease burden is required to secure Australia’s current high level of health care.
Box 1 – Global average temperatures and atmospheric CO2 levels for the past 800 000 years
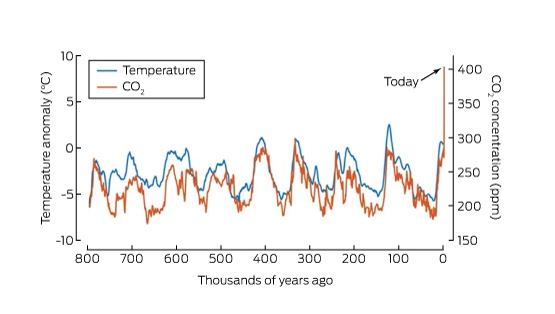
Reproduced with permission from Henley and Abram.5
Box 2 – Radiative forcing of climate for the period 1750–2011
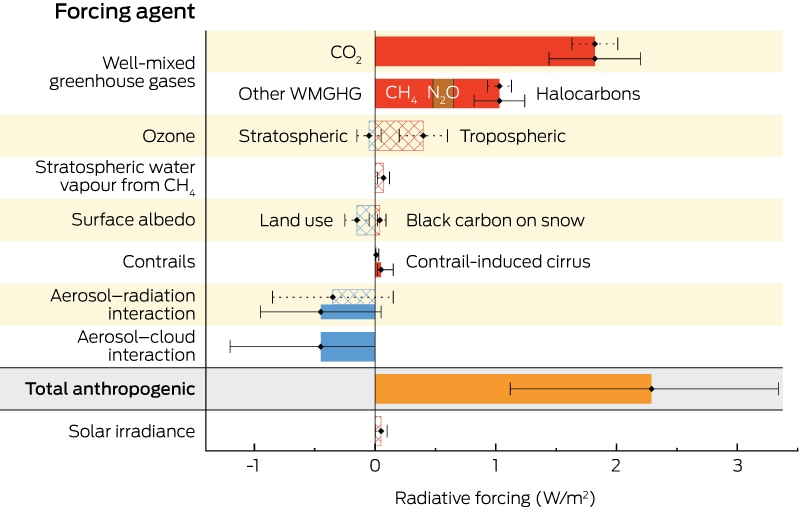
Reproduced with permission from Working Group I Contribution to IPCC AR5 (Figure 8.15).9 Radiative forcing is shown as hatched and effective radiative forcing as solid. Uncertainties (95% CI) are shown for radiative forcing as dotted lines and for effective radiative forcing as solid lines.
Box 3 – Probability density function of effective radiative forcing (RF) of climate for the period 1750–2011
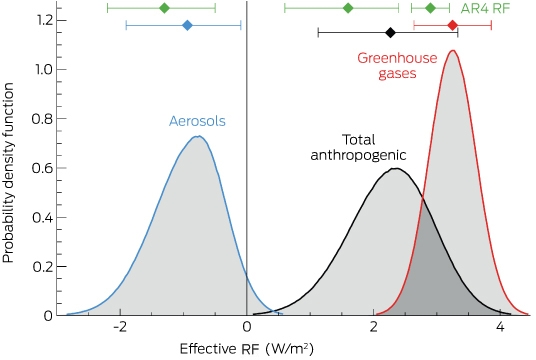
Reproduced with permission from Working Group I Contribution to IPCC AR5 (Figure 8.16).9 Lines at the top of the figure compare the best estimates and uncertainty ranges (95% CI) for aerosol, greenhouse gas and total anthropogenic change with RF estimates from Climate change 2007: synthesis report. Contribution of Working Groups I, II and III to the Fourth Assessment Report of the Intergovernmental Panel on Climate Change. Geneva: IPCC, 2007 (AR4).
Box 4 – Global mean temperature change projections to 2100 relative to 1986–2005 for the four representative concentration pathway (RCP) scenarios: RCP2.6, RCP4.5, RCP6.0 and RCP8.5
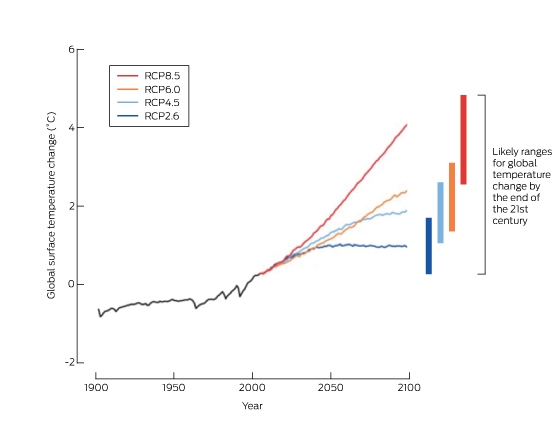
Reproduced with permission from Working Group I Contribution to IPCC AR5 (FAQ 12.1, Figure 1).13
Box 5 – Distribution of Australian monthly daytime temperature anomalies (standardised with respect to the 1951–1980 base period) aggregated across 104 locations and all months of the year, for 1951–1980, 1981–2010 and 2001–2015
Reproduced with permission from BOM, CSIRO. State of the Climate 2016.30
Competing interests
No relevant disclosures.
References
- Watts N, Amann M, Ayeb-Karlsson S, et al. The Lancet Countdown on health and climate change: from 25 years of inaction to a global transformation for public health. The Lancet 2017; https://doi.org/10.1016/S0140-6736(17)32464-9 [Epub ahead of print].
- American Institute of Physics. The discovery of global warming: timeline (milestones). https://history.aip.org/climate/timeline.htm (viewed Aug 2017).
- Scripps Institute of Oceanography. The Keeling curve. https://scripps.ucsd.edu/programs/keelingcurve/ (viewed Nov 2017).
- Goddard Institute for Space Studies, National Aeronautics and Space Administration. How carbon dioxide controls Earth’s temperature. 14 Oct 2010. https://www.giss.nasa.gov/research/news/20101014/ (viewed Aug 2017).
- Henley B, Abram N. The three-minute story of 800,000 years of climate change with a sting in the tail. The Conversation 2017; 13 June. https://theconversation.com/the-three-minute-story-of-800-000-years-of-climate-change-with-a-sting-in-the-tail-73368 (viewed Feb 2018).
- Dash JW, Zhang Y, Migliozzi B, Roston E. A forecast for global CO2 levels. Bloomberg Carbon Clock Technical Working Paper. September 2016. https://www.bloomberg.com/graphics/carbon-clock/BLOOMBERG-CARBON-CLOCK-TECHNICAL-WORKING-PAPER.pdf (viewed May 2017).
- Glikson AY. The Plutocene: blueprints for a post-Anthropocene greenhouse Earth. Cham, Switzerland: Springer, 2017.
- Parliament of Australia. Human contribution to climate change. 15 Nov 2010. http://www.aph.gov.au/About_Parliament/Parliamentary_Departments/Parliamentary_Library/Browse_by_Topic/ClimateChangeold/whyClimate/human/human (viewed Oct 2017).
- Myhre G, Shindell D, Bréon F-M, et al. Anthropogenic and natural radiative forcing. In: Stocker TF, Qin D, Plattner G-K, et al, editors. Climate change 2013: the physical science basis. Working Group I Contribution to the Fifth Assessment Report of the Intergovernmental Panel on Climate Change. Cambridge and New York: Cambridge University Press, 2013.
- National Oceanic and Atmospheric Administration Earth System Research Laboratory, Global Monitoring Division. Trends in atmospheric carbon dioxide. https://www.esrl.noaa.gov/gmd/ccgg/trends/global.html#global_growth (viewed Jan 2018).
- CO2 Earth. CO2 Now. CO2 acceleration [webpage]. https://www.co2.earth/co2-acceleration (viewed Jan 2018).
- Moss RH, Edmonds JA, Hibbard KA, et al. The next generation of scenarios for climate change research and assessment. Nature 2010; 463: 747.
- Collins M, Knutti R, Arblaster J, et al. Long-term climate change: projections, commitments and irreversibility. In: Stocker TF, Qin D, Plattner G-K, et al, editors. Climate change 2013: the physical science basis. Working Group I Contribution of to the Fifth Assessment Report of the Intergovernmental Panel on Climate Change. Cambridge and New York: Cambridge University Press, 2013.
- Fuss S, Jones CD, Kraxner F, et al. Research priorities for negative emissions. Environ Res Lett 2016; 11: 115007.
- Hansen J, Sato M, Ruedy R, et al. Global temperature in 2016. New York: The Earth Institute, Columbia University, 2017. http://www.columbia.edu/∼jeh1/mailings/2017/20170118_Temperature2016.pdf (viewed May 2017).
- Hansen J, Sato M, Kharecha P, von Schuckmann K, Beerling DJ, Cao J, et al. Young people’s burden: requirement of negative CO2 emissions. Earth Syst Dynam Discuss. 2016; 2016: 1-40.
- Mora C, Dousset B, Caldwell IR, et al. Global risk of deadly heat. Nat Clim Change 2017; 7: 501-506.
- Clark PU, Shakun JD, Marcott SA, et al. Consequences of twenty-first-century policy for multi-millennial climate and sea-level change. Nat Clim Change 2016; 6: 360-369.
- Le Quere C, Andrew RM, Canadell JG, et al. Global carbon budget 2016. Earth Syst Sci Data 2016; 8: 605-649.
- Real Climate. How do we know that recent CO2 increases are due to human activities? 22 Dec 2004. http://www.realclimate.org/index.php/archives/2004/12/how-do-we-know-that-recent-cosub2sub-increases-are-due-to-human-activities-updated/ (viewed July 2017).
- Friedli H, Lotscher H, Oeschger H, et al. Ice core record of the 13C/12C ratio of atmospheric CO2 in the past two centuries. Nature 1986; 324: 237-238.
- Keeling RF, Piper SC, Bollenbacher AF, Walker SJ. Monthly atmospheric 13C/12C isotopic ratios for 11 SIO stations, 1977-2008. La Jolla, CA: Scripps CO2 Program, University of California. http://cdiac.ess-dive.lbl.gov/trends/co2/iso-sio/iso-sio.html (viewed Feb 2018).
- Gleckler PJ, Durack PJ, Stouffer RJ, et al. Industrial-era global ocean heat uptake doubles in recent decades. Nat Clim Change 2016; 6: 394.
- Hagens M, Middelburg JJ. Attributing seasonal pH variability in surface ocean waters to governing factors. Geophys Res Lett 2016; 43: 12528-12537.
- Bellerby RG. Ocean acidification without borders. Nat Clim Change 2017; 7: 241-242.
- Food and Agriculture Organization of the United Nations. The state of world fisheries and aquaculture: contributing to food security and nutrition for all. Rome: FAO, 2016. http://www.fao.org/3/a-i5555e.pdf (viewed June 2017).
- Holper PN. Australian rainfall — past, present and future. Climate change science information paper. Melbourne: CSIRO, Bureau of Meteorology, 2011. http://www.cawcr.gov.au/projects/Climatechange/wp-content/uploads/2016/11/rainfall-paper.pdf (viewed Feb 2018).
- National Oceanic and Atmospheric Administration, National Centers for Environmental Information. State of the climate: global climate report for April 2017. https://www.ncdc.noaa.gov/sotc/global/201704 (viewed June 2017).
- Lewis SC, King AD. Dramatically increased rate of observed hot record-breaking in recent Australian temperatures. Geophys Res Lett 2015; 42: 7776-7784.
- Bureau of Meteorology, Commonwealth Scientific Institute Research Organisation. State of the climate 2016. Canberra: BOM, CSIRO, 2016. http://www.bom.gov.au/state-of-the-climate/State-of-the-Climate-2016.pdf (viewed Feb 2018).
- Coates L, Haynes K, O’Brien J, et al. Exploring 167 years of vulnerability: an examination of extreme heat events in Australia 1844–2010. Environ Sci Policy 2014; 42: 33-44.
- Hales S, Blakely T, Foster RH, et al. Seasonal patterns of mortality in relation to social factors. J Epidemiol Community Health 2012; 66: 379-384.
- Hanna EG, Tait PW. Limitations to thermoregulation and acclimatisation challenges human adaptation to global warming. Int J Environ Res Public Health 2015; 12: 8034-8074.
- Baccini M, Biggeri A, Accetta G, et al. Heat effects on mortality in 15 European cities. Epidemiology 2008; 19: 711-719.
- Li T, Horton RM, Bader DA, et al. Aging will amplify the heat-related mortality risk under a changing climate: projection for the elderly in Beijing, China. Sci Rep 2016; 6: 28161.
- Blanchi R, Leonard J, Haynes K, et al. Life and house loss database description and analysis. Bushfire CRC Report to the Attorney-General’s Department. Melbourne: CSIRO, 2012. https://publications.csiro.au/rpr/download?pid=csiro:EP129645&dsid=DS2 (viewed Feb 2018).
- Reid CE, Brauer M, Johnston FH, et al. Critical review of health impacts of wildfire smoke exposure. Environ Health Perspect 2016; 124: 1334-1343.
- Zara C, Parkinson D, Duncan A, Joyce K. Men and disaster: men’s experiences of the Black Saturday bushfires and the aftermath. Aust J Emerg Manag 2016; 31: 40-48.
- CSIRO, Bureau of Meteorology. Climate change in Australia: projections for Australia’s NRM regions. Technical Report. Canberra: CSIRO, Bureau of Meteorology, 2015. https://www.climatechangeinaustralia.gov.au/en/publications-library/technical-report/ (viewed Feb 2018).
- Li S, Bush RT, Mao R, et al. Extreme drought causes distinct water acidification and eutrophication in the Lower Lakes (Lakes Alexandrina and Albert), Australia. J Hydrol 2017; 544: 133-146.
- Hanigan IC, Butler CD, Kokic PN, Hutchinson MF. Suicide and drought in New South Wales, Australia, 1970 – 2007. Proc Natl Acad Sci U S A 2012; 109: 13950-13955.
- Haynes K, Coates L, de Oliveira F, et al. An analysis of human fatalities from floods in Australia 1900-2015. Report for the Bushfire and Natural Hazards CRC. Canberra: Department of Industry, Innovation and Science, 2016.
- van den Honert RC, McAneney J. The 2011 Brisbane floods : causes, impacts and implications. Water 2011; 3: 1149-1173.
- Power SB, Delage FPD, Chung CTY, et al. Humans have already increased the risk of major disruptions to Pacific rainfall. Nat Commun 2017; 8: 14368.
- Ren D, Leslie LM. Changes in tropical cyclone activity over northwest Western Australia in the past 50 years and a view of the future 50 years. Earth Interactions 2015; 19. 1-24.
- Holland G, Bruyere CL. Recent intense hurricane response to global climate change. Clim Dyn 2014; 42: 617-627.
- Lavender SL, Walsh KJE. Dynamically downscaled simulations of Australian region tropical cyclones in current and future climates. Geophys Res Lett 2011; 38: L10705.
- Watts N, Adger WN, Ayeb-Karlsson S, et al. The Lancet Countdown: tracking progress on health and climate change. The Lancet 2016; 389: 1151-1164.
- McMichael AJ. Climate change and the health of nations. Famines, fevers, and the fate of populations. Oxford: Oxford University Press, 2017.
- World Health Organization. Climate change and health. Fact sheet. Updated July 2017. http://www.who.int/mediacentre/factsheets/fs266/en/ (viewed Feb 2018).
- Stratton MD, Ehrlich HY, Mor SM, Naumova EN. A comparative analysis of three vector-borne diseases across Australia using seasonal and meteorological models. Sci Rep 2017; 7: 40186.
- Viennet E, Ritchie SA, Faddy HM, et al. Epidemiology of dengue in a high-income country: a case study in Queensland, Australia. Parasit Vectors 2014; 7: 379.
Linked content
-
MJA InSight: Health and climate change: call for urgent action
-
MJA Podcast: Dr Elizabeth Hanna
Provenance: Commissioned; externally peer reviewed.
Designing Housing to Reduce Overcrowding-Related Harms: Rheumatic Heart Disease as the Canary in the Coal Mine
Simon Quilty, Veronica Matthews, Angus Baumann, James Marangou, Bo Remenyi, Gavin Wheaton, Serena Morton Nabanunga, Norman Frank Jupurrurla, Simon Robinson, Steve Mintern, Cary Duffield, Joshua R. Francis, Paul C. Memmott
Australian Climate Leadership in 2026: COP-Out or Step-Up for Health?
Catherine G. A. Pendrey, Angie Bone, Aletha Ward, Francis Nona, Michelle Isles, Paul M. Kelly, Nicholas J. Talley
The impact of the Breast Screen NSW transition from film to digital mammography, 2002–2016: a linked population health data analysis
Rachel Farber, Nehmat Houssami, Katy J L Bell
Shifting focus to adolescent wellbeing and inclusive participation in the digital age
Allyson R Todd, Elena Wang, Stephanie R Partridge
The CURE Asthma roadmap
Gary P Anderson, Anthony Flynn, Phil G Bardin, John D Blakey, Shyamali C Dharmage, Paul Foster, Peter G Gibson, Adam Jaffe, Alan James, Christine R Jenkins, Sundram Sivamalai, Peter D Sly, Guy B Marks, Vanessa M McDonald, Judy Wetttenhall
Protecting public interest journalism as a public health good
Bronwyn Fredericks, Neha Lalchandani, Melissa A Sweet, Alex Cramb, Carmel Williams