


The known The mortality risk for people with end-stage kidney disease and type 2 diabetes mellitus is higher than for patients with end-stage kidney disease alone.
The new Cardiovascular disease-related mortality among people with end-stage kidney disease was higher for those who also had type 2 diabetes. The difference was particularly marked in patients under 50 and in people for whom end-stage kidney disease was attributed to diabetic nephropathy.
The implications Management plans which ensure that cardiovascular disease risk factors are closely monitored and adequately controlled may reduce cardiovascular disease-related mortality among patients with end-stage kidney disease and type 2 diabetes.
Type 2 diabetes mellitus is the most frequent cause of end-stage kidney disease (ESKD). In Australia, the proportion of people diagnosed with incident ESKD who have type 2 diabetes when they commenced renal replacement therapy increased from 32% in 2003 to 45% in 2015, with a corresponding increase in the proportion of patients with ESKD attributed to diabetic nephropathy (2003, 26%; 2015, 37%).1,2 Similar trends have been reported for patients wait-listed for transplantation and for kidney transplant recipients.3-5
Epidemiological studies have consistently found that mortality risk is greater for patients with ESKD and diabetes than for people with ESKD alone.6,7 However, there is evidence that the combination of type 2 diabetes and ESKD attributed to non-diabetic nephropathy is a distinct clinical entity of differential prognostic significance.8-10 In a European registry study of 15 419 patients with incident dialysis-treated ESKD, the overall mortality risk was 20% greater for patients with diabetes and diabetic nephropathy-related ESKD than for those with diabetes but not diabetic nephropathy-related ESKD.11
In a recent population cohort analysis of kidney transplant recipients, age modified the effect of diabetes status on cardiovascular disease and all-cause mortality; the association between diabetes status and higher mortality was more marked in younger than older kidney transplant recipients.12 However, this interaction has not been investigated with respect to cardiovascular disease-related and all-cause mortality of patients undergoing dialysis. As the number of patients with ESKD and type 2 diabetes is growing, accurate data on expected long term survival will be valuable for informing decisions about renal replacement therapy in patients with type 2 diabetes, with or without diabetic nephropathy.
The first aim of our study was to compare long term outcomes (cardiovascular disease-related and all-cause mortality) for patients with ESKD and type 2 diabetes, stratified by the presence or absence of diabetic nephropathy, with mortality outcomes for patients without diabetes when they commenced dialysis. Our second aim was to determine whether age affected the association between type 2 diabetes and mortality in patients with ESKD.
Methods
Study cohort
We analysed retrospective data from the Australia and New Zealand Dialysis and Transplant (ANZDATA) registry. Data for patients with incident ESKD commencing haemodialysis or peritoneal dialysis in Australia or New Zealand during 1980–2014 were included. Patients who had received dialysis for less than 30 days, who had undergone pre-emptive kidney transplantation, or who had type 1 diabetes were excluded. The exposure factor was diabetes status at the start of dialysis, categorised as no diabetes, type 2 diabetes with diabetic nephropathy as the cause of ESKD (diabetes/diabetic nephropathy), or type 2 diabetes with ESKD attributed to a cause other than diabetic nephropathy (diabetes/non-diabetic nephropathy). The classification of ESKD aetiology was based on the entry in the ANZDATA registry, submitted by the treating hospital in the ANZDATA survey form.13
Baseline characteristics
Baseline patient characteristics included age, sex, ethnic background, body mass index (BMI), primary cause of ESKD, prevalent cardiovascular disease, peripheral vascular disease and cerebrovascular disease, smoking history, year of dialysis commencement, and initial dialysis modality.
Clinical outcomes
The primary and secondary outcomes were respectively cardiovascular disease mortality and all-cause mortality. Data were censored at kidney transplantation, last follow-up, or 31 December 2014.
Statistical analyses
Baseline characteristics were expressed as numbers and proportions, means and standard deviations (SDs), or medians and interquartile ranges (IQRs). Proportions for baseline characteristics were compared pairwise in χ2 tests. Associations between diabetes status and mortality were examined in Cox proportional hazard regression analyses, and the results expressed as hazard ratios (HRs) with 95% confidence intervals (CIs). Proportional hazard assumptions were checked graphically for all Cox regression models by plotting the Schoenfeld residuals. Two-way interaction terms were examined for potential interactions between diabetes and other covariates. Covariates for which P < 0.1 in the unadjusted models were included in the adjusted models; age, ethnic background, and vascular diseases were included in all models because relationships of these factors with the outcomes are recognised. Cardiovascular disease-related and all-cause mortality rates for 0–5 years and 0–10 years from the start of dialysis and by diabetes status were calculated.
Competing risk regression analyses14 of cardiovascular disease-related and all-cause mortality were undertaken. The stratified proportional subdistribution HRs (SHRs) were calculated to estimate exposure and covariate effects on the cumulative incidence function, adjusted for the competing risk of kidney transplantation or other cause-specific mortality as appropriate. The covariates included in the Cox regression models were also included in the competing risk models.
All statistical analyses were conducted in SPSS 10 (SPSS) and Stata 11 (StataCorp). P < 0.05 and non-overlap of 95% CIs were deemed statistically significant.
Ethics approval
Formal research ethics approval was not required for our analysis of de-identified data. Australian and New Zealand patients with ESKD had previously consented to inclusion of their data in the ANZDATA registry.
Results
During 1980–2014, 56 552 patients with ESKD commenced dialysis; they were followed for a median 2.5 years (IQR, 1.1–4.8 years; total, 193 549 person-years). Of these patients, 15 829 (28.0%) had type 2 diabetes/diabetic nephropathy and 4993 (8.8%) type 2 diabetes/non-diabetic nephropathy. Compared with patients without diabetes, the mean age and BMI of patients with type 2 diabetes were higher, and the proportions of patients with prevalent vascular diseases or who were Indigenous Australians were greater than for people without diabetes. ESKD was attributed in 30.5% of patients with type 2 diabetes/non-diabetic nephropathy to glomerulonephritis (IgA nephropathy, 19.0%; focal segmental glomerulosclerosis, 14.5%; membranous nephropathy, 6.6%; membrano-proliferative glomerulonephritis, 5.1%; advanced or presumed glomerulonephritis, 40.0%), and in 27.5% of cases to vascular causes (Box 1).
The proportion of patients accepted for dialysis treatment with diabetes increased from 12.2% during 1980–1988 to 46.6% during 2007–2014 (P < 0.001). The proportions of patients with prevalent vascular diseases increased to a similar degree (cardiovascular disease, from 8.7% to 33.1%; peripheral vascular disease, from 4.3% to 17.3%; for each, P < 0.001).
Diabetes status and cardiovascular disease-related mortality
Cardiovascular disease-related mortality rates 0–5 and 0–10 years after commencing dialysis were higher for patients who had type 2 diabetes than for those who did not (Box 2). Cardiovascular disease-related mortality was significantly higher for patients with diabetes/diabetic nephropathy than for those with diabetes/non-diabetic nephropathy during the first 5 years of dialysis (226 [95% CI, 219–232] v 179 [95% CI, 168–190] cardiovascular disease deaths per 1000 patients) and during the first 10 years of dialysis (277 [95% CI, 270–284] v 220 [95% CI, 208–231] cardiovascular disease deaths per 1000 patients).
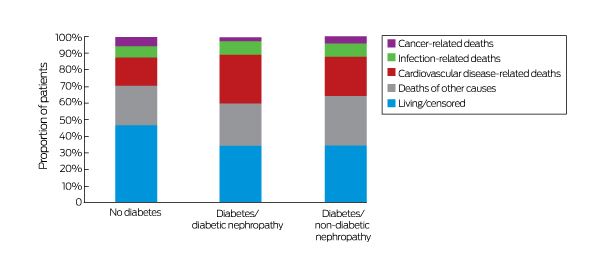
Patients with diabetes/diabetic nephropathy or diabetes/non-diabetic nephropathy were more likely than those without diabetes to die of cardiovascular disease-related causes. Of 35 730 patients without diabetes (followed for a median 2.5 years; IQR, 1.1–4.9 years), 6237 (17.5%) died of cardiovascular disease, 2362 (6.6%) of infection; of 15 829 patients with diabetes/diabetic nephropathy (followed for a median 2.7 years; IQR, 1.3–4.7 years), 4614 (29.1%) died of cardiovascular disease and 1330 (8.4%) of infection, while of 4993 patients with diabetes/non-diabetic nephropathy (followed for a median 2.5 years; IQR, 1.1–4.8 years), 1190 (23.8%) died of cardiovascular disease and 400 (8.0%) of infection. The proportions of cause-specific deaths according to diabetes status are depicted in Box 3.
Cardiovascular disease-related mortality was higher for patients with diabetes/diabetic nephropathy (adjusted HR [aHR], 1.63; 95% CI, 1.56–1.72) or diabetes/non-diabetic nephropathy (aHR, 1.31; 95% CI, 1.23–1.41) than for patients without type 2 diabetes (Box 4). Among patients with type 2 diabetes, cardiovascular disease mortality was higher for patients with diabetic nephropathy than for those with non-diabetic nephropathy (aHR, 1.25; 95% CI, 1.16–1.33) or with non-diabetic nephropathy and ESKD attributed to glomerulonephritis (1524 patients; aHR, 1.52; 95% CI, 1.35–1.72).
In the competing risk analysis, cardiovascular disease mortality was greater for patients with diabetes/diabetic nephropathy (adjusted SHR [aSHR], 1.51; 95% CI, 1.44–1.59) or diabetes/non-diabetic nephropathy (aSHR, 1.23; 95% CI, 1.15–1.31) than for patients without diabetes. Among patients with type 2 diabetes, cardiovascular disease mortality was higher for patients with diabetic nephropathy than for those with non-diabetic nephropathy (aSHR, 1.20; 95% CI, 1.12–1.28) or non-diabetic nephropathy attributed to glomerulonephritis (aSHR, 1.42; 95% CI, 1.27–1.60) (Box 4). Cumulative incidence curves for cardiovascular disease mortality, stratified by diabetes status and adjusted for the competing risk of non-cardiovascular disease-related mortality, are included in the online Appendix (figure 1A), as are cumulative incidence curves by diabetes status for infection- (figure 1B) and cancer-related mortality (figure 1C).
Diabetes status and all-cause mortality rates
All-cause mortality 0–5 and 0–10 years after commencing dialysis was higher for patients with type 2 diabetes than for those without diabetes; among patients with diabetes, the rates for were similar for those with or without diabetic nephropathy (Box 2).
All-cause mortality was higher for patients with diabetes/diabetic nephropathy (aHR, 1.40; 95% CI, 1.36–1.45) or diabetes/non-diabetic nephropathy (aHR, 1.24; 95% CI, 1.20–1.30) than for patients without type 2 diabetes (Box 4). Among patients with diabetes, all-cause mortality was higher for patients with diabetic nephropathy than for those with non-diabetic nephropathy (aHR, 1.13; 95% CI, 1.09–1.18) or those with non-diabetic nephropathy and ESKD attributed to glomerulonephritis (aHR, 1.29; 95% CI, 1.20–1.39).
In the competing risk analysis, all-cause mortality was greater for patients with type 2 diabetes than for those without diabetes (patients with diabetic nephropathy: aSHR, 1.54; 95% CI, 1.50–1.59; patients with non-diabetic nephropathy: aSHR, 1.34; 95% CI, 1.29–1.40) (Box 4). Among patients with type 2 diabetes, all-cause mortality was greater for patients with diabetic nephropathy than for those with non-diabetic nephropathy (aSHR, 1.17; 1. 95% CI, 10–1.22) or non-diabetic nephropathy attributed to glomerulonephritis (aSHR, 1.35; 95% CI, 1.25–1.44). Cumulative incidence curves for all-cause mortality, stratified by diabetes status and adjusted for the competing risk of kidney transplantation, are included in the online Appendix, figure 2.
Interaction of the effects of age and diabetes status on the risk of cardiovascular disease-related and all-cause mortality
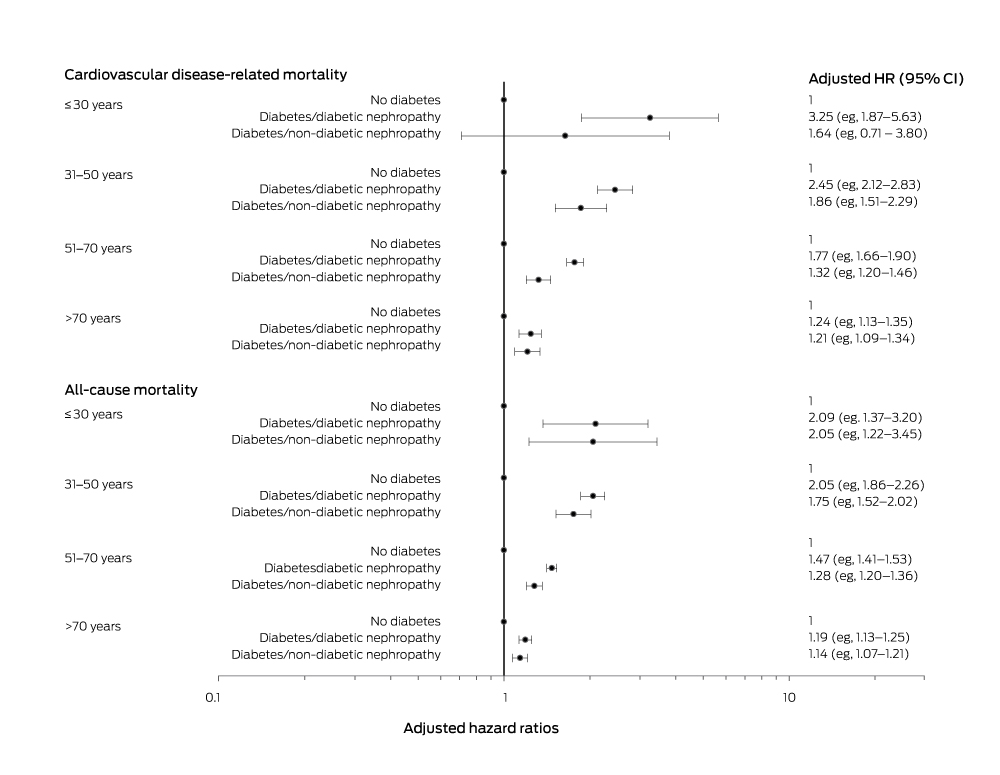
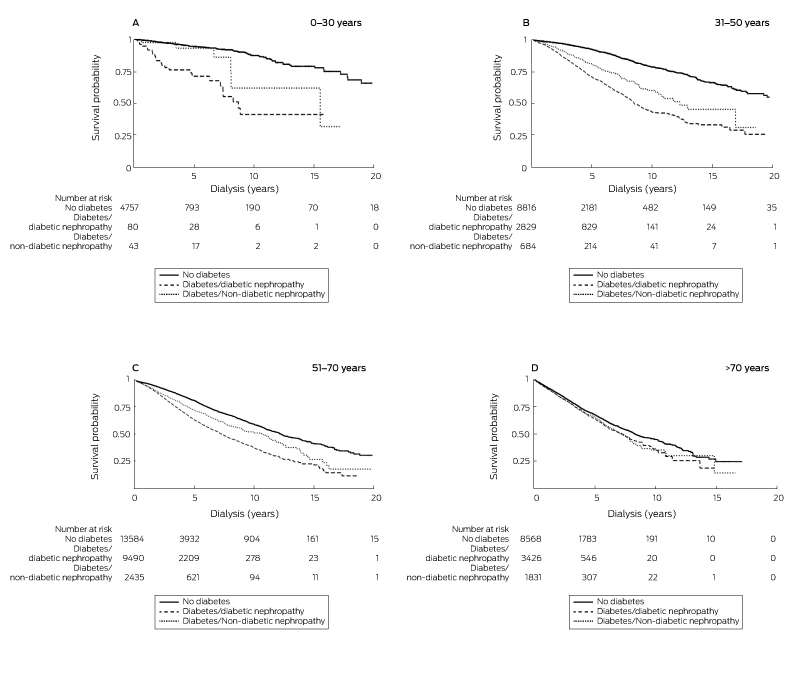
Patient age modified the association between diabetes status and cardiovascular disease-related mortality (for interaction, P < 0.001) and all-cause mortality (for interaction, P < 0.001) We therefore undertook age-specific sub-analyses (0–30 years, 31–50 years, 51–70 years, more than 70 years), and these indicated that cardiovascular disease-related and all-cause mortality were consistently higher for patients with type 2 diabetes than for patients without diabetes, particularly for patients aged 50 years or less with diabetic nephropathy (Box 5). Kaplan–Meier survival curves for cardiovascular disease mortality, stratified by diabetes status and age group, are depicted in Box 6. There were no consistent interactions of diabetes with era of dialysis commencement or ethnic background (data not shown).
Discussion
During 1980–2014, mortality for patients with ESKD and type 2 diabetes, regardless of whether ESKD was attributed to diabetic nephropathy or another cause, was greater than for patients with ESKD but not diabetes; the prognosis was poorest for patients with diabetes and diabetic nephropathy. More importantly, the magnitude of the excess risk for cardiovascular disease-related and all-cause mortality associated with diabetes was age-dependent; for patients under 30 years of age with type 2 diabetes and diabetic nephropathy, the mortality risk was more than double that for patients of the same age without diabetes, particularly cardiovascular disease-related mortality. In older patients, the difference was not as marked, but statistically significant.
An analysis of European Renal Association–European Dialysis and Transplant Association (ERA-EDTA) Registry data indicated that mortality risk was significantly higher for dialysis-dependent patients with diabetes as the cause of ESKD than for those with diabetes as a comorbid condition (aHR, 1.20; 95% CI, 1.10–1.30).11 In an earlier study by the same group — the Netherlands Cooperative Study on the Adequacy of Dialysis (NECOSAD; 1853 patients with ESKD, including 15% with diabetes with diabetic nephropathy and 6% with diabetes but without diabetic nephropathy) — mortality was significantly higher among patients with diabetes and diabetic nephropathy (aHR, 1.8; 95% CI, 1.3–2.4) and those with diabetes without diabetic nephropathy (aHR, 1.8; 95% CI, 1.5–2.3) than among patients without diabetes, but the mortality risk was similar for patients with diabetes/diabetic nephropathy and those with diabetes but without diabetic nephropathy (HR, 1.06; 95% CI, 0.79–1.43).15
In our study, all-cause mortality risk for patients with diabetes/diabetic nephropathy during the first 10 years of dialysis was 13% higher and cardiovascular disease-related mortality risk 25% higher than for patients with diabetes and ESKD attributed to another cause. It is likely that some of the differences between study findings are related to differences in cohort sizes, patient characteristics, follow-up periods, inclusion of patients with type 1 diabetes, ascertainment of ESKD cause, and classification of kidney transplantation as either a censored or competing event.
The association between the period in which dialysis was initiated and mortality was significant, independent of diabetes status, age, and ethnic background. Compared with patients accepted for dialysis treatment during 1980–1988, the mortality risk for those who commenced dialysis more recently was higher, perhaps reflecting the increasing proportion of patients with ESKD with diabetes and vascular disease.1,2 The absence of significant interaction between diabetes status and period in which dialysis started indicates that the effect of diabetes status on mortality has been consistent over time.
Epidemiological studies have established that longer duration of type 2 diabetes and its suboptimal control are each associated with a poorer prognosis — including progression to ESKD and increased vascular disease and all-cause mortality risks — both in the general population and among kidney transplant recipients.16-21 It is therefore likely that patients with type 2 diabetes and ESKD attributed to diabetic nephropathy comprise a clinical group in which diabetes is of longer duration or is poorly controlled. Our findings that the cardiovascular disease-related mortality risk is 25% higher for patients with diabetes/diabetic nephropathy than for those with diabetes/non-diabetic nephropathy, and that their burdens of coronary artery and peripheral vascular diseases were also marginally higher, are consistent with combinations of ESKD and type 2 diabetes, with and without diabetic nephropathy, being distinct clinical phenotypes. In patients with ESKD and diabetes, the cause of ESKD can be misclassified, particularly as diabetic nephropathy is often diagnosed according to clinical criteria, but this question cannot be explored in registry data. Nevertheless, evidence is growing that the combination of non-diabetic nephropathy as the cause of ESKD with type 2 diabetes as a comorbid condition constitutes a distinct clinical entity of potential differential prognostic significance.8-10
An influence of age on mortality among patients with type 2 diabetes generally and also specifically among kidney transplant recipients has been reported.13,22 The incidence of microvascular complications and the rate of cardiovascular disease-related mortality are generally greater for younger patients, raising the question of whether the higher rates of complications reflect a more aggressive phenotype or inadequate control of diabetes and other vascular disease risk factors.22,23 Our study corroborated these reports, finding an inverse relationship between the age of patients with type 2 diabetes and mortality risk; people aged 50 years or less with diabetes had two- to threefold greater risks of all-cause and cardiovascular disease-related mortality than patients of the same age without diabetes.
Limitations
Although we adjusted our analysis for several potential confounders, residual confounding by unmeasured factors is likely. Data on the duration, severity, and adequacy of management of diabetes (including types of anti-diabetes medication) and on vascular risk factors, each of which could modify the association between diabetes status and outcomes, were not collected by the ANZDATA registry. Further, the ANZDATA registry does not verify the reported cause of ESKD, so that misclassification bias is possible.
Conclusion
Cardiovascular disease-related and all-cause mortality are both higher among dialysis-dependent patients with type 2 diabetes than among patients without diabetes, particularly for those with ESKD attributed to diabetic nephropathy. The difference in survival was more marked for younger patients with ESKD and diabetes. Our findings suggest that combinations of ESKD and type 2 diabetes, with and without diabetic nephropathy, constitute distinct clinical entities or reflect a continuum of clinico-pathological severity of differential prognostic significance. Clinicians should be cognisant of the importance of closely monitoring and adequately managing the risk factors associated with mortality in these patients.
Box 1 – Baseline characteristics of 56 552 patients with incident end-stage kidney disease who commenced dialysis during 1980–2014, by type 2 diabetes mellitus status
|
|
No diabetes |
Type 2 diabetes with diabetic nephropathy |
Type 2 diabetes without diabetic nephropathy |
||||||||||||
|
|
|||||||||||||||
|
Total number of patients |
35 730 |
15 829 |
4993 |
||||||||||||
|
Age (years), mean (SD) |
54.7 (19.1) |
60.9 (11.3) |
64.6 (12.5) |
||||||||||||
|
Sex (men) |
21 271 (59.5%) |
9427 (59.6%) |
2953 (59.1%) |
||||||||||||
|
Ethnic background |
|
|
|
||||||||||||
|
White |
29 745 (83.2%) |
7389 (46.7%) |
3627 (72.6%) |
||||||||||||
|
Indigenous Australian |
2155 (6.0%) |
4978 (31.4%) |
735 (14.8%) |
||||||||||||
|
Other |
3830 (10.8%) |
3462 (21.9%) |
631 (12.6%) |
||||||||||||
|
Coronary artery disease |
7888 (22.4%) |
6673 (43.3%) |
2117 (42.8%) |
||||||||||||
|
Peripheral vascular disease |
3492 (9.9%) |
4784 (31.1%) |
1189 (24.1%) |
||||||||||||
|
Cerebrovascular disease |
2875 (8.1%) |
2231 (14.5%) |
781 (15.8%) |
||||||||||||
|
Body mass index (kg/m2), mean (SD) |
25.6 (6.0) |
30.3 (7.1) |
28.7 (7.2) |
||||||||||||
|
Dialysis type at initiation |
|
|
|
||||||||||||
|
Haemodialysis |
25 165 (70.4%) |
11 400 (72.0%) |
3827 (76.6%) |
||||||||||||
|
Peritoneal dialysis |
10 565 (29.6%) |
4429 (28.0%) |
1166 (23.4%) |
||||||||||||
|
Kidney transplantation |
13 686 (38.3%) |
961 (6.1%) |
458 (9.2%) |
||||||||||||
|
Smoking status |
|
|
|
||||||||||||
|
Non-smoker |
16 884 (47.3%) |
6609 (41.8%) |
2060 (41.3%) |
||||||||||||
|
Former smoker |
12 663 (35.4%) |
6628 (41.9%) |
2235 (44.8%) |
||||||||||||
|
Current smoker |
4486 (12.6%) |
2039 (12.9%) |
611 (12.2%) |
||||||||||||
|
Unknown/missing data |
1697 (4.7%) |
553 (3.4%) |
87 (1.7%) |
||||||||||||
|
Cause of end-stage kidney disease |
|
|
|
||||||||||||
|
Diabetes |
0 |
15 829 (100%) |
0 |
||||||||||||
|
Glomerulonephritis |
12 832 (35.9%) |
0 |
1524 (30.5%) |
||||||||||||
|
Vascular |
5912 (16.5%) |
0 |
1375 (27.5%) |
||||||||||||
|
Cystic |
3648 (10.2%) |
0 |
225 (4.5%) |
||||||||||||
|
Analgesic nephropathy |
1749 (4.9%) |
0 |
206 (4.1%) |
||||||||||||
|
Other |
8861 (24.8%) |
0 |
1047 (21.1%) |
||||||||||||
|
Unknown |
2728 (7.7%) |
0 |
616 (12.3%) |
||||||||||||
|
Year of commencement of dialysis |
|
|
|
||||||||||||
|
1980–1988 |
2545 (7.1%) |
288 (1.8%) |
67 (1.3%) |
||||||||||||
|
1989–1997 |
8564 (24.0%) |
1852 (11.7%) |
651 (13.1%) |
||||||||||||
|
1998–2006 |
12 692 (35.5%) |
5667 (35.8%) |
1886 (37.8%) |
||||||||||||
|
2007–2014 |
11 929 (33.4%) |
8022 (50.7%) |
2389 (47.8%) |
||||||||||||
|
|
|||||||||||||||
|
SD = standard deviation. |
|||||||||||||||
Box 2 – Mortality rates for patients with end-stage kidney disease, by type 2 diabetes mellitus status and time since initiation of dialysis
|
|
Mortality rate (per 1000 patients) (95% CI) |
||||||||||||||
|
No diabetes |
Type 2 diabetes with diabetic nephropathy |
Type 2 diabetes with non-diabetic nephropathy |
|||||||||||||
|
|
|||||||||||||||
|
Cardiovascular disease-related mortality |
|||||||||||||||
|
0–5 years |
103 (100–107) |
226 (219–232) |
179 (168–190) |
||||||||||||
|
0–10 years |
136 (133–140) |
277 (270–284) |
220 (208–231) |
||||||||||||
|
All-cause mortality |
|||||||||||||||
|
0–5 years |
305 (300–310) |
490 (482–498) |
487 (473–501) |
||||||||||||
|
0–10 years |
400 (395–405) |
608 (600–616) |
601 (588–615) |
||||||||||||
|
|
|||||||||||||||
|
CI = confidence interval. |
|||||||||||||||
Box 3 – Cause-specific deaths of patients with end-stage kidney disease, by type 2 diabetes mellitus status
Total deaths: no diabetes, 15 266 of 35 730 patients (42.7%); diabetes/diabetic nephropathy, 9852 of 15 829 patients (62.2%); diabetes/non-diabetic nephropathy, 3096 of 4993 patients (62.0%).
Box 4 – Cox regression and competing risk analyses of cardiovascular disease-related and all-cause mortality among patients with incident end-stage kidney disease who commenced dialysis during 1980–2014
|
|
Cox regression:* adjusted HR (95% CI) |
Competing risk:† adjusted SHR (95% CI) |
|||||||||||||
|
|
|||||||||||||||
|
Cardiovascular disease-related mortality |
|||||||||||||||
|
Diabetes status |
|
|
|||||||||||||
|
No diabetes |
1 |
1 |
|||||||||||||
|
Type 2 diabetes/diabetic nephropathy |
1.63 (1.56–1.72) |
1.51 (1.44–1.59) |
|||||||||||||
|
Type 2 diabetes/non-diabetic nephropathy |
1.31 (1.23–1.41) |
1.23 (1.15–1.31) |
|||||||||||||
|
Age (per 10-year increase) |
1.35 (1.32–1.37) |
1.19 (1.17–1.21) |
|||||||||||||
|
Coronary artery disease |
1.70 (1.63–1.78) |
1.63 (1.56–1.71) |
|||||||||||||
|
Peripheral vascular disease |
1.31 (1.25–1.37) |
1.12 (1.07–1.18) |
|||||||||||||
|
Cerebrovascular accident |
1.10 (1.04–1.17) |
0.95 (0.91–1.02) |
|||||||||||||
|
Ethnic background |
|
|
|||||||||||||
|
White |
1 |
1 |
|||||||||||||
|
Indigenous Australian |
1.63 (1.54–1.72) |
1.61 (1.52–1.71) |
|||||||||||||
|
Other |
0.85 (0.80–0.90) |
0.98 (0.92–1.04) |
|||||||||||||
|
Sex (women) |
1.12 (1.08–1.17) |
1.15 (1.11–1.20) |
|||||||||||||
|
Haemodialysis (v peritoneal dialysis) |
1.12 (1.07–1.17) |
1.06 (1.03–1.11) |
|||||||||||||
|
Body mass index (kg/m2) |
|
|
|||||||||||||
|
< 18.5 |
1.26 (1.13–1.41) |
1.05 (0.94–1.18) |
|||||||||||||
|
18.5 to < 25 |
1 |
1 |
|||||||||||||
|
25 to < 30 |
0.94 (0.90–0.99) |
1.03 (0.98–1.08) |
|||||||||||||
|
≥ 30 |
1.04 (0.99–1.10) |
1.15 (1.09–1.21) |
|||||||||||||
|
Dialysis commencement |
|
|
|||||||||||||
|
1980–1988 |
1 |
1 |
|||||||||||||
|
1989–1997 |
3.29 (2.37–4.58) |
2.32 (1.73–3.12) |
|||||||||||||
|
1998–2006 |
2.22 (1.59–3.08) |
1.58 (1.18–2.13) |
|||||||||||||
|
2007–2014 |
1.45 (1.04–2.02) |
0.92 (0.67–1.22) |
|||||||||||||
|
All-cause mortality |
|
|
|||||||||||||
|
Diabetes status |
|
|
|||||||||||||
|
No diabetes |
1 |
1 |
|||||||||||||
|
Type 2 diabetes/diabetic nephropathy |
1.40 (1.36–1.45) |
1.54 (1.50–1.59) |
|||||||||||||
|
Type 2 diabetes/non-diabetic nephropathy |
1.24 (1.20–1.30) |
1.34 (1.29–1.40) |
|||||||||||||
|
Age (per 10-year increase) |
1.48 (1.46–1.49) |
1.74 (1.72–1.76) |
|||||||||||||
|
Coronary artery disease |
1.28 (1.25–1.32) |
1.38 (1.34–1.41) |
|||||||||||||
|
Peripheral vascular disease |
1.34 (1.30–1.38) |
1.43 (1.39–1.48) |
|||||||||||||
|
Cerebrovascular accident |
1.23 (1.19–1.28) |
1.24 (1.20–1.32) |
|||||||||||||
|
Ethnic background |
|
|
|||||||||||||
|
White |
1 |
1 |
|||||||||||||
|
Indigenous Australian |
1.33 (1.28–1.38) |
1.65 (1.59–1.72) |
|||||||||||||
|
Other |
0.73 (0.70–0.77) |
0.81 (0.78–0.84) |
|||||||||||||
|
Sex (women) |
0.97 (0.95–0.99) |
0.92 (0.90–0.95) |
|||||||||||||
|
Haemodialysis (v peritoneal dialysis) |
1.06 (1.03–1.09) |
1.01 (0.98–1.05) |
|||||||||||||
|
Body mass index (kg/m2) |
|
|
|||||||||||||
|
< 18.5 |
1.42 (1.34–1.51) |
1.43 (1.34–1.53) |
|||||||||||||
|
18.5 to < 25 |
1 |
1 |
|||||||||||||
|
25 to < 30 |
0.87 (0.84–0.89) |
0.87 (0.84–0.89) |
|||||||||||||
|
≥ 30 |
0.87 (0.84–0.90) |
0.92 (0.89–0.95) |
|||||||||||||
|
Dialysis commencement |
|
|
|||||||||||||
|
1980–1988 |
1 |
1 |
|||||||||||||
|
1989–1997 |
3.11 (2.53–3.82) |
3.20 (2.76–3.71) |
|||||||||||||
|
1998–2006 |
2.52 (2.05–3.09) |
2.53 (2.18–2.93) |
|||||||||||||
|
2007–2014 |
2.01 (1.64–2.47) |
1.72 (1.48–2.00) |
|||||||||||||
|
|
|||||||||||||||
|
CI = confidence interval; HR = hazard ratio; SHR = subdistribution hazard ratio. * Censored for transplantation. † Transplantation as a competing event. |
|||||||||||||||
Box 5 – Cardiovascular disease-related and all-cause mortality among patients with incident end-stage kidney disease who commenced dialysis during 1980–2014, by type 2 diabetes status and age group*
CI = confidence interval; HR = hazard ratio. * Adjusted for ethnic background, era in which dialysis commenced, prevalent vascular diseases, sex, body mass index, and initial dialysis modality.
Received 20 February 2018, accepted 15 August 2018
- Wai H Lim1,2
- David W Johnson3,4
- Carmel Hawley3
- Charmaine Lok5
- Kevan R Polkinghorne6
- Matthew A Roberts7
- Neil Boudville2
- Germaine Wong8,9
- 1 Sir Charles Gairdner Hospital, Perth, WA
- 2 University of Western Australia, Perth, WA
- 3 Princess Alexandra Hospital, Brisbane, QLD
- 4 Centre for Health Services Research, University of Queensland, Brisbane, QLD
- 5 Toronto General Hospital, Toronto, Canada
- 6 Monash Medical Centre, Melbourne, VIC
- 7 Eastern Health Clinical School, Monash University, Melbourne, VIC
- 8 Westmead Hospital, Sydney, NSW
- 9 University of Sydney, Sydney, NSW
We gratefully acknowledge the substantial contributions of the Australian and New Zealand nephrology community (physicians, surgeons, database managers, nurses, renal operators, and patients) who provide information to and maintain the ANZDATA database. The data reported here were supplied by ANZDATA.
No relevant disclosures.
- 1. Australia and New Zealand Dialysis and Transplant Registry. Incidence of end stage kidney disease. In: Clayton P, ed. ANZDATA Registry: 39th annual report. Adelaide: ANZDATA, 2016. http://www.anzdata.org.au/anzdata/AnzdataReport/39thReport/c01_incidence_v5.0_20170418.pdf (viewed Aug 2018).
- 2. Excell L, McDonald S. New patients commencing treatment in 2003. In: Excell L, McDonald S, eds. Australia and New Zealand Dialysis and Transplant Registry, 27th report. Adelaide: ANZDATA, 2004. http://www.anzdata.org.au/anzdata/AnzdataReport/27thReport/files/Ch02NewPatients.pdf (viewed Aug 2018).
- 3. Australia and New Zealand Dialysis and Transplant Registry. Incidence of end stage kidney disease. In: Clayton P, ed. ANZDATA Registry: 37th annual report. Adelaide: ANZDATA, 2014. http://www.anzdata.org.au/anzdata/AnzdataReport/37thReport/c01_incidence_print_20150929.pdf (viewed Aug 2018).
- 4. McDonald S, Russ G. New patients commencing treatment in 2001. In: McDonald S, Russ G, eds. Australia and New Zealand Dialysis and Transplant Registry, 25th report. Adelaide: ANZDATA, 2002. http://www.anzdata.org.au/anzdata/AnzdataReport/25thReport/files/Ch.02%20New%20Patients%202001.zip (viewed Aug 2018).
- 5. Chapman J, Wright J. Transplant waiting list. In: Clayton P, Hurst K, eds. Australia and New Zealand Dialysis and Transplant Registry, 37th annual report. Adelaide: ANZDATA, 2014. http://www.anzdata.org.au/anzdata/AnzdataReport/37thReport/c07_waitinglist_print_20150929.pdf (viewed Aug 2018).
- 6. van Diepen M, Schroijen MA, Dekkers OM, et al. Predicting mortality in patients with diabetes starting dialysis. PLoS One 2014; 9: e89744.
- 7. Chantrel F, Enache I, Bouiller M, et al. Abysmal prognosis of patients with type 2 diabetes entering dialysis. Nephrol Dial Transplant 1999; 14: 129-136.
- 8. Haneda M, Utsunomiya K, Koya D, et al. A new Classification of Diabetic Nephropathy 2014: a report from Joint Committee on Diabetic Nephropathy. J Diabetes Investig 2015; 6: 242-246.
- 9. Soni SS, Gowrishankar S, Kishan AG, et al. Non-diabetic renal disease in type 2 diabetes mellitus. Nephrology (Carlton) 2006; 11: 533-537.
- 10. Oh SW, Kim S, Na KY, et al. Clinical implications of pathologic diagnosis and classification for diabetic nephropathy. Diabetes Res Clin Pract 2012; 97: 418-424.
- 11. Schroijen M, van de Luijtgaarden M, Noordzij M, et al. Survival in dialysis patients is different between patients with diabetes as primary renal disease and patients with diabetes as a co-morbid condition. Diabetologia 2013; 56: 1949-1957.
- 12. Lim WH, Wong G, Pilmore HL, et al. Long-term outcomes of kidney transplantation in people with type 2 diabetes: a population cohort study. Lancet Diabetes Endocrinol 2017; 5: 26-33.
- 13. Australia and New Zealand Dialysis and Transplant Registry. Dialysis and transplant survey. Updated Dec 2017. http://www.anzdata.org.au/forms/ANZDATA/ANZDATADialysisAndTransplantSurvey2017.pdf (viewed Aug 2018).
- 14. Fine JP, Gray RJ. A proportional hazards model for the subdistribution of a competing risk. J Am Stat Assoc 1999; 94: 496-509.
- 15. Schroijen MA, Dekkers OM, Grootendorst DC, et al. Survival in dialysis patients is not different between patients with diabetes as primary renal disease and patients with diabetes as a co-morbid condition. BMC Nephrol 2011; 12: 69.
- 16. Molnar MZ, Huang E, Hoshino J, et al. Association of pretransplant glycemic control with posttransplant outcomes in diabetic kidney transplant recipients. Diabetes Care 2011; 34: 2536-2541.
- 17. Brun E, Nelson RG, Bennett PH, et al. Diabetes duration and cause-specific mortality in the Verona Diabetes Study. Diabetes Care 2000; 23: 1119-1123.
- 18. Huang ES, Laiteerapong N, Liu JY, et al. Rates of complications and mortality in older patients with diabetes mellitus: the diabetes and aging study. JAMA Intern Med 2014; 174: 251-258.
- 19. Rossing K, Christensen PK, Hovind P, et al. Progression of nephropathy in type 2 diabetic patients. Kidney Int 2004; 66: 1596-1605.
- 20. Andrésdóttir G, Jensen ML, Carstensen B, et al. Improved survival and renal prognosis of patients with type 2 diabetes and nephropathy with improved control of risk factors. Diabetes Care 2014; 37: 1660-1667.
- 21. American Diabetes Association. Peripheral arterial disease in people with diabetes. Diabetes Care 2003; 26: 3333-3341.
- 22. Tancredi M, Rosengren A, Svensson AM, et al. Excess mortality among persons with type 2 diabetes. N Engl J Med 2015; 373: 1720-1732.
- 23. Al-Saeed AH, Constantino MI, Molyneaux L, et al. An inverse relationship between age of type 2 diabetes onset and complication risk and mortality: the impact of youth-onset type 2 diabetes. Diabetes Care 2016; 39: 823-829.
Abstract
Objectives: To examine the association between type 2 diabetes mellitus, with and without diabetic nephropathy, and cardiovascular disease-related mortality in dialysis-dependent patients with end-stage kidney disease (ESKD); to determine whether this association is affected by the age of the patient.
Design, setting, participants: Prospective population cohort analysis of Australia and New Zealand Dialysis and Transplant Registry data for all patients with incident ESKD who commenced dialysis in Australia or New Zealand during 1980–2014.
Outcome measures: Primary outcome: cardiovascular disease-related mortality; secondary outcome: all-cause mortality.
Results: Of 56 552 patients followed for a median 2.5 years (total, 193 549 person-years), 15 829 (28.0%) had type 2 diabetes and diabetic nephropathy; 4993 (8.8%) had type 2 diabetes and non-diabetic nephropathy. Cardiovascular disease-related mortality during the first 10 years of dialysis was significantly higher for patients with diabetes/diabetic nephropathy (277 deaths per 1000 patients; 95% CI, 270–284) or diabetes/non-diabetic nephropathy (220 deaths per 1000 patients; 95% CI, 208–231) than for patients without type 2 diabetes (136 deaths per 1000 patients; 95% CI, 133–140). The risk of cardiovascular disease-related mortality was greater for patients with diabetes/diabetic nephropathy (adjusted hazard ratio [aHR], 1.63; 95% CI, 1.56–1.72) or diabetes/non-diabetic nephropathy (aHR, 1.31; 95% CI, 1.23–1.41) than for patients without diabetes. The excess risk associated with having diabetes was greater for younger than for older patients.
Conclusions: Mortality risk is higher for patients with incident ESKD commencing dialysis who also have type 2 diabetes than for patients without diabetes, particularly among patients under 50 years of age, and the risk was more pronounced in patients for whom ESKD was attributed to diabetic nephropathy.