


The known Rates of early re-admission and death after hospitalisation for heart failure are high.
The new Significant differences in 30- and 90-day re-admission rates after hospitalisation for heart failure are largely related to differences in post-discharge disease management. Nurse-led disease management programs combined with 7-day review or an exercise program were particularly effective in reducing re-admission rates, but not mortality.
The implications Differences in short term outcomes after hospitalisation for heart failure are related to differences in post-discharge management. Outcomes could be improved by adopting a uniform national policy for assisting patients after their release from hospital.
Heart failure (HF) is a major public health problem and is a leading cause of death, hospitalisation, and re-hospitalisation for adults over 65.1-3 Although hospitalisation rates for HF have declined with improvements in therapy and the management of risk factors,4 re-admission rates have been stable over the past decade.3 Repeated hospitalisation for HF is not only associated with reduced quality of life and increased risk of mortality, but is also a serious health economic problem. Thirty-day mortality and re-admission rates after an index admission for HF have recently been identified as major focuses for quality improvement and payment reform in the United States.5
In Australia, about 30 000 people are diagnosed with HF each year, and the annual costs for HF re-admissions exceed $1 billion.6 Rates of short term re-admission or death after HF remain high in Western countries (20–30% within 30 days of discharge).7-9 A variety of clinical and non-clinical factors can lead to a re-admission.10,11 Management programs — including home-based disease management programs, early re-assessment after discharge, and exercise programs — may reduce HF re-admission rates,12-14 but are not available for all patients.
We examined whether enrolment of patients in management programs after hospitalisation for HF reduces the likelihood of post-hospital adverse outcomes.
Methods
Study population
This prospective study included data for 906 consecutively recruited patients hospitalised for HF during 2014–2017 in six referral hospitals in five Australian states (Queensland [hospital A], South Australia [B], New South Wales [C], Victoria [D], Tasmania [E, F]). The hospitals were selected because of their expertise and their role in regional care for patients with HF. All had high level cardiology services, including coronary care units, non-invasive cardiac imaging (echocardiography and nuclear imaging), percutaneous intervention, and pacing and device therapy; all but one provided cardiac surgery. Patients were identified by a confirmed admission diagnosis of HF according to Australian guidelines.15
Data were collected by a study nurse. Patients were excluded if they were under 18 years of age or unable to provide written consent, or had moderate or worse primary mitral or aortic valve disease, concomitant unstable angina or acute myocardial infarction, cardiac device malfunction, endocarditis, a left ventricular assist device, potentially reversible left ventricular dysfunction (including dysfunction caused by post partum or alcoholic cardiomyopathy or by hyperthyroidism), or concomitant terminal non-cardiac illnesses that could influence the 12-month prognosis.
Clinical data
Clinical data were recorded before discharge as previously described.16 The physiologic severity of HF was defined by two-dimensional echocardiography, using standard techniques and procedures according to American Society of Echocardiography guidelines.17 Comorbidity was measured with the Charlson score.18 Patients’ cognitive function was assessed by trained personnel before discharge with the Montreal Cognitive Assessment (MoCA).19
Non-clinical data
Non-clinical data included social determinants of health (language background, marital status, living alone, education, residential address), medical insurance, and provision of home health care services. Socio-economic status was based on the Australian Bureau of Statistics Index of Relative Socioeconomic Disadvantage for residential postcode.20 The remoteness index reflects the distance by road of a locality from service towns of different sizes.21
Systematic approaches to averting re-admission
Transition care arrangements and medication reconciliation are widely performed in all states, so we focused on three other management processes:
-
Home-based disease management programs (DMPs): including optimisation of drug titration, intensive patient education, post-discharge follow-up to facilitate early recognition of problems, and identification and management of comorbidities;
-
Early re-assessment after discharge: a visit by a cardiologist, general practitioner, or HF nurse within 7 days of discharge;
-
Exercise programs: exercise guidance in or outside the hospital.
Although participation in these programs is influenced by the preference of patients and their treating physicians, it is largely determined by variations in the accessibility of services.
Outcomes
Patients were followed up at 30 and 90 days after discharge to determine rates of all-cause re-admissions and of death.
Statistical analyses
We report categorical variables as numbers of patients and percentages, and continuous variables as means with standard deviations (SDs). Because echocardiographic data were missing for 135 patients (about 15% of the sample), we undertook a sensitivity analysis restricted to those who had an echocardiographic examination before discharge. Odds ratios were estimated by logistic regression. All analyses were performed in Stata 12.0 (StataCorp).
Ethics approval
The study was approved by the Tasmanian Health and Medical Human Research Ethics Committee (reference, H0012445). All patients provided written consent for their inclusion in the study.
Results
Clinical characteristics
The mean age of patients was 72.5 years (SD, 13.9 years); by site, it ranged between 62.9 years (SD, 15.7 years) at hospital C and 77.3 years (SD, 12.0 years) at hospital E. The proportion of male patients was 58%, ranging between 48% (hospital F) and 72% (hospitals A and C). Mean length of stay in hospital was 9.9 days (SD, 12.4 days), and ranged from 7.2 days (SD, 8.9 days) for hospital E to 14.5 days (SD, 12. 8 days) for hospital D. Severity of HF (New York Heart Association [NYHA] class), the proportions of patients with reduced left ventricular ejection fraction, and the numbers of comorbidities also differed significantly between hospitals, reflecting the heterogeneity of the HF patients at the six hospitals (Box 1).
Post-discharge management of patients hospitalised for heart failure
HF medication prescribing differed between hospitals, but differences in the use of management programs for averting early re-admissions were more marked. While 74% of patients in hospital A were enrolled in a nurse-led DMP, 11–13% of patients in hospitals C, E and F were enrolled in such programs; 41–44% of patients in hospitals A, B and D were reviewed within 7 days of discharge, compared with 13–15% for the other three hospitals. Enrolment in an exercise program was the least frequently used management program (10% of all patients) (Box 1).
Features associated with re-admission of patients diagnosed with heart failure
Significant predictors of adverse outcomes at 30 days and 90 days were similar, but the magnitudes of their effects were generally smaller at 90 days. The odds of death were increased by greater age at admission, smoking, greater remoteness, and longer hospital stay, and at 90 days also by greater right atrial pressure and atrial fibrillation. The odds of re-admission were increased by greater right atrial pressure and atrial fibrillation, and at 90 days also by dyslipidaemia; the odds of both were increased by living alone (30 days only), cognitive impairment, depression, and higher NYHA classification, left atrial volume index, and Charlson index score. The odds for both outcomes were significantly reduced at 30 days by β-blocker use, as were the odds of death at 90 days (Box 2).
Nurse-led DMPs and reviews within 7 days, but not exercise, were each associated with reduced odds of re-admission at 30 days; all three programs were associated with reduced odds of re-admission at 90 days. The odds of re-admission by 30 days were lowest for a combination of DMP and review within 7 days. All program combinations were effective for reducing the re-admission rate at 90 days, with larger reductions for those including an exercise program (Box 3). Enrolment in multiple programs was associated with reduced odds of re-admission at 30 and 90 days; these associations remained significant after adjusting for clinical and non-clinical factors (Box 4).
Eighty-two patients (9%) had died by 30 days and 160 patients (18%) by 90 days after discharge. There were no significant relationships between program types (Box 3) or numbers of programs (Box 4) and numbers of deaths at either 30 or 90 days.
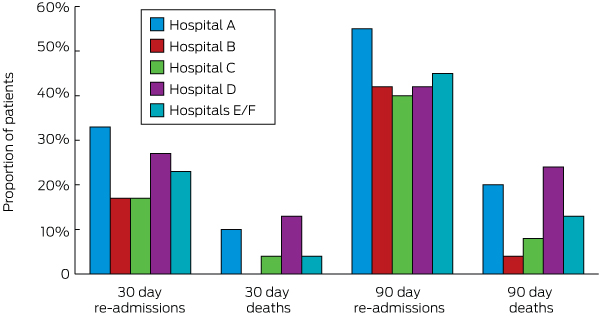
Inter-hospital differences in outcomes
The highest re-admission rates (33% at 30 days, 55% at 90 days) were at hospital C, the lowest (17% and 40% respectively) at hospital B. The highest mortality at 30 days (13%) and 90 days (24%) were at hospitals E and F, the lowest (0% and 4% respectively) at hospital A (Box 5).
In analyses of contributors to between-hospital differences in adverse outcomes, three hospital groups (A/B, C/D, E/F) were defined according to the proportions of patients receiving at least one post-discharge management program (75% in hospital A [35 of 47], 60% in hospital B [135 of 228], 47% in hospital D [33 of 71], 41% in hospital C [30 of 72], 25% in hospital E [75 of 304], 20% in hospital F [36 of 184). In logistic regression model 1, in which differences in outcome rates were adjusted for clinical and non-clinical predictors of HF complications, 30-day and 90-day re-admission rates for patients differed significantly between hospital groups (except E/F v A/B at 90 days). After also adjusting for the number of management programs employed (model 2), the differences were no longer significant. The results of analyses restricted to the 771 patients who underwent echocardiography were similar (data not shown), but further adjustment for left atrial volume index and right atrial pressure removed the residual differences in re-admission rates between hospitals (model 3) (Box 6).
After accounting for clinical and non-clinical factors, there were significant differences between hospital pairs in death rates at 30 and 90 days (but not C/D v A/B). Unlike re-admissions, these differences in mortality were only marginally reduced by adjusting for management programs. The results of analyses restricted to patients who underwent echocardiography were similar (data not shown), and further adjustment for left atrial volume index and right atrial pressure abolished the differences between sites (Box 6).
Discussion
In an analysis of short term adverse outcomes for an Australia-wide sample of patients hospitalised for HF, we found that the odds of re-admission to hospital (but not of death) were influenced by enrolment in post-discharge clinical programs for reducing re-admission rates. The odds of 30-day re-admission were reduced by a DMP or review within 7 days but not by an exercise program, whereas 90-day re-admission rates were reduced by all three management programs, and particularly by combinations of programs that included exercise. The magnitude of the differences in 30-day re-admission rates between hospitals was greater than that for 90-day re-admissions. While differences for 30-day re-admissions were partially explained by differences in systematic approaches to preventing short term re-admissions and in echocardiography findings, variations in 90-day re-admissions were largely attributable to management programs for averting re-admissions. Between-hospital variations in 30- and 90-day mortality were largely explained by differences in echocardiographic findings, and were not affected by post-discharge programs.
Differences in re-admission rates at 30 and 90 days
Early re-admission after discharge from hospital is often considered to indicate incomplete treatment in hospital, poor communication of discharge plans, or inadequate transition care. Earlier findings have suggested that patients with HF are most vulnerable early in the transition from inpatient to outpatient care.22 Effective early follow-up allows early assessment of progress, may improve patients’ ability to care for themselves, and may prevent any outstanding or emerging problems from developing into more serious events. DMP and review within 7 days are implemented during this window of opportunity, and we found their effects to be greatest for reducing the number of re-admissions within 30 days of discharge. Our findings suggest that continued vigilance is needed to reduce the risk of re-admission in the longer term.
Exercise training
Although the benefits of exercise for patients after treatment for HF are well established, it remains unclear whether it reduces the likelihood of re-admission. A recent Cochrane review of 33 randomised clinical trials (including 4740 patients with HF, most with reduced left ventricular ejection fractions) found that enrolment in an exercise program reduced all-cause and HF-specific hospitalisation rates and improved quality of life.23 Other studies of patients with preserved left ventricular ejection fractions also found that exercise improved quality of life and exercise tolerance.24 However, these studies have all investigated stable, ambulatory patients with HF.
Our findings suggest that exercise may reduce the risk of re-admission after hospitalisation for HF, albeit for intermediate (90-day) rather than short term (30-day) re-admissions. These findings are at variance with those of a recently published randomised trial in Queensland.25 Exercise is usually recommended for stable patients after HF,26 but only 10% of patients in our sample received an exercise program. We suspect that these exercise programs were implemented later rather than early in the transition phase. Moreover, it takes time for patients to improve their cardiorespiratory fitness sufficiently to be able to perform daily activities with less dyspnoea and fatigue.
Between-hospital differences in re-admission rates
Our results indicate that participation in different HF programs is associated with differences in the frequency of re-admissions. Indeed, while variations in 30-day re-admissions were explained by differences in physiological findings and program participation, the variations in 90-day re-admission rates were mostly explained by differences in program participation. A recent study of more than three million patients from 4767 hospitals found that the risk of first re-admission had declined by 50% at 38 days after discharge, and by 95% 7 weeks after discharge.27 The likelihood of re-admission during this later period may depend on an effective DMP and frequent follow-up for re-assessment.
However, in addition to these patient-level findings, our data indicate that differences between hospitals in re-admission rates are largely explained by differences in systematic post-discharge management approaches. Potential confounders in such an analysis include demographic features of the hospital referral base (age, socio-economic status, remoteness), and differences in hospital HF management protocols. However, national HF management guidelines are widely followed.
Strengths and limitations
We have described a prospective audit of the outcomes of 906 admissions for HF in Australia. The geographic dispersion of our sample allowed us to investigate differences in HF outcomes between hospitals in different states, favouring the generalisability of our findings. The prospective nature of our study allowed us to assess a wide range of potential predictors and to avoid the known limitations of using administrative codes in retrospective studies. Our sample, however, was relatively small in the context of describing HF health services, and our findings may have been confounded by differences in service delivery.
Clinical implications
HF is a chronic disease, the course of which is punctuated by frequent relapses that frequently lead to hospital admission. While some hospitalisations may be attributable to disease progression, many result from failure to adhere to appropriate management and are therefore potentially avoidable. This remains an important topic in Australia: national rates of short term re-admission and death after HF remain high,10,11 and hospital re-admission is generally a significant contributor to overall costs, although frequently viewed from the perspective of unplanned admissions after surgery.28 The inter-hospital differences we found in the outcomes of one of the most frequent indications for admission and re-admission to hospitals in Australia support the call by the National Heart Foundation for a systematic approach to chronic HF care based on a uniform model of care, the publication of relevant data for management and benchmarking, workforce planning, and research.29
Conclusions
The likelihood of re-admission after hospitalisation for HF varies between hospitals according to differences in the enrolment of patients in programs for averting re-admission. The inverse association between re-admission and HF management programs we describe may help guide the allocation of resources for responding to this problem.
Box 1 – Baseline characteristics of patients diagnosed with heart failure, by participating hospital
|
|
Hospital |
|
|||||||||||||
|
All hospitals |
A |
B |
C |
D |
E |
F |
P* |
||||||||
|
|
|||||||||||||||
|
Number of patients |
906 |
47 |
228 |
72 |
71 |
304 |
184 |
|
|||||||
|
Age at admission (years), mean (SD) |
72.5 (13.9) |
67.7 (15.7) |
70.8 (15.0) |
62.9 (15.7) |
68.9 (15.4) |
77.3 (12.0) |
75.4 (11.2) |
< 0.001 |
|||||||
|
Sex (men) |
525 (58%) |
34 (72%) |
147 (65%) |
52 (72%) |
43 (60%) |
161 (53%) |
88 (48%) |
< 0.001 |
|||||||
|
Living alone |
311 (34%) |
9 (19%) |
73 (32%) |
23 (32%) |
26 (37%) |
119 (39%) |
72 (39%) |
0.46 |
|||||||
|
Private health cover |
176 (19%) |
1 (2%) |
38 (17%) |
13 (18%) |
17 (24%) |
58 (19%) |
46 (25%) |
< 0.001 |
|||||||
|
Length of hospital stay (days), mean (SD) |
9.9 (12.4) |
8.5 (10.0) |
8.7 (6.4) |
9.5 (12.9) |
14.5 (12.8) |
7.2 (8.9) |
13.2 (19.3) |
0.014 |
|||||||
|
NYHA class |
|
|
|
|
|
|
|
< 0.001 |
|||||||
|
I–II |
384 (42%) |
37 (79%) |
57 (25%) |
45 (63%) |
35 (50%) |
109 (36%) |
86 (47%) |
|
|||||||
|
III |
335 (37%) |
7 (15%) |
105 (46%) |
24 (33%) |
28 (39%) |
122 (40%) |
57 (31%) |
|
|||||||
|
IV |
187 (21%) |
3 (6%) |
66 (29%) |
3 (4%) |
8 (11%) |
73 (24%) |
40 (22%) |
|
|||||||
|
LVEF (%), mean (SD) |
38 (16) |
34 (16) |
39 (16) |
30 (16) |
42 (16) |
41 (16) |
37 (17) |
< 0.001 |
|||||||
|
LVEF < 40% |
486 (54%) |
29 (62%) |
128 (56%) |
54 (76%) |
29 (41%) |
131 (43%) |
110 (60%) |
0.003 |
|||||||
|
Comorbidities |
|
|
|
|
|
|
|
|
|||||||
|
Hypertension |
642 (71%) |
39 (83%) |
139 (61%) |
35 (49%) |
49 (70%) |
237 (78%) |
142 (77%) |
0.003 |
|||||||
|
Dyslipidaemia |
475 (52%) |
34 (72%) |
119 (52%) |
37 (51%) |
46 (63%) |
149 (49%) |
92 (50%) |
0.06 |
|||||||
|
Atrial fibrillation |
433 (48%) |
24 (51%) |
120 (53%) |
31 (43%) |
38 (54%) |
137 (45%) |
83 (45%) |
0.15 |
|||||||
|
Diabetes |
351 (39%) |
19 (40%) |
94 (41%) |
23 (32%) |
40 (57%) |
118 (39%) |
59 (32%) |
< 0.001 |
|||||||
|
Charlson index score, mean (SD) |
7.1 (2.6) |
6.8 (3.1) |
6.6 (2.5) |
6.3 (3.2) |
7.8 (3.0) |
7.9 (2.3) |
6.9 (2.1) |
< 0.001 |
|||||||
|
Medications |
|
|
|
|
|
|
|
|
|||||||
|
β-Blocker |
704 (78%) |
36 (77%) |
201 (88%) |
55 (76%) |
56 (79%) |
222 (73%) |
138 (75%) |
< 0.001 |
|||||||
|
ACEI/ARB |
709 (78%) |
40 (85%) |
184 (81%) |
62 (86%) |
52 (74%) |
231 (76%) |
136 (74%) |
< 0.001 |
|||||||
|
Diuretic |
831 (92%) |
44 (94%) |
220 (97%) |
62 (86%) |
66 (94%) |
274 (90%) |
164 (89%) |
0.048 |
|||||||
|
Aldosterone antagonist |
394 (44%) |
20 (43%) |
133 (58%) |
27 (38%) |
33 (46%) |
112 (37%) |
70 (38%) |
< 0.001 |
|||||||
|
Post-discharge management program |
|
|
|
|
|
|
|
|
|||||||
|
Nurse-led DMP |
248 (27%) |
35 (74%) |
123 (54%) |
9 (12%) |
18 (26%) |
33 (11%) |
24 (13%) |
< 0.001 |
|||||||
|
Review within 7 days |
250 (28%) |
19 (41%) |
123 (54%) |
11 (15%) |
35 (44%) |
39 (13%) |
27 (15%) |
< 0.001 |
|||||||
|
Exercise program |
94 (10%) |
1 (2%) |
11 (5%) |
17 (24%) |
9 (13%) |
24 (8%) |
22 (12%) |
< 0.001 |
|||||||
|
|
|||||||||||||||
|
ACEI = angiotensin-converting enzyme inhibitor; ARB = angiotensin receptor blocker; DMP = disease management program; LVEF = left ventricular ejection fraction; NYHA = New York Heart Association functional classification; SD = standard deviation. * One-way analysis of variance comparing study sites. |
|||||||||||||||
Box 2 – Predictors of short term adverse outcomes for people diagnosed with heart failure
|
|
Outcomes at 30-day follow-up |
Outcomes at 90-day follow-up |
|||||||||||||
|
Re-admission |
Death |
Re-admission |
Death |
||||||||||||
|
|
|||||||||||||||
|
Age at admission (per year) |
1.01 (0.99–1.02) |
1.03 (1.01–1.05) |
1.00 (0.99–1.01) |
1.04 (1.02–1.06) |
|||||||||||
|
Sex (men v women) |
0.82 (0.57–1.18) |
0.82 (0.46–1.46) |
0.97 (0.71–1.32) |
0.83 (0.53–1.32) |
|||||||||||
|
Living alone |
1.92 (1.37–2.68) |
1.81 (1.06–3.11) |
1.23 (0.91–1.67) |
1.58 (1.03–2.44) |
|||||||||||
|
Smoker |
1.13 (0.90–1.42) |
1.56 (1.10–2.22) |
1.05 (0.86–1.28) |
1.36 (1.02–1.82) |
|||||||||||
|
Private health cover |
0.90 (0.59–1.35) |
0.79 (0.41–1.51) |
1.14 (0.78–1.65) |
0.94 (0.55–1.61) |
|||||||||||
|
Remoteness index (v Major cities) |
1.13 (0.90–1.41) |
1.56 (1.10–2.22) |
0.98 (0.80–1.20) |
1.35 (1.02–1.80) |
|||||||||||
|
Relative socio-economic disadvantage index (per quartile) |
0.87 (0.76–1.02) |
0.76 (0.60–0.98) |
0.95 (0.84–1.09) |
0.85 (0.70–1.04) |
|||||||||||
|
Cognitive impairment* |
2.46 (1.61–3.76) |
5.98 (2.13–16.7) |
1.50 (1.09–2.08) |
4.11 (2.09–8.07) |
|||||||||||
|
Depression |
1.22 (1.06–1.42) |
1.55 (1.21–1.98) |
1.17 (1.03–1.33) |
1.27 (1.05–1.54) |
|||||||||||
|
Length of hospital stay (per day) |
1.01 (1.00–1.02) |
1.02 (1.01–1.04) |
1.01 (1.00–1.02) |
1.02 (1.01–1.04) |
|||||||||||
|
NYHA classification (per class) |
1.57 (1.28–1.91) |
3.30 (2.25–4.85) |
1.39 (1.17–1.65) |
2.39 (1.81–3.16) |
|||||||||||
|
LVEF (per % ejection fraction) |
0.99 (0.98–1.01) |
0.99 (0.97–1.01) |
1.00 (0.99–1.01) |
0.99 (0.98–1.01) |
|||||||||||
|
Left ventricular volume index (per mL/m2) |
1.01 (1.00–1.01) |
1.01 (1.00–1.01) |
1.00 (1.00–1.01) |
1.00 (0.99–1.01) |
|||||||||||
|
Left atrial volume index (per mL/m2) |
1.02 (1.01–1.03) |
1.02 (1.01–1.03) |
1.01 (1.01–1.02) |
1.02 (1.01–1.03) |
|||||||||||
|
Right atrial pressure (per mmHg) |
1.04 (1.01–1.07) |
1.03 (0.99–1.07) |
1.07 (1.04–1.10) |
1.03 (1.01–1.07) |
|||||||||||
|
Comorbidities |
|
|
|
|
|||||||||||
|
Hypertension |
1.00 (0.70–1.42) |
0.88 (0.50–1.55) |
1.13 (0.83–1.54) |
1.01 (0.64–1.60) |
|||||||||||
|
Dyslipidaemia |
1.01 (0.73–1.41) |
1.06 (0.62–1.82) |
1.37 (1.02–1.83) |
1.28 (0.83–1.98) |
|||||||||||
|
Atrial fibrillation |
1.61 (1.16–2.23) |
1.33 (0.79–2.24) |
1.56 (1.18–2.08) |
1.73 (1.14–2.63) |
|||||||||||
|
Diabetes |
1.13 (0.90–1.43) |
1.34 (0.94–1.93) |
1.19 (0.97–1.47) |
1.07 (0.79–1.45) |
|||||||||||
|
Charlson index (per point) |
1.16 (1.07–1.24) |
1.27 (1.13–1.43) |
1.15 (1.07–1.24) |
1.27 (1.15–1.39) |
|||||||||||
|
Drugs used |
|
|
|
|
|||||||||||
|
β-Blocker |
0.56 (0.39–0.81) |
0.50 (0.28–0.88) |
0.71 (0.51–1.00) |
0.37 (0.24–0.58) |
|||||||||||
|
ACEI/ARB |
0.74 (0.50–1.09) |
0.67 (0.37–1.23) |
0.72 (0.51–1.03) |
0.66 (0.41–1.07) |
|||||||||||
|
Aldosterone antagonist |
0.83 (0.60–1.16) |
0.64 (0.37–1.13) |
1.03 (0.77–1.38) |
0.90 (0.58–1.38) |
|||||||||||
|
|
|||||||||||||||
|
ACEI = angiotensin-converting enzyme inhibitor; ARB = angiotensin receptor blocker; CI = confidence interval; LVEF = left ventricular ejection fraction; NYHA= New York Heart Association functional classification. * According to Montreal Cognitive Assessment. Significant results (CI does not include 1.0) are highlighted in bold type. |
|||||||||||||||
Box 3 – Effects of systematic approaches for averting re-admissions of patients diagnosed with heart failure on adverse outcomes
|
|
Outcomes at 30-day follow-up |
Outcomes at 90-day follow-up |
|||||||||||||
|
Re-admission |
Death |
Re-admission |
Death |
||||||||||||
|
|
|||||||||||||||
|
Individual management programs |
|||||||||||||||
|
Nurse-led disease management program |
|||||||||||||||
|
No (658) |
1 |
1 |
1 |
1 |
|||||||||||
|
Yes (248) |
0.27 (0.16–0.43) |
0.76 (0.41–1.41) |
0.50 (0.36–0.70) |
0.68 (0.41–1.12) |
|||||||||||
|
Review within 7 days |
|
|
|
|
|||||||||||
|
No (656) |
1 |
1 |
1 |
1 |
|||||||||||
|
Yes (250) |
0.42 (0.28–0.65) |
0.68 (0.36–1.27) |
0.64 (0.46–0.88) |
0.62 (0.37–1.20) |
|||||||||||
|
Exercise program |
|
|
|
|
|||||||||||
|
No (812) |
1 |
1 |
1 |
1 |
|||||||||||
|
Yes (94) |
0.75 (0.41–1.38) |
0.66 (0.23–1.86) |
0.52 (0.30–0.91) |
0.62 (0.26–1.46) |
|||||||||||
|
Combinations of management programs |
|||||||||||||||
|
Nurse-led disease management program + exercise |
|||||||||||||||
|
No (861) |
1 |
1 |
1 |
1 |
|||||||||||
|
Yes (45) |
0.27 (0.06–1.15) |
1.15 (0.48–3.74) |
0.25 (0.08–0.73) |
1.20 (0.47–3.21) |
|||||||||||
|
Nurse-led disease management program + review within 7 days |
|||||||||||||||
|
No (734) |
1 |
1 |
1 |
1 |
|||||||||||
|
Yes (172) |
0.24 (0.13–0.43) |
0.59 (0.27–1.29) |
0.53 (0.36–0.78) |
0.55 (0.27–1.18) |
|||||||||||
|
Exercise + review within 7 days |
|||||||||||||||
|
No (856) |
1 |
1 |
1 |
1 |
|||||||||||
|
Yes (50) |
0.29 (0.06–1.16) |
0.59 (0.08–4.45) |
0.29 (0.10–0.87) |
0.86 (0.25–2.93) |
|||||||||||
|
|
|||||||||||||||
|
CI = confidence interval. |
|||||||||||||||
Box 4 – The associations of management programs with adverse outcomes in heart failure
|
|
Outcomes at 30-day follow-up |
Outcomes at 90-day follow-up |
|||||||||||||
|
Re-admission |
Death |
Re-admission |
Death |
||||||||||||
|
OR (95% CI) |
P |
OR (95% CI) |
P |
OR (95% CI) |
P |
OR (95% CI) |
P |
||||||||
|
|
|||||||||||||||
|
Univariable model |
|
|
|
|
|
|
|
|
|||||||
|
No programs (516) |
1 |
|
1 |
|
1 |
|
1 |
|
|||||||
|
One program (199) |
0.65 |
0.038 |
0.72 |
0.33 |
0.73 |
0.06 |
1.03 |
0.87 |
|||||||
|
Two or three programs (191) |
0.22 |
< 0.001 |
0.65 |
0.13 |
0.45 |
< 0.001 |
0.75 |
0.24 |
|||||||
|
Multivariable model* |
|
|
|
|
|
|
|
|
|||||||
|
No programs (516) |
1 |
|
1 |
|
1 |
|
1 |
|
|||||||
|
One program (199) |
0.61 |
0.028 |
0.87 |
0.74 |
0.64 |
0.027 |
0.87 |
0.33 |
|||||||
|
Two or three programs (191) |
0.19 |
< 0.001 |
0.87 |
0.77 |
0.39 |
< 0.001 |
0.82 |
0.30 |
|||||||
|
|
|||||||||||||||
|
CI = confidence interval; OR = odds ratio. * Adjusted for age, sex, New York Heart Association functional classification, Charlson index, atrial fibrillation, living alone, cognitive function, depression and socio-economic status, and medications. |
|||||||||||||||
Box 6 – Differences between hospitals in adverse outcome rates for patients diagnosed with heart failure, by service provision pattern
|
|
Outcomes at 30-day follow-up |
Outcomes at 90-day follow-up |
|||||||||||||
|
Re-admission |
Death |
Re-admission |
Death |
||||||||||||
|
OR (95% CI) |
P |
OR (95% CI) |
P |
OR (95% CI) |
P |
OR (95% CI) |
P |
||||||||
|
|
|||||||||||||||
|
Model 1: Clinical and non-clinical* |
|||||||||||||||
|
Hospitals A/B |
1 |
|
1 |
|
1 |
|
1 |
|
|||||||
|
Hospitals C/D |
1.80 (1.06–3.05) |
0.03 |
1.70 (0.60–4.79) |
0.31 |
1.65 (1.07–2.55) |
0.024 |
2.36 (1.10–5.03) |
0.027 |
|||||||
|
Hospitals E/F |
1.54 (1.00–2.35) |
0.046 |
2.83 (1.22–6.56) |
0.015 |
1.49 (0.98–2.32) |
0.06 |
2.33 (1.24–4.35) |
0.008 |
|||||||
|
Model 2: Model 1 + programs† |
|||||||||||||||
|
Hospitals A/B |
1 |
|
1 |
|
1 |
|
1 |
|
|||||||
|
Hospitals C/D |
1.27 (0.78–2.13) |
0.51 |
1.72 (0.55–5.38) |
0.35 |
1.02 (0.62–1.68) |
0.92 |
2.27 (1.00–5.19) |
0.05 |
|||||||
|
Hospitals E/F |
1.22 (0.79–1.91) |
0.39 |
2.78 (1.14–6.79) |
0.025 |
1.10 (0.69–1.76) |
0.68 |
2.23 (1.15–4.30) |
0.017 |
|||||||
|
Model 3: Model 2 + echocardiography‡ |
|||||||||||||||
|
Hospitals A/B |
1 |
|
1 |
|
1 |
|
1 |
|
|||||||
|
Hospitals C/D |
1.02 (0.55–1.90) |
0.94 |
1.17 (0.32–4.25) |
0.81 |
0.93 (0.54–1.55) |
0.75 |
0.98 (0.39–2.46) |
0.96 |
|||||||
|
Hospitals E/F |
0.99 (0.52–1.89) |
0.97 |
1.03 (0.37–2.88) |
0.96 |
0.98 (0.57–1.65) |
0.93 |
1.15 (0.55–2.38) |
0.71 |
|||||||
|
|
|||||||||||||||
|
CI = confidence interval; OR = odds ratio. * Adjusted for age, sex, NYHA class, Charlson index, atrial fibrillation, living alone, cognitive function, depression and socio-economic status, and medications. † Model 1 + adjustment for management programs. ‡ Model 2 + adjustment for echocardiography parameters (this model was restricted to 771 patients who underwent an echocardiographic examination). |
|||||||||||||||
Received 17 August 2017, accepted 23 February 2018
- Quan Huynh1,3
- Kazuaki Negishi1
- Carmine De Pasquale2
- James Hare3
- Dominic Leung4
- Tony Stanton5
- Thomas H Marwick3
- 1 Menzies Institute for Medical Research, University of Tasmania, Hobart, TAS
- 2 Flinders Medical Centre, Adelaide, SA
- 3 Baker Heart and Diabetes Institute, Melbourne, VIC
- 4 Liverpool Hospital, Sydney, NSW
- 5 University of Queensland, Brisbane, QLD
This investigation was supported by a Partnership grant from the National Health and Medical Research Council, the National Heart Foundation and Tasmania Medicare Local.
No relevant disclosures.
- 1. Mozaffarian D, Benjamin EJ, Go AS, et al. Heart disease and stroke statistics – 2015 update: a report from the American Heart Association. Circulation 2015; 131: e29-e322.
- 2. Jencks SF, Williams MV, Coleman EA. Rehospitalizations among patients in the Medicare fee-for-service program. N Engl J Med 2009; 360: 1418-1428.
- 3. Bueno H, Ross JS, Wang Y, et al. Trends in length of stay and short-term outcomes among Medicare patients hospitalized for heart failure, 1993–2006. JAMA 2010; 303: 2141-2147.
- 4. Chen J, Normand SL, Wang Y, Krumholz HM. National and regional trends in heart failure hospitalization and mortality rates for Medicare beneficiaries, 1998–2008. JAMA 2011; 306: 1669-1678.
- 5. Medicare Payment Advisory Commission. Report to the Congress: reforming the delivery system. Washington (DC), MPAC, 2008. http://www.medpac.gov/docs/default-source/reports/Jun08_EntireReport.pdf?sfvrsn=0 (viewed Mar 2018).
- 6. National Heart Foundation of Australia. A systematic approach to chronic heart failure care: a consensus statement. Melbourne: NHFA, 2013. https://www.heartfoundation.org.au/images/uploads/publications/HF_CHF_consensus_web_FINAL_SP.pdf (viewed Nov 2017).
- 7. Eapen ZJ, Liang L, Fonarow GC, et al. Validated, electronic health record deployable prediction models for assessing patient risk of 30-day rehospitalization and mortality in older heart failure patients. JACC Heart Fail 2013; 1: 245-251.
- 8. Blair JE, Zannad F, Konstam MA, et al. Continental differences in clinical characteristics, management, and outcomes in patients hospitalized with worsening heart failure results from the EVEREST (Efficacy of Vasopressin Antagonism in Heart Failure: Outcome Study with Tolvaptan) program. J Am Coll Cardiol 2008; 52: 1640-1648.
- 9. Vivo RP, Krim SR, Liang L, et al. Short- and long-term rehospitalization and mortality for heart failure in 4 racial/ethnic populations. J Am Heart Assoc 2014; 3: e001134.
- 10. Huynh QL, Negishi K, Blizzard CL, et al. Predictive score for 30-day readmission or death in heart failure. JAMA Cardiol 2016; 1: 362-364.
- 11. Huynh QL, Saito M, Blizzard CL, et al. Roles of nonclinical and clinical data in prediction of 30-day rehospitalization or death among heart failure patients. J Card Fail 2015; 21: 374-381.
- 12. Gonseth J, Guallar-Castillón P, Banegas JR, Rodríguez-Artalejo F. The effectiveness of disease management programmes in reducing hospital re-admission in older patients with heart failure: a systematic review and meta-analysis of published reports. Eur Heart J 2004; 25: 1570-1595.
- 13. Gwadry-Sridhar FH, Flintoft V, Lee DS, et al. A systematic review and meta-analysis of studies comparing readmission rates and mortality rates in patients with heart failure. Arch Intern Med 2004; 164: 2315-2320.
- 14. McAlister FA, Lawson FM, Teo KK, Armstrong PW. A systematic review of randomized trials of disease management programs in heart failure. Am J Med 2001; 110: 378-384.
- 15. National Heart Foundation of Australia, Cardiac Society of Australia and New Zealand (Chronic Heart Failure Guidelines Expert Writing Panel). Guidelines for the prevention, detection and management of chronic heart failure in Australia. Updated Oct 2011. https://www.heartfoundation.org.au/images/uploads/publications/Chronic_Heart_Failure_Guidelines_2011.pdf (viewed Mar 2018).
- 16. Huynh QL, Negishi K, Blizzard L, et al. Mild cognitive impairment predicts death and readmission within 30 days of discharge for heart failure. Int J Cardiol 2016; 221: 212-217.
- 17. Lang RM, Badano LP, Mor-Avi V, et al. Recommendations for cardiac chamber quantification by echocardiography in adults: an update from the American Society of Echocardiography and the European Association of Cardiovascular Imaging. J Am Soc Echocardiogr 2015; 28: 1-39.e14.
- 18. Charlson ME, Pompei P, Ales KL, MacKenzie CR. A new method of classifying prognostic comorbidity in longitudinal studies: development and validation. J Chronic Dis 1987; 40: 373-383.
- 19. Nasreddine ZS, Phillips NA, Bedirian V, et al. The Montreal Cognitive Assessment, MoCA: a brief screening tool for mild cognitive impairment. J Am Geriatr Soc 2005; 53: 695-699.
- 20. Pink B. 2011 Census of population and housing: socioeconomic index for areas (ABS Catalogue no. 2033.0.55.001). Canberra: Australian Bureau of Statistics, 2013. http://www.ausstats.abs.gov.au/Ausstats/subscriber.nsf/0/22CEDA8038AF7A0DCA257B3B00116E34/$File/2033.0.55.001%20seifa%202011%20technical%20paper.pdf (viewed Mar 2018).
- 21. Australian Bureau of Statistics. Remoteness structure: the Australian Statistical Geography Standard (ASGS) remoteness structure. Updated Mar 2018. http://www.abs.gov.au/websitedbs/d3310114.nsf/home/remoteness+structure (viewed Mar 2018).
- 22. Hernandez AF, Greiner MA, Fonarow GC, et al. Relationship between early physician follow-up and 30-day readmission among Medicare beneficiaries hospitalized for heart failure. JAMA 2010; 303: 1716-1722.
- 23. Taylor RS, Sagar VA, Davies EJ, et al. Exercise-based rehabilitation for heart failure. Cochrane Database Syst Rev 2014; (4): CD003331.
- 24. Pandey A, Parashar A, Kumbhani DJ, et al. Exercise training in patients with heart failure and preserved ejection fraction: meta-analysis of randomized control trials. Circ Heart Fail 2015; 8: 33-40.
- 25. Mudge AM, Denaro CP, Scott AC, et al. Addition of supervised exercise training to a post-hospital disease management program for patients recently hospitalized with acute heart failure: the EJECTION-HF randomized phase 4 trial. JACC Heart Fail 2018; 6: 143-152.
- 26. Yancy CW, Jessup M, Bozkurt B, et al. 2013 ACCF/AHA guideline for the management of heart failure: executive summary. A report of the American College of Cardiology Foundation/American Heart Association Task Force on practice guidelines. Circulation 2013; 128: 1810-1852.
- 27. Dharmarajan K, Hsieh AF, Kulkarni VT, et al. Trajectories of risk after hospitalization for heart failure, acute myocardial infarction, or pneumonia: retrospective cohort study. BMJ 2015; 350: h411.
- 28. Australian Institute of Health and Welfare. Safety and quality in Australian hospitals. In: Australia’s health 2016 (AIHW Cat. No. AUS 199; Australia’s Health Series No. 15). Canberra: AIHW, 2016. https://www.aihw.gov.au/getmedia/3876a585-9a48-4553-8939-59711f1aa573/ah16-6-14-safety-quality-australian-hospitals.pdf.aspx (viewed Dec 2017).
- 29. Page K, Marwick TH, Lee R, et al. A systematic approach to chronic heart failure care: a consensus statement. Med J Aust 2014; 201: 146-150. <MJA full text>
Abstract
Objectives: To investigate whether enrolment of patients in management programs after hospitalisation for heart failure (HF) reduces the likelihood of post-hospital adverse outcomes.
Design: Cohort study in which associations between adverse outcomes at 30 and 90 days for people hospitalised for HF and baseline clinical, socio-demographic and blood pathology factors, and with post-discharge management strategies, were assessed.
Setting, participants: 906 patients with HF were prospectively enrolled in five Australian states at cardiology departments with expertise in treating people with HF.
Main outcome measures: All-cause re-admissions and deaths at 30 and 90 days after discharge from the index admission.
Results: 58% of patients were men; the mean age was 72.5 years (SD, 13.9 years). By hospital, 30-day re-admission rates ranged from 17% to 33%, and 90-day rates from 40% to 55%; 30-day mortality rates were 0–13%, 90-day rates 4–24%. Factors associated with increased odds of re-admission or death at 30 or 90 days included living alone, cognitive impairment, depression, NYHA classification, left atrial volume index, and Charlson index score. Nurse-led disease management programs and reviews within 7 days were associated with reduced odds of re-admission (but not of death) at 30 and 90 days; exercise programs were associated with reduced odds at 90 days. Significant between-hospital differences in re-admission rates were reduced after adjustment for post-discharge management programs, and abolished by further adjustment for echocardiography findings. Between-hospital differences in mortality were largely explained by differences in echocardiographic findings.
Conclusions: Differences in early re-admission rates after hospitalisation for HF are primarily explained by differences in post-discharge management.