




Medical education
Key research skills
Volume 207 - Issue 3
Understanding statistical principles in correlation, causation and moderation in human disease
Authors: Michael P Jones, Marjorie M Walker and John R Attia
Med J Aust 2017; 207 (3): 104-106. || doi: 10.5694/mja16.00697
Published online: 7 August 2017
Published online: 7 August 2017
Understanding the relationships between risk factors and disease outcomes is an important aspect of much clinical medical and epidemiological research
We are all familiar with the expression “correlation does not imply causation”, but often causation is exactly what we need to determine. For example, one may want to understand whether the use of MP3 players with earbuds causes partial hearing loss, whether holding mobile telephones to the ear causes brain cancer or whether parents’ exposure to toxic chemicals during conception or pregnancy causes birth defects in children. Non-causal risk factors can be useful, but eventually, what we really want to understand is causation. Because the causal connection between exposure to risk factor and disease outcome is often complex or poorly understood, what researchers can truly study is whether an association exists or not. This article explains how we can move from correlation and association to causal interpretation of data, and what statistical evidence is needed to support causal conclusions.
Association versus causation
Association is essential to causation. These principles can be illustrated with this hypothetical example: mast cell counts and level of gastrointestinal symptoms.
Mast cells are pro-inflammatory cells that are part of the innate immune system.1 In the intestinal tract, they have been thought to be associated with abdominal pain and other gastrointestinal symptoms. The data below are artificial, but illustrate one approach to studying the association between level of mast cells and level of abdominal symptoms.
Box 1 shows a clear tendency for individuals with higher mast cell counts to have higher levels of abdominal symptoms, as measured by a score called the gastrointestinal symptom rating scale, in which higher scores indicate higher levels of symptoms. While the graph is clear, its visual interpretation is subjective. We can quantify the degree of relationship through the Pearson correlation coefficient, which for this graph is 0.87 (strong), and we would reject the statistical null hypothesis of no correlation (P < 0.001).
Higher counts of mast cells are associated with a higher burden of abdominal symptoms, but does this prove that mast cells cause abdominal symptoms? These reasons explain why this may not be the case:
-
Random chance: if we measure enough arbitrary variables and look at all possible associations between them, in a small proportion of cases we will find an apparent association in our sample, where none really exists, due to random sampling factors. The website created by Tyler Vigen (http://www.tylervigen.com/spurious-correlations) has numerous examples of such spurious associations.
-
Bias: it is possible to induce association by consciously or unconsciously biased choices of measurement and patient inclusion criteria. There is evidence that associations between pharmaceutical treatments and clinical outcomes have been created this way.2
-
Confounding: in which causation is attributed to the wrong factor. Box 2 illustrates a possible scenario where infestation by a parasite is the actual cause of both elevated mast cells and abdominal symptoms. It is because mast cells and gastrointestinal symptoms are both elevated by parasites, through a biologically plausible immune response to the presence of a pathogen,3 that they appear to be related. They are indeed related, but not because either causes the other. This shows the importance of understanding the biological processes that underpin a hypothesised association. Doing so will minimise the risk of finding spurious associations and allow us to move to studying mediation.
The importance of association as a marker was illustrated in 1950, when two medical statisticians, Richard Doll and Bradford Hill, published an article in the British Medical Journal4 that suggested that smoking tobacco in various forms was associated with elevated incidence of lung cancer. Their article did not prove causation, but provided strong statistical evidence of association. It took decades and many legal battles to recognise the causal nature of the association and for governments to act on the data. Another statistician, Ronald Fisher, proposed several spurious non-causal interpretations5 of the Doll and Hill data. A lesson from the tobacco and lung cancer example is that while we should not conflate association with causation, we should view association as a signal that needs to be followed with further rigorous study.
In reality, the causal link between many risk factors and disease outcomes is not as simple as one leading directly to the other.
Mediation
Irritable bowel syndrome (IBS) is a functional gastrointestinal disorder characterised by abdominal pain and bowel habit disturbance,6 and has been strongly associated with mood disorders,7 particularly anxiety and depression. A study by Liebregts and colleagues8 showed that individuals with diarrhoea-predominant IBS have elevated serum levels of the cytokine tumour necrosis factor alpha (TNF-α), another pro-inflammatory marker. They also showed that higher levels of TNF-α are associated with higher levels of anxiety. So does this prove that IBS causes anxiety through elevated cytokine levels? The pattern of associations is certainly supportive of that interpretation. The study of whether risk factor (IBS) causes outcome (anxiety) through its action on a third factor (TNF-α) is termed mediation, with TNF-α playing the role of mediator (ie, facilitator). The study of mediation (Box 3) is always to provide the statistical evidence to support a causal interpretation, so we need to understand what criteria are necessary. Determination of causation is complicated by having to differentiate causal explanations from others, but Hill9 proposed nine criteria for causality, which may be grouped under:
-
association (stronger is more convincing);
-
correct temporal order (outcome cannot precede cause); and
-
elimination of other explanations.
Maxwell and Cole10 provide a detailed account of the statistical models required to establish mediational relationships, which require complex statistical models applied to longitudinal measurements (Box 4). In Box 4, the dashed line represents the link between IBS state and anxiety via TNF-α in the model, which incorporates other non-causal paths.
Based on these criteria, we cannot conclude that the Liebregts study8 proves a causal chain, since it is cross-sectional and other potential explanations cannot be ruled out. Indeed, any study that claims to have studied mediating factors from a cross-sectional design is incorrect, although this is not uncommon; for example, Kershaw and colleagues,11 who studied the role of C-reactive protein in the association between stress and cardiovascular disease.
Moderation
One of the Hill9 criteria for causality is consistency of findings of association, which resonates with the scientific method concept of reproducibility of findings. However, it is possible that the association between risk factor and outcome is causal, but varies in strength and direction between individuals according to the value of a third factor. In this case, we would say that the third variable moderates the association between risk factor and outcome, sometimes known as “effect modification” in the epidemiological literature. For example, we know that IBS is associated with higher level of anxiety, but not all patients with IBS have elevated anxiety. Is this, perhaps, because a third factor dampens anxiety in some people? One possible mediator would be social support, where we may expect that individuals who have high levels of social support may have their anxiety about IBS symptoms dampened by reassurance. If this is true, we would expect a stronger association between IBS and anxiety in individuals who do not have adequate social support than in those patients who do. Box 5 reports hypothetical data in which the difference between IBS and controls is pronounced for patients with low social support, but quite small for patients with high social support. We would say here that social support moderates the association. Looking at graphs is, however, subjective and we can examine the moderating effect objectively through statistical models that include the interaction between IBS and social support, such as:
-
Anxietyi = β0 + β1 IBS + β2 Social support + β3 IBS × Social support + εi
In this model, the parameter β3 represents the moderation that, in this case, measures the difference between IBS and health in individuals with low versus high social support. From Box 6, we see that the estimate of β3 is −4.5, which comes from IBS–health in high social support (10.3–9.6) minus IBS–health in low social support (15.3–10.1) equals −4.5. Because we estimate the moderating influence of social support, we can also statistically test whether it may reasonably have arisen by random chance. The interaction P value is less than 0.001 and hence we reject the null hypothesis and conclude that social support does moderate the association.
Conclusion
Understanding the relationships between risk factors and disease outcomes is an important aspect of much clinical medical and epidemiological research. While associations are useful and an important first step, understanding causal pathways between risk factor and disease is the ultimate goal. Causal interpretations can only come from a combination of good science, choice of research design and appropriate statistical modelling.
Box 1 – Hypothetical association between mast cell count and patient score on abdominal symptoms
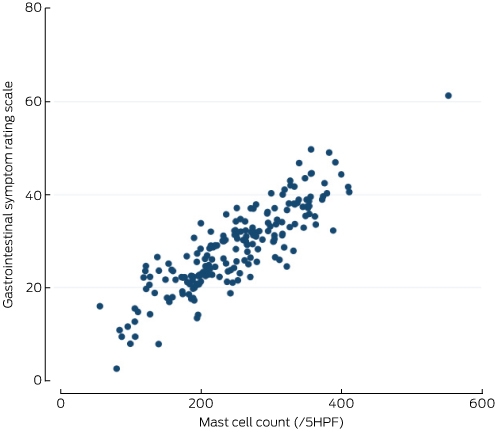
HPF = high power field. This figure plots individuals’ mast cell count on the horizontal axis against their score on the gastrointestinal symptom rating scale (GSRS) (0–100) on the vertical axis. The plot yields a clear indication that higher mast cell counts tend to be associated with higher GSRS scores due to its upward trending appearance.
Box 2 – Spurious association between suspected cause and outcome
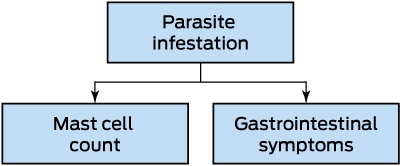
The arrows represent causal associations. In this case, the presence of parasites causes both an immune reaction (mast cell production) and patient-reported gastrointestinal symptoms. Hence, mast cell count and symptoms appear to be related, but in reality, they are only related indirectly through the presence of parasites.
Box 3 – Direct and indirect associations in cross-sectional research designs
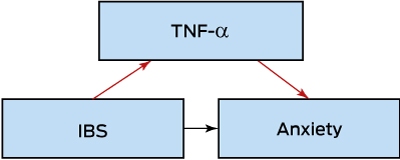
IBS = irritable bowel syndrome. TNF-α = tumour necrosis factor alpha. The arrows represent hypothesised causal associations. Two causal paths are hypothesised between IBS and anxiety. One is a direct causal pathway (blue), while in the other, IBS operates indirectly (red) on anxiety through altering levels of TNF-α.
Box 4 – Longitudinal true mediation relationships
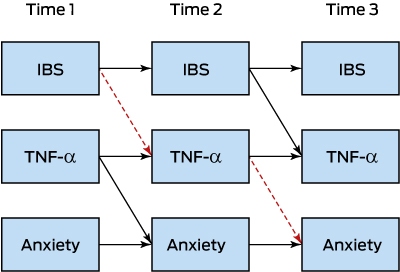
IBS = irritable bowel syndrome. TNF-α = tumour necrosis factor alpha. This figure expresses a hypothesised model of complex causal and non-causal paths. The path of interest is represented by the red dashed line leading from IBS at time 1 to TNF-α at time 2 to anxiety at time 3. The magnitude and statistical significance of this path, controlling for all the other paths, yield insight into possible causal associations.
Box 5 – Moderation of irritable bowel syndrome–anxiety relationship by social support
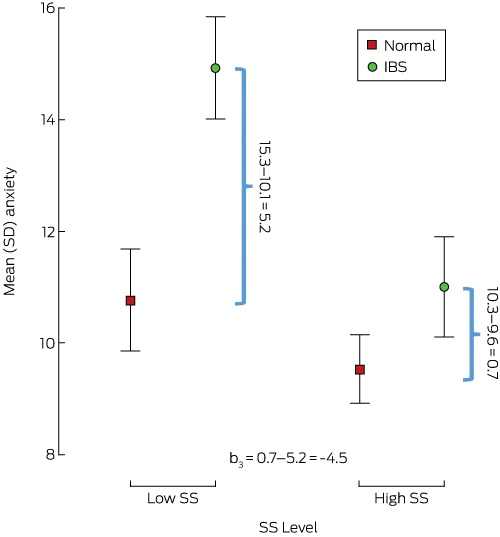
IBS = irritable bowel syndrome. SD = standard deviation. SS = social support. This figure reports how the difference in anxiety score between IBS (green) and normal (blue) is moderated by SS level. The circles indicate mean anxiety score, while the error bars represent 95% confidence intervals. The difference between IBS and health is more pronounced for individuals with low SS than for individuals with high SS.
Box 6 – Descriptive statistics and regression modelling results in the study of the moderating influence of social support on irritable bowel syndrome (IBS) in gastrointestinal symptom burden
|
Social support |
Health∗ |
IBS∗ |
Regression parameter† |
||||||||||||
|
|
|||||||||||||||
|
Low |
10.1 (2.1) |
15.3 (1.6) |
b0: 10.1 (0.4) |
||||||||||||
|
High |
9.6 (1.7) |
10.3 (2.2) |
b1: 5.2 (0.6) |
||||||||||||
|
b2: –0.5 (0.5) |
|||||||||||||||
|
b3: –4.5 (0.8) |
|||||||||||||||
|
|
|||||||||||||||
|
* Entries are mean and (standard deviation). † Entries are regression coefficient and (standard error). |
|||||||||||||||
Competing interests
No relevant disclosures.
References
- Walker MM, Talley NJ, Prabhakar M, et al. Duodenal mastocytosis, eosinophilia and intraepithelial lymphocytosis as possible disease markers in the irritable bowel syndrome and functional dyspepsia. Aliment Pharmacol Ther 2009; 29: 765-773.
- Goldacre B. Is the conflict of interest unacceptable when drug companies conduct trials on their own drugs? Yes. BMJ 2009; 339.
- Mukai K, Tsai M, Starkl P, et al. IgE and mast cells in host defense against parasites and venoms. Semin Immunopathol 2016; 38: 581-603.
- Doll R, Hill AB. Smoking and carcinoma of the lung. Br Med J 1950; 2: 739-748.
- Stolley PD. When genius errs: RA Fisher and the lung cancer controversy. Am J Epidemiol 1991; 133: 416-425.
- Longstreth GF, Thompson WG, Chey WD, et al. Functional bowel disorders. Gastroenterology 2006; 130: 1480-1491.
- Koloski NA, Jones M, Kalantar J, et al. The brain–gut pathway in functional gastrointestinal disorders is bidirectional: a 12-year prospective population-based study. Gut 2012; 61: 1284-1290.
- Liebregts T, Adam B, Bredack C, et al. Immune activation in patients with irritable bowel syndrome. Gastroenterology 2007; 132: 913-920.
- Hill AB. The environment and disease: association or causation? Proc R Soc Med 1965; 58: 295-300.
- Maxwell SE, Cole DA. Bias in cross-sectional analyses of longitudinal mediation. Psychol Methods 2007; 12: 23-44.
- Kershaw KN, Mezuk B, Abdou CM, et al. Socioeconomic position, health behaviors, and C-reactive protein: a moderated-mediation analysis. Health Psychol 2010; 29: 307-316.
Provenance: Commissioned; externally peer reviewed.
Interpreting Australian Stillbirth Rate Trends: Implications for Surveillance and Continuous Quality Improvement
Aleena M. Wojcieszek, Kirstine Sketcher-Baker, Christine Andrews, Michael Coory, Imogen Kettle, Melissa Malivoire, David Ellwood, Vicki Flenady
Paracetamol in Pregnancy: Uncertain Evidence, Certain Consequences
David J. Tunnicliffe, Miranda Cumpston, Debra Kennedy, Margie Danchin, Armando Teixeira-Pinto
Fatty Liver Disease in Australia: A Narrative Review on the Epidemiology, Natural History, Prognostication and Management in People With Metabolic Dysfunction
Karl Vaz, Daniel Clayton-Chubb, William W. Kemp, Stuart K. Roberts, Ammar Majeed
Birth prevalence, clinical sequelae, and management of congenital cytomegalovirus infections in Australia, 1999–2023: a national prospective study
Ece Egilmezer, Suzy M Teutsch, Carlos Nunez, Stuart T Hamilton, Adam W Bartlett, Pamela Palasanthiran, Elizabeth J Elliott, William D Rawlinson
The number of cancer‐related deaths that could be attributable to spatial disparities in survival in Australia, 2010–2019: a retrospective population‐based cohort study
Charlotte K Bainomugisa, Jessica Cameron, Paramita Dasgupta, Peter Baade
Mandatory research projects during medical specialist training in Australia and New Zealand
Paulina Stehlik, Caitlin Brandenburg, David A Henry