




Medical education
Clinical skills
Volume 207 - Issue 10
Spirometry: key to the diagnosis of respiratory disorders
Author: John R Wheatley
Med J Aust 2017; 207 (10): 422-423. || doi: 10.5694/mja17.00684
Published online: 20 November 2017
Published online: 20 November 2017
Poor quality spirometry or incorrect interpretation compromises clinical diagnosis and management
Spirometry remains the cornerstone of respiratory function testing and is the key to diagnosing and monitoring the most common respiratory disorders. Spirometry measures how quickly the air can empty from the lungs (flow) and how much air can be moved during a maximal expiration (volume). It is a valuable clinical tool to detect diseases that impair respiratory function, help exclude respiratory disease as a cause of current symptoms, assess the severity of any impairment in function, and monitor the effects of any therapeutic intervention or of disease progression.
Quality of testing
The validity of results depends on the quality of each expiratory effort, and a suboptimal quality test has the potential to negatively influence the interpretation of the result. Interpretation should begin by establishing whether the testing meets spirometry standards:1-3
-
at least three efforts must meet acceptability criteria (maximal inspiration prior, fast expiration without delay, continuous expiration for ≥ 6 s with a plateau in flow despite continued effort, no observed leaks or artefact in trace);1-3
-
the two best acceptable efforts must be repeatable (ie, the two largest forced expiratory volume in 1 s [FEV1] values are within 150 mL of each other and the two largest forced vital capacity [FVC] values are within 150 mL of each other); and
-
the largest FEV1 and FVC from the two best repeatable, acceptable trials must be reported for interpretation.
Key parameters
The key parameters used for interpretation are the FEV1/FVC ratio, FEV1 and FVC.
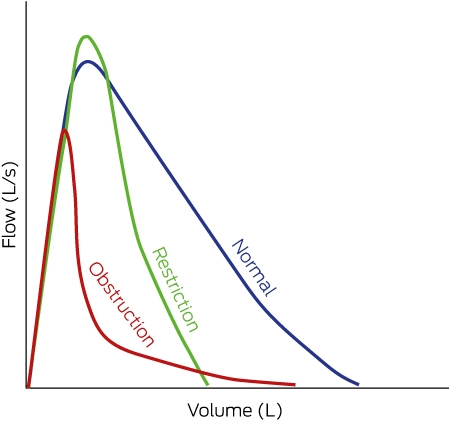
Visual representation of the expiratory flow–volume curve provides useful information regarding the type of ventilatory defect (Box 1), while the inspiratory flow–volume curve is useful in identifying upper airways obstruction.
Peak expiratory flow and forced expiratory flow at 25–75% of FVC are not sensitive or specific, and are not recommended for use in interpretation.1-4
Normal predicted values
In order to interpret spirometry, predicted normal values (reference equations) are derived from healthy populations to provide an indication of what is expected based on the height, age, sex and ethnicity of the patient. The Thoracic Society of Australia and New Zealand recommends using the reference ranges of the Global Lung Function Initiative.5 Most respiratory diseases result in abnormally low results for the spirometry parameters used in interpretation. Values below the lower limits of normal (LLN) are regarded as abnormally reduced.3-5 The LLN is set at the 5th percentile for both FEV1 and FVC (ie, 5% of the population lie below the normal range).
Interpretive strategy
First, review the FEV1/FVC ratio to identify any airway obstruction. Next, use the FEV1 as a percentage of the predicted normal value for your patient (percentage predicted) to classify the severity of any obstruction. Finally, calculate the FVC as a percentage of the predicted value to determine if there is any suggestion of lung restriction (Box 2 provides a diagnostic algorithm for interpreting spirometry results).
Typical patterns of abnormality
Obstructive ventilatory defect
In patients with an obstructive ventilatory defect, the FEV1/FVC ratio is below the LLN, with a distinct concave appearance of the flow–volume curve (Box 1).3,4 Severity of an abnormal test can be graded clinically (Box 3).3,4
Possible pathologies include asthma, chronic obstructive pulmonary disease, emphysema, chronic bronchitis, bronchiectasis, cystic fibrosis, bronchiolitis, foreign bodies and tumours.
Restrictive ventilatory defect
In patients with a restrictive ventilatory defect, the FEV1/FVC ratio is normal or high, and the FVC percentage predicted is below the LLN.3,4 A restrictive ventilatory defect requires confirmation by lung volume measurement (total lung capacity) in a specialist respiratory laboratory. Severity of an abnormal test can be graded clinically (Box 3).3,4
Possible pathologies include interstitial lung diseases, congestive cardiac failure, chest wall disorders (eg, kyphoscoliosis), neuromuscular diseases affecting respiratory muscles, lobectomy or pneumonectomy, pleural disease and morbid obesity (body mass index > 40 kg/m2).
Mixed ventilatory defect
In mixed ventilatory defects, both the FEV1/FVC ratio and the FVC percentage predicted are below the LLN, and the FEV1 percentage predicted is also reduced.3,4 The finding of a mixed ventilatory defect requires confirmation and interpretation by a specialist respiratory laboratory.
Possible pathologies can be a combination of any of those listed above for obstructive and restrictive ventilatory defects.
Reversibility testing and longitudinal monitoring
Responsiveness to bronchodilators is a way of testing the reversibility of an obstructive ventilatory defect. Reversibility is seen most commonly in asthma, but also occurs (to a lesser extent) in chronic obstructive pulmonary disease and cystic fibrosis. A ≥ 12% and ≥ 200 mL increase in FEV1 or FVC from baseline is considered to be significant reversibility.3,4
Longitudinal monitoring of an individual’s lung function is very relevant for any patient with chronic respiratory disease. A change of ≥ 12% and ≥ 200 mL in either direction in FEV1 or FVC may represent a real change over time.3,4
Conclusion
The correct interpretation of spirometry testing, in conjunction with clinical assessment, is essential for the diagnosis and monitoring of a wide range of common respiratory disorders. Poor quality spirometry or incorrect interpretation will compromise correct clinical diagnosis and management.
Box 1 – Visual representation of flow–volume curves in a healthy normal person and in patients with obstructive and restrictive ventilatory defects
Box 2 – Interpretation algorithm for spirometry results3,4
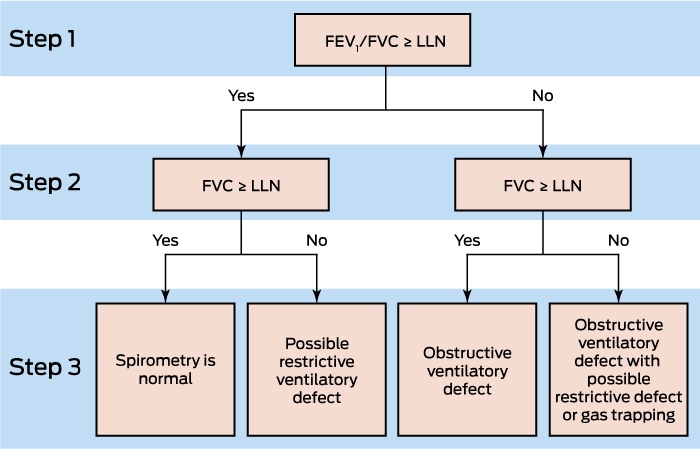
FEV1 = forced expiratory volume in 1 s. FVC = forced vital capacity. LLN = lower limits of normal.
Box 3 – Clinical severity scale for an obstructive ventilatory defect3,4,∗
|
Clinical severity |
FEV1 percentage predicted |
||||||||||||||
|
|
|||||||||||||||
|
Mild |
≥ 70% |
||||||||||||||
|
Moderate |
60–69% |
||||||||||||||
|
Moderately severe |
50–59% |
||||||||||||||
|
Severe |
35–49% |
||||||||||||||
|
Very severe |
< 35% |
||||||||||||||
|
|
|||||||||||||||
|
FEV1 = forced expiratory volume in 1 s. * The severity scale for a restrictive ventilatory defect is similar to that for an obstructive ventilatory defect, substituting forced vital capacity percentage predicted for FEV1 percentage predicted. |
|||||||||||||||
Competing interests
No relevant disclosures.
References
- Miller MR, Hankinson J, Brusasco V, et al. Standardisation of spirometry. Eur Respir J 2005; 26: 319-338.
- Levy ML, Quanjer PH, Booker R, et al. Diagnostic spirometry in primary care: proposed standards for general practice compliant with American Thoracic Society and European Respiratory Society recommendations. Prim Care Respir J 2009; 18: 130-147.
- Borg BM, Thompson BR, O’Hehir RE. Interpreting lung function tests: a step-by-step guide. Chichester, UK: John Wiley & Sons Ltd, 2014; pp 13-36.
- Pellegrino R, Viegi G, Brusasco V, et al. Interpretative strategies for lung function tests. Eur Respir J 2005; 26: 948-968.
- Quanjer PH, Stanojevic S, Cole TJ, et al. Multi-ethnic reference values for spirometry for the 3–95 year age range: the global lung function 2012 equations. Eur Respir J 2012; 40: 1324-1343.
Provenance: Commissioned; externally peer reviewed.
Barriers and Facilitators to Timely Detection and Optimal Management of Chronic Wet Cough in Aboriginal Children Across Australia From the Perspectives of Carers of Aboriginal Children: A Qualitative Study
Gloria T. Y. Lau, Pam Laird, Robyn Aitken, Melanie Barwick, Liam Bedford, Emily R. Bowden, Jamie Everingham, Angela Fuery, Reece Griffin, Neha Jain, Mina Kinghorn, Renae Knapp, Gabrielle B. McCallum, Peter Morris, Richard Norman, Peter C. Richmond, Aarti Saiganesh, Slade Sibosado, Cameron Taylor, Maree Toombs, Roz Walker, Joan Wilson, Anne B. Chang, André Schultz
Barriers and Facilitators to Timely Detection and Optimal Management of Chronic Wet Cough in Aboriginal Children Across Australia From the Perspective of Health Care Providers: A Qualitative Study
Gloria T. Y. Lau, Pamela Laird, Robyn Aitken, Melanie Barwick, Liam Bedford, Emily R. Bowden, Corey Dalton, Jamie Everingham, Angela Fuery, Reece Griffin, Neha Jain, Mina Kinghorn, Renae Knapp, Gabrielle B. McCallum, Peter Morris, Richard Norman, Peter C. Richmond, Aarti Saiganesh, Slade Sibosado, Maree Toombs, Roz Walker, Joan Wilson, Anne B. Chang, André Schultz
Respiratory Syncytial Virus Disease Burden and Evidence Gaps in Australia Before Immunisation Introduction: A Retrospective Population-Based Study Using 2016–2019 Hospitalisation and 2023 Laboratory Surveillance Data
Chisato Imai-Boulter, Jean Li-Kim-Moy, Clayton Chiu, Sanjay Jayasinghe, Kristine Macartney
Not Gone but Often Forgotten: Action Needed to Address Tuberculosis in Aboriginal and Torres Strait Islander Communities
Nikkita Joshua, Emma L. Smith, Eunice (Cheeky) Love, Christopher P. Lowbridge, Nicole Tukana, Amy Bowden, Megan A. Campbell, Dawn Casey, James Ward
Uneven Ground: Survival Differences Among Victorian Lung Cancer Patients by Location of Residence (2011–2023): A Retrospective Cohort Study
Evangeline Samuel, Eldho Paul, Mike Lloyd, Sanuki Tissera, Craig Underhill, Sagun Parakh, Phillip Parente, Inger Olesen, Javier Torres, Katharine See, Gavin M. Wright, David Langton, Thomas John, Matthew Conron, James Bartlett, Nicola Atkin, Nikolajs Zeps, Susan V. Harden, Wasek Faisal, John R. Zalcberg, Rob G. Stirling
Treatment and Survival Outcomes for Indigenous and Non-Indigenous Australians Within the Victorian Lung Cancer Registry: A Retrospective Cross-Sectional Cohort Study
Melanie Wong, Mike Lloyd, Jessie Zeng, Sanuki Tissera, Kalinda E. Griffiths, Justine Clark, Jonathan Gillies, Lisa Briggs, Jacqueline Lesage, Tom Wood, Craig Underhill, Sagun Parakh, Louis B. Irving, Wasek Faisal, Rob Blum, Gary E. Richardson, Phillip Parente, Michelle Caldecott, Inger Olesen, Javier Torres, Evangeline Samuel, Christopher Lyne, Katharine See, David Langton, Thomas John, Gavin Wright, Matthew Conron, James Bartlett, Golsa Adabi, Maggie Moore, Susan Harden, Zoe K. McQuilten, John R. Zalcberg, Rob Stirling