




Volume 206 - Issue 4
Thirty years of the World Health Organization’s target caesarean section rate: time to move on
Authors: Stephen J Robson and Caroline M de Costa
Med J Aust 2017; 206 (4): 181-185. || doi: 10.5694/mja16.00832
Published online: 6 March 2017
Published online: 6 March 2017
Is it really possible to prescribe a target caesarean section rate applicable to all 194 WHO member countries?
Summary
- It has been 30 years since the World Health Organization first recommended a “maximum” caesarean section (CS) rate of 15%.
- There are demographic differences across the 194 WHO member countries; recent analyses suggest the optimal global CS rate is almost 20%.
- Attempts to reduce CS rates in developed countries have not worked.
- The strongest predictor of caesarean delivery for the first birth of “low risk” women appears to be maternal age; a factor that continues to increase.
- Most women whose first baby is born by caesarean delivery will have all subsequent children by caesarean delivery.
- Outcomes that informed the WHO recommendation primarily relate to maternal and perinatal mortality, which are easy to measure.
- Longer term outcomes, such as pelvic organ prolapse and urinary incontinence, are closely related to mode of birth, and up to 20% of women will undergo surgery for these conditions. Pelvic floor surgery is typically undertaken for older women who are less fit for surgery.
- Serious complications such as placenta accreta occur with repeat caesarean deliveries, but the odds only reach statistical significance at the third or subsequent caesarean delivery. However, in Australia, parity is falling, and only 20% of women will have more than two births.
- We should aim to provide CS to women in need and to continue including women in the conversation about the benefits and disadvantages, both short and long term, of birth by caesarean delivery.
The 2009 edition of the World Health Organization Monitoring emergency obstetric care handbook was the first since 1985 not to recommend a maximum caesarean section (CS) rate of 15%.1 In its place was the statement, “there is no empirical evidence for an optimum percentage or range of percentages”, and a concession that “what matters most is that all women who need caesarean sections actually receive them”. Despite this change, a perception remained that CSs above such a “target” rate were unnecessary.2
In 2015, a new WHO standalone policy statement was released, restating that “every effort should be made to provide caesarean sections to women in need, rather than striving to achieve a specific rate”.3 However, the document justified a return to the old recommendation, recognising that “the international community has increasingly referenced the need to revisit the 1985 recommended rate”:
Since 1985, the international healthcare community has considered the ideal rate for caesarean sections to be between 10% and 15% … there is no evidence showing the benefits of caesarean delivery for women or infants who do not require the procedure … caesarean sections are associated with short and long term risk which can extend many years beyond the current delivery and affect the health of the woman, her child, and future pregnancies. These risks are higher in women with limited access to comprehensive obstetric care.3
The WHO’s original 1985 consensus opinion arose from the observation that certain countries with low perinatal mortality rates had CS rates of less than 10%.4 Thus, “CS rates above a certain limit have not shown additional benefit for the mother or the baby, and some studies have even shown that high CS rates could be linked to negative consequences in maternal and child health”.2,5-11 But is it really possible to prescribe a target CS rate applicable to all 194 WHO member countries?
In this narrative review, we have used original papers and review articles from the past 30 years to formulate an overview of this topic, which is fundamental to the provision of women’s health care in Australia, and to put the WHO recommendation in perspective using Australian data.
Is an international caesarean section target rate realistic?
In Australia at present, almost a third of all births are caesarean deliveries: close to 100 000 CSs are performed each year.12 Consider the differences between Australia and our nearest neighbour, Papua New Guinea (PNG), where the CS rate is estimated to be less than 5%.13 In Australia, the median maternal age at first birth is 29 years, and the median number of births a woman will have is two — less than 5% of Australian women will have more than three children.12 The only situation in which Australian women do not have a skilled attendant present at birth is by choice or accident.
In contrast, the median maternal age at first birth in PNG is 20 years, with about one woman in six having her first baby before the age of 18 years; the average number of births per woman is 4.6.14 The maternal mortality rate has been estimated at 500 per 100 000 (compared with 7.1 per 100 000 in Australia) and the perinatal mortality rate at about 66 per 1000 births (10 per 1000 in Australia).12,15 Less than 40% of births are attended by skilled attendants. Are Australia and PNG sufficiently comparable in terms of the demographics of mothers and access to health care that the same recommendations should apply to both countries?
The studies on which the WHO based the 15% recommendation 30 years ago were “limited by either having incomplete data or relying on averaged cesarean delivery rates from multiple years without accounting for year-to-year variation in these estimates”.16 To address such differences, Molina and colleagues conducted a study in 2012 using data from the World Bank’s World Development Indicators database and other reliable sources to compare neonatal and maternal mortality among the 194 WHO member states.16 To account for differences in demographics and access to health care, they adjusted their analyses for potentially influential factors such as total population, life expectancy at birth, remoteness and urbanisation, gross domestic product per capita, total health expenditure per capita, total fertility rate and national birth rate. The study’s findings suggested that the optimal international CS rate was about 19%; the global CS rate was estimated to be 19.4%.
The authors concluded that the focus of discussion about CS rates should be on “supporting safe and appropriate provision of cesarean delivery … with the intent of reducing maternal and neonatal mortality without causing overuse of procedures”.16 However, it was also clear that there is a “complex interplay between overall maternal health resources, emergency obstetrical services, and other factors”, meaning that “the [study’s derived] optimal cesarean delivery rate … may not apply to all countries because a certain level of nationally available resources may be required”.
An editorial accompanying this study commented that:
Cesarean delivery rates have long been viewed as a marker of quality, but viewed in isolation they provide inadequate information regarding the quality of practice in a health care system … rates should be considered to be only one of a number of quality criteria used to evaluate an individual or institution, and the primary goal of all obstetric services should be that of patient safety.17
Influence of demographic changes on caesarean section rates
Notwithstanding the WHO recommendation, attempts to reduce CS rates in developed countries have not worked very well,18 begging the question of why rates increased in the first place.12,19-23 Purported explanations include reluctance on the part of obstetricians to manage complex vaginal births24,25 and greater numbers of women requesting caesarean delivery.26,27 More importantly, over the past two decades, there have been major changes in the demographics of women.
Of Australian women having their first child in 1993, only 26% were aged 30 years or older, and a mere 6% were aged at least 35 years. By 2013, the proportion of women having their first baby at age 30 or older had reached 45%, and 14% of first-time mothers were aged 35 years or older.12 A study of first births in South Australia over a 20-year period found that the adjusted odds for emergency caesarean delivery increased multiplicatively by more than a third for every 5-year increase in maternal age.19 The authors concluded that increasing maternal age at first birth contributed to almost 75% of the observed increase in CS and instrumental delivery. A study from Scotland reported that 38% of the increase in primary caesarean delivery from 1980 to 2005 was explained by increases in the age of women having their first baby.20 Similar findings have been reported from elsewhere in the United Kingdom21 and Europe.22 Studies undertaken in developed countries at the time the WHO recommendation was extant showed that the strongest predictor of caesarean delivery of the first baby for “low risk” women was maternal age.23 Among women whose first birth is vaginal, the rate of caesarean delivery for the next baby is around 7%,28 so primary CS rates are the single largest determinant of CS in subsequent pregnancies.29,30 For this reason, age at first birth strongly influences the overall rate of caesarean delivery for a country.
Of the 40 nations included in Molina and colleagues’ study where the mean age at first birth was 20 years or younger, 85% had an estimated CS rate below 15%.16 Unsurprisingly, of countries with a CS rate greater than 15%, less than a quarter (37 of 154) had a mean age at first birth below 20 years. In Australia, less than 5% of all births are to teenaged women, and the rate of CS in this group was 15% or less until 2002; since then, the rate has averaged 17.4%, with no significant increase since 2005 (P = 0.27) (Box 1). This is good news for teenaged mothers, because Australian women whose first birth is vaginal are overwhelmingly likely to have vaginal deliveries of all subsequent children.31 Women who have a primary caesarean delivery, however, are most likely to have all subsequent children by repeat caesarean delivery.32
The other influential demographic change is the increasing rate of obesity in women. During 2013 in Australia, in pregnancies where maternal body mass index (BMI) was recorded, more than 20% of women had a BMI of 30 kg/m2 or greater.12 Maternal obesity affects the outcome of labour and increases the risk of caesarean delivery.33,34
A longer term outlook
The outcomes informing the WHO recommendation — primarily maternal and perinatal mortality — are short term and severe. What is not considered are the longer term effects of birth on women; in particular, pelvic organ prolapse (POP) and urinary incontinence (UI) in later life. Some potential risk factors for POP and UI, such as the number of babies a woman has, the size of her babies and the woman’s BMI, are difficult to change. The most important potentially modifiable risk factor is mode of delivery. Recent estimates from the United States suggest that women face a lifetime risk of surgery for either POP or UI of 20%.35 Pelvic floor surgery for POP and UI is normally undertaken after menopause, when women are less fit for surgery, and the rate of complications for primary native tissue repair of POP has been reported to be about 15%, with an emergency reoperation rate of 1%.36 Longer term reoperation rates have been estimated to be as high as 8.9%.37
Women who have only given birth by caesarean delivery have a markedly reduced risk of objectively measured POP (5% compared with 29% after one or more vaginal births)38 and are much less likely to be symptomatic for prolapse.39 Compared with women having exclusively caesarean deliveries, women who have had their babies vaginally face a hazard ratio of 9.2 (95% CI, 7–12.1) for risk of surgery for POP.40 The hazard ratio increases to 20.9 (95% CI, 5.5–79.9) for women who have undergone a forceps vaginal delivery. Notably, as caesarean delivery has become more common in Australia, the rate of forceps vaginal delivery has decreased (Box 2). Women who have only given birth by caesarean delivery have rates of UI that are reduced by as much as half.41,42
Vaginal birth complicated by POP and UI in later life consigns women to symptoms that are often miserable to endure, last for many years, interfere markedly with quality of life and commonly lead to surgical treatments associated with much greater rates of complications and reoperation than with an initial CS. Yet the WHO documents do not refer to these outcomes at all. As the rate of caesarean delivery has increased in Australia, the incidence rate of surgery for POP and UI in women has gradually decreased (Box 3).
Another severe adverse outcome of vaginal birth is obstetric fistula. Fistula is a major public health problem in developing countries, with an incidence rate of up to one in 500 births, of which 80% result from obstructed labour.43,44 In Australia, such fistulae are almost unheard of, and the incidence rate of surgical repair for vaginal fistula, always low, is now two per 100 000 women per year, and falling (Box 4). Similarly, the rate of neonatal brachial plexus injury (Erb–Duchenne palsy) has fallen significantly in Australia, and this fall is closely correlated with caesarean delivery.45
A major concern for women is the possibility of adverse consequences in subsequent pregnancies after a caesarean delivery. In particular, complications such as placenta accreta and percreta become more common with repeat caesarean deliveries. The incidence of morbidly adherent placentation has been estimated at about one in 10 000 births in Australia, and it appears to be increasing.46 Large prospective studies have reported that increases in the odds for these and other serious complications of repeat caesarean delivery reach statistical significance at the third or subsequent caesarean delivery.47-49 However, parity continues to decrease in Australia, and third or subsequent births occur for only about 20% of women (Box 5). This is not the case in most developing countries, where attempting a vaginal birth after a previous caesarean delivery has the potential to be lethal, so care to avoid unnecessary primary caesarean delivery takes on a special importance.
Conclusion
It is now clear that an idealised and universal maximum CS rate of 15% is too low. The demographic profile of Australian women makes such an achievement highly unlikely and, were it to be achieved, it would expose more women to the risk of surgery in later life. Rather than seeking to work to such a goal in Australia, we should be aiming to provide CS to all women in need and to continue including women themselves in the conversation about the benefits and disadvantages, both short and long term, of birth by caesarean delivery.
Box 1 – Rates of caesarean delivery in Australia for women aged < 20 years compared with women aged ≥ 20 years, 1994–2013*
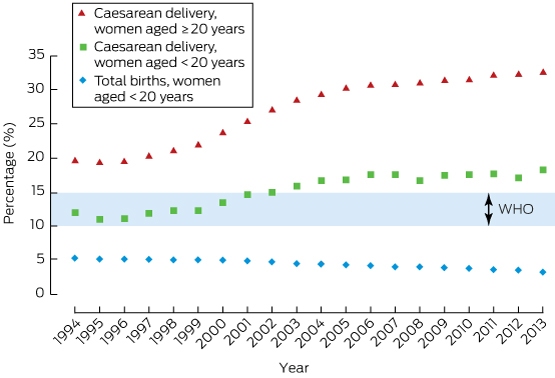
WHO = World Health Organization. * Shading indicates WHO-recommended caesarean section rate. Data source: Australian Institute of Health and Welfare, Australia’s mothers and babies series, http://www.aihw.gov.au/mothers-and-babies/ (accessed Dec 2016).
Box 2 – Rates of caesarean delivery and forceps vaginal delivery in Australia, all women, 1991–2013*
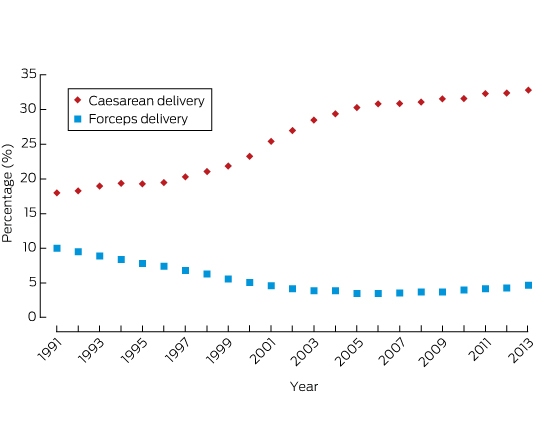
* Data source: Australian Institute of Health and Welfare, Australia’s mothers and babies series, http://www.aihw.gov.au/mothers-and-babies/ (accessed Dec 2016).
Box 3 – Incidence rates of surgical procedures for vaginal prolapse and urinary incontinence for women aged 50–69 years in Australia, 2000–2013*
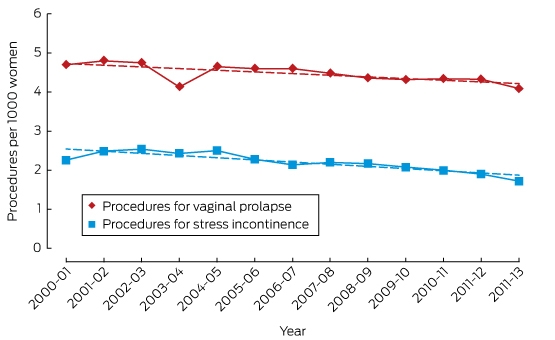
* There were significant decreases in incidence rate for both categories of procedure in the period to 2013 (prolapse procedures: R = 0.72, aR2 = 0.48, P = 0.005; incontinence procedures: R = 0.88, aR2 = 0.75, P < 0.005). Data source: Australian Institute of Health and Welfare, Procedures data cubes, http://www.aihw.gov.au/hospitals-data/procedures-data-cubes/#pdc (accessed Dec 2016).
Box 4 – Incidence rate of surgical repair for vesicovaginal and rectovaginal fistula repair in women aged 20–45 years in Australia, 2001–2013
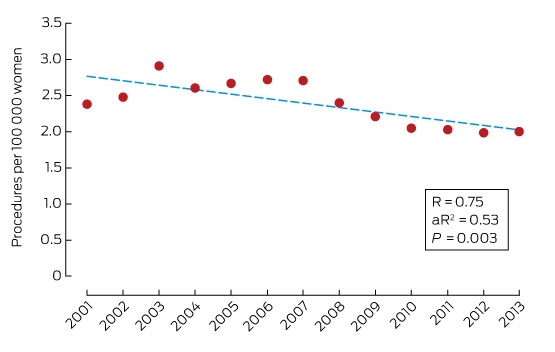
Data source: Australian Institute of Health and Welfare, Procedures data cubes, http://www.aihw.gov.au/hospitals-data/procedures-data-cubes/#pdc (accessed Dec 2016).
Box 5 – Parity at birth: proportion of third and fourth births in Australia, 1992–2013*
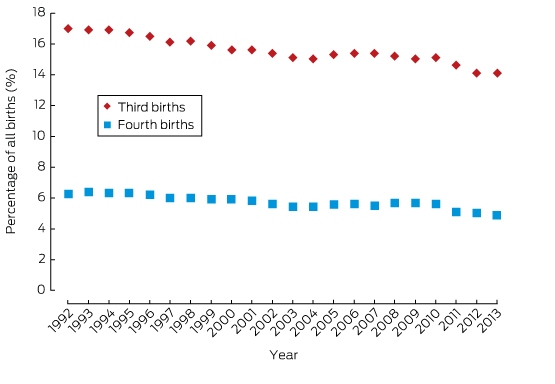
* There have been significant falls (P < 0.005) in both groups. Data source: Australian Institute of Health and Welfare, Australia’s mothers and babies series, http://www.aihw.gov.au/mothers-and-babies/ (accessed Dec 2016).
Competing interests
No relevant disclosures.
References
- World Health Organization. Monitoring emergency obstetric care: a handbook. Geneva: WHO Press, 2009.
- Gibbons L, Belizan JM, Lauer JA, et al. The global numbers and costs of additionally needed and unnecessary caesarean sections performed per year: overuse as a barrier to universal coverage. World Health Report (2010): Background Paper 30. Geneva: WHO 2010.
- Department of Reproductive Health and Research, World Health Organization. WHO statement on caesarean section rates: WHO/RHR/15.02. Geneva: WHO, 2015.
- World Health Organization. Appropriate technology for birth. Lancet 1985; 2: 436-437.
- Betrán AP, Merialdi M, Lauer JA, et al. Rates of caesarean section: analysis of global, regional and national estimates. Paediatr Perinat Epidemiol 2007; 21: 98-113.
- Althabe F, Sosa C, Belizán JM, et al. Cesarean section rates and maternal and neonatal mortality in low-, medium-, and high-income countries: an ecological study. Birth 2006; 33: 270-277.
- Ronsmans C, Holtz S, Stanton C. Socioeconomic differentials in caesarean rates in developing countries: a retrospective analysis. Lancet 2006; 368: 1516-1523.
- Belizán JM, Althabe F, Cafferata ML. Health consequences of the increasing caesarean section rates. Epidemiology 2007; 18: 485-486.
- Villar J, Valladares E, Wojdyla D, et al. Caesarean delivery rates and pregnancy outcomes: the 2005 WHO global survey on maternal and perinatal health in Latin America. Lancet 2006; 367: 1819-1829.
- Barros FC, Victora CG, Barros AJ, et al. The challenge of reducing neonatal mortality in middle income countries: findings from three Brazilian birth cohorts in 1982, 1993, and 2004. Lancet 2005; 365: 847-854.
- Hall MH, Bewley S. Maternal mortality and mode of delivery. Lancet 1999; 354: 776.
- Australian Institute of Health and Welfare. Australia’s mothers and babies 2013 — in brief (AIHW Cat. No. PER 72; Perinatal Statistics Series no. 31). Canberra: AIHW, 2015.
- Mola GD, Kuk J. Operative vaginal delivery at Port Moresby General Hospital from 1977 to 2010. P N G Med J 2011; 54: 174-184.
- World Bank. Reproductive health at a glance – Papua New Guinea. April 2011. http://siteresources.worldbank.org/INTPRH/Resources/376374-1303736328719/PNGhealth42211web.pdf (accessed Dec 2016).
- Mola G, Kirby B. Discrepancies between national maternal mortality data and international estimates: the experience of PNG. Reprod Health Matters 2013; 21: 191-202.
- Molina G, Weiser TG, Lipsitz SR, et al. Relationship between cesarean delivery rate and maternal and neonatal mortality. JAMA 2015; 314: 2263-2270.
- D’Alton ME, Hehir MP. Cesarean delivery rates: revisiting a 3-decades-old dogma. JAMA 2015; 314: 2238-2240.
- Khunpradit S, Tavender E, Lumbiganon P, et al. Non-clinical interventions for reducing unnecessary caesarean section. Cochrane Database Syst Rev 2011; (15): CD005528.
- Baghurst P, Robson S, Antoniou G, et al. The association between increasing maternal age at first birth and decreased rates of spontaneous vaginal birth in South Australia from 1991 to 2009. Aust N Z J Obstet Gynaecol 2014; 54: 237-243.
- Smith GCS, Cordeaux Y, White IR, et al. The effect of delaying childbirth on primary cesarean section rates. PLoS Med 2008; 5: e144.
- Essex HN, Green J, Baston H, Pickett KE. Which women are at increased risk of caesarean section or an instrumental vaginal birth in the UK: an exploration within the Millennium Cohort Study. BJOG 2013; 120: 732-742.
- Klemetti R, Gissler M, Sainio S, Hemminki E. Associations of maternal age with maternity care use and birth outcome in primiparous women: a comparison of results in 1991 and 2008 in Finland. BJOG 2014; 121: 356-362.
- Harlow BL, Frigoletto FD, Cramer DW, et al. Epidemiologic predictors of cesarean section in multiparous patients at low risk. Am J Obstet Gynecol 1995; 172: 156-162.
- Klein MC, Liston R, Fraser WD, et al. Attitudes of the new generation of Canadian obstetricians: how to they differ from their predecessors? Birth 2011; 38: 129-139.
- Unterscheider J, McMenamin M, Cullinane F. Rising rates of caesarean deliveries at full cervical dilatation: a concerning trend. Eur J Obstet Gynecol Reprod Biol 2011; 157: 141-144.
- O’Leary CM, de Klerk N, Keogh J, et al. Trends in mode of delivery during 1984-2003: can they be explained by pregnancy and delivery complications? BJOG 2007; 114: 855-864.
- Robson SJ, Tan WS, Adeyemi A, Dear KB. Estimating the rate of caesarean section by maternal request: anonymous survey of obstetricians in Australia. Birth 2009; 36: 208-212.
- Chen JS, Ford JB, Ampt A, et al. Characteristics in the first vaginal birth and their association with mode of delivery in the subsequent birth. Paediatr Perinat Epidemiol 2013; 27: 109-117.
- Brennan DJ, Robson MS, Murphy M, O’Herlihy C. Comparative analysis of international caesarean delivery rates using 10-group classification identifies significant variation in spontaneous labour. Am J Obstet Gynecol 2009; 201: 308.e1-8.
- Homer CS, Johnston R, Foureur MJ. Birth after caesarean section: changes over a nine-year period in one Australian state. Midwifery 2011; 27: 165-169.
- Roberts CL, Algert CS, Todd AL, Morris JM. Reducing caesarean section rates – no easy task. Aust N Z J Obstet Gynaecol 2013; 53: 310-313.
- Roberts CL, Algert CS, Ford JB, et al. Pathways to a rising caesarean section rate: a population-based cohort study. BMJ Open 2012; 2: pii: e001725.
- Athukorala C, Rumbold AR, Willson KJ, Crowther CA. The risk of adverse pregnancy outcomes in women who are overweight or obese. BMC Pregnancy Childbirth 2010; 10: 56.
- Dodd JM, Grivell RM, Nguyen AM, et al. Maternal and perinatal health outcomes by body mass index category. Aust N Z J Obstet Gynaecol 2011; 51: 136-140.
- Wu JM, Matthew CA, Conover MM, et al. Lifetime risk of stress urinary incontinence or pelvic organ prolapse surgery. Obstet Gynecol 2014; 123: 1201-1206.
- Mothes AR, Mothes HK, Radosa MP, Runnebaum IB. Systematic assessment of surgical complications of 438 cases of native tissue repair for pelvic organ prolapse adopting Clavien-Dindo classification. Arch Gynecol Obstet 2015; 291: 1297-1301.
- Oversand SH, Staff AC, Spydslaug AE, et al. Long-term follow-up after native tissue repair for pelvic organ prolapse. Int Urogynecol J 2014; 25: 81-89.
- Glazener C, Elders A, MacArthur C, et al. Childbirth and prolapse: long-term associations with the symptoms and objective measurements of pelvic organ prolapse. BJOG 2013; 120: 161-168.
- Gyhagen M, Bullarbo M, Nielsen TF, Milsom I. Prevalence and risk factors for pelvic organ prolapse 20 years after childbirth: a national cohort study in singleton primiparae after vaginal or caesarean delivery. BJOG 2013; 120: 152-160.
- Leijonhufvud A, Lundholm C, Cnattingius S, et al. Risks of stress urinary incontinence and pelvic organ prolapse surgery in relation to mode of childbirth. Am J Obstet Gynecol 2011; 204: 70.e1-7.
- MacArthur C, Glazener C, Lancashire R, et al. Exclusive caesarean delivery and subsequent urinary and faecal incontinence: a 12-year longitudinal study. BJOG 2011; 118: 1001-1007.
- Gyhagen M, Bullarbo M, Nielsen T, Milsom I. The prevalence of urinary incontinence 20 years after childbirth: a national cohort study in singleton primiparae after vaginal or caesarean delivery. BJOG 2013; 120: 144-151.
- Hilton P. Vesico-vaginal fistulas in developing countries. Int J Gynaecol Obstet 2003; 82: 285-295.
- Wall LL. Obstetric vesicovaginal fistula as an international public-health problem. Lancet 2006; 368: 1201-1209.
- Scott P, Robson SJ. Incidence of neonatal brachial plexus palsy in Australia 1993 – 2013: a population-based study. Pediatr Dimensions 2016; Feb 8. doi: 10.15761/PD.1000103.
- Kamara M, Henderson JJ, Doherty DA, et al. This risk of placenta accreta following primary elective caesarean delivery: a case-control study. BJOG 2013; 120: 879-886.
- Usta IM, Hobeika EM, Musa AA, et al. Placenta previa-accreta: risk factors and complications. Am J Obstet Gynecol 2005; 193: 1045-1049.
- Nisenblat V, Barak S, Griness OB, et al. Maternal complications associated with multiple cesarean deliveries. Obstet Gynecol 2006; 108: 21-26.
- Silver RM, Landon MB, Rouse DJ, et al. Maternal morbidity associated with multiple repeat cesarean deliveries. Obstet Gynecol 2006; 107: 1226-1232.
Linked content
-
MJA InSight: Caesareans according to need, not WHO recommendations
-
Podcast with Professor Stephen Robson
Provenance: Not commissioned; externally peer reviewed.
Designing Housing to Reduce Overcrowding-Related Harms: Rheumatic Heart Disease as the Canary in the Coal Mine
Simon Quilty, Veronica Matthews, Angus Baumann, James Marangou, Bo Remenyi, Gavin Wheaton, Serena Morton Nabanunga, Norman Frank Jupurrurla, Simon Robinson, Steve Mintern, Cary Duffield, Joshua R. Francis, Paul C. Memmott
Australian Climate Leadership in 2026: COP-Out or Step-Up for Health?
Catherine G. A. Pendrey, Angie Bone, Aletha Ward, Francis Nona, Michelle Isles, Paul M. Kelly, Nicholas J. Talley
The impact of the Breast Screen NSW transition from film to digital mammography, 2002–2016: a linked population health data analysis
Rachel Farber, Nehmat Houssami, Katy J L Bell
Shifting focus to adolescent wellbeing and inclusive participation in the digital age
Allyson R Todd, Elena Wang, Stephanie R Partridge
The CURE Asthma roadmap
Gary P Anderson, Anthony Flynn, Phil G Bardin, John D Blakey, Shyamali C Dharmage, Paul Foster, Peter G Gibson, Adam Jaffe, Alan James, Christine R Jenkins, Sundram Sivamalai, Peter D Sly, Guy B Marks, Vanessa M McDonald, Judy Wetttenhall
Protecting public interest journalism as a public health good
Bronwyn Fredericks, Neha Lalchandani, Melissa A Sweet, Alex Cramb, Carmel Williams