


The known The rising cost of mental disorders has been interpreted as indicating that the prevalence of mental health problems is increasing.
The new The prevalence of probable common mental disorders in Australia was fairly stable between 2001 and 2014. Over this same period, however, the number of working age individuals receiving disability support pensions for psychiatric conditions increased by about 50%.
The implications While the costs and level of disability associated with mental disorders is rising, there has been no corresponding change in the prevalence of probable common mental disorders in Australia.
It is popularly believed that we are in the midst of an epidemic of mental health problems.1 The most recent Global Burden of Diseases study found that the number of disability-adjusted life years (DALYs) attributed to mental disorders increased by 37% between 1990 and 2010, with depression becoming the fourth highest cause of disability in Australia.2 Studies in the United States, the United Kingdom and Australia have found that rates of antidepressant prescribing have more than doubled in recent decades.3-5 At the same time, a worldwide trend of mental disorders displacing musculoskeletal conditions as the predominant reason for illness-related absences and work incapacity has been noted.6,7 While these changes in rank represent, to some extent, a reduction in the burden of many somatic illnesses, the expense associated with mental illness has continued to rise, with the annual cost of depression in Australia now estimated to be $12.6 billion.8
The increasing societal and economic costs of common mental disorders (CMDs) have provoked the question of whether their underlying rates have actually increased, particularly in the working age population.9 Despite various indirect measures which indicate that the disability burden associated with CMDs has increased, studies of trends in CMD prevalence over recent decades have yielded mixed results; some have found rising rates of depression,10 for instance, while others have not.11,12 This inconsistency of findings might be explained by methodological differences. The main diagnostic tool for research studies, the Diagnostic and Statistical Manual of Mental Disorders (DSM), has been revised several times in recent decades. As a result, many sequential cross-sectional surveys have applied different diagnostic instruments or criteria for defining and diagnosing CMDs during individual survey periods,11,12 so that the prevalence rates at different time points may not be directly comparable. A second problem is that earlier studies analysed data for only two time points, often many years apart, making it difficult to draw definitive conclusions about trends in CMD prevalence. Finally, a number of published studies have used different sampling techniques at each time point, or have had significant differences in response rates, again making direct comparisons of prevalence at different time points very difficult.
In our study, we used data from multiple waves of the National and Australian Health Surveys, conducted by the Australian Bureau of Statistics (ABS), to assess changes in the prevalence of probable CMDs in Australia between 2001 and 2014. The data from these surveys are a unique resource for overcoming key limitations of previous studies. We also examined changes over the same period in the rates of disability support pensions (DSPs) granted for psychiatric disorders, allowing comparisons of changes in measures of the burden of CMDs with changes in CMD prevalence.
Methods
National health surveys
The National Health Survey (NHS) and Australian Health Survey (AHS) are household-based surveys undertaken at 3-year intervals to monitor health trends over time. Their methodologies have been described in detail.13 Trained ABS interviewers conducted face-to-face interviews over an 11-month period in each of 2001, 2004, and 2007 for the NHS and during 2011 and 2014 for the AHS. We analysed responses from adults aged 18–65 years.
Household and person weights were assigned to adjust for the probability of sample selection. Further adjustments were made for seasonality and non-response, and the data were then calibrated to the population benchmarks. Calibration ensures that the estimates are representative of population distributions and helps compensate for the over- or under-representation of particular categories of persons or households.
Assessment of common mental disorders
CMDs were assessed using the 10-item Kessler Psychological Distress Scale (K10). This scale, designed to assess non-specific psychological distress (predominantly symptoms of anxiety and depression), has been validated in various settings14 and found to have sound psychometric properties.15 K10 scores have been grouped into four categories: low (10–15), moderate (16–21), high (22–29) and very high (= 30) distress. Although there are no established cut-off standards for CMD caseness according to K10 scores, very high levels of psychological distress have been associated with a risk for meeting diagnostic criteria for anxiety or depression ten times greater than the overall population risk.14 We therefore defined two groups of probable CMD:
-
probable CMD (very high symptom level): respondents with K10 scores of 30 or more, reflecting the cut-off level adopted by the Australian National Survey of Mental Health and Wellbeing (NSMHWB);16 and
-
probable CMD (high symptom level): respondents with a K10 score of 22 or more.
Disability support pensions
We retrieved national data on the numbers of people receiving DSPs for psychological or psychiatric primary medical conditions17 between 2001 and 2014 from the website of the Department of Families, Housing, Community Services and Indigenous Affairs (now: Department of Social Services), and compared changes in their rates with trends in CMD prevalence. The proportion of the Australian working age population receiving a DSP for a mental illness was calculated by dividing the number of DSP recipients by the working age population (aged 16–64 years) for each year (ABS data).
Data analysis
All statistical analyses were performed in Stata 12.0 (StataCorp). Time trends in CMD prevalence and the proportion of the population receiving DSPs for psychiatric conditions were assessed in Cochran–Armitage trend tests. When not stratified by age, data were directly age-standardised against the estimated resident population of Australia at 30 June 2001.
Ethics approval
As is all data collection by the ABS, the gathering of data analysed in this study was covered by the Census and Statistics Act 1905, and the analyses were approved by both the Australian Parliament and the Privacy Commissioner.
Results
In 2001, 19 408 dwellings were selected for survey, of which 15 792 households provided full or adequate responses, a response rate of 81%. In 2004, 2007, 2011 and 2014, the numbers of participating households were 19 501, 15 792, 15 475 and 14 723 respectively (response rates, 82–91%). For all five survey periods, the study sample included a higher proportion of women than men. The age distributions for the five waves of data collection were similar, with the highest participation rates among those aged 25–64 years (data not shown).
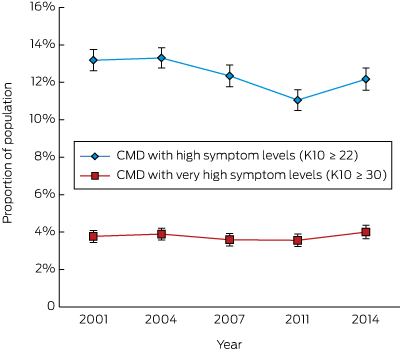
The prevalence rate in the Australian working age population of probable CMD with very high symptom levels did not vary significantly between 2001 and 2014 (for trend, P = 0.92). There was, however, a slight but statistically significant decrease in the estimated prevalence of CMD with high symptom levels, from 13.3% (95% confidence interval [CI], 12.7–13.8) in 2001 to 12.2% (95% CI, 11.6–12.8) in 2014 (for trend, P < 0.001), with a low point of 11.0% (95% CI, 10.5–11.6) in 2011 (Box 1). The estimated prevalence of probable CMD with high level symptoms exhibited a similarly small but statistically significant decline among those aged 25–34 (P = 0.002) or 35–44 years (P = 0.007); the decline for those aged 18–24 years was not statistically significant (P = 0.052) (Box 2).
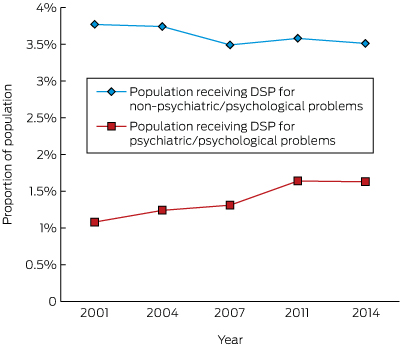
Although there was a significant decrease in the proportion of working age people receiving DSPs during the same time period (18.9%; for trend, P < 0.001; data not shown), there was a 51% increase in the proportion receiving DSPs for psychiatric conditions between 2001 and 2014 (for trend, P < 0.001), equivalent to one additional DSP for mental ill health for every 182 working age Australians (Box 3). Despite this increase, the proportion of people receiving DSPs remained substantially lower than the prevalence estimates for even the most severe probable CMD, suggesting that most people with depression or anxiety continued to work in some capacity. The proportion of DSPs granted for psychological and psychiatric conditions rose from 23% in 2001 to 32% in 2014.
Discussion
The data from repeated, nationally representative health surveys indicate that the prevalence of probable CMD among working age Australians has remained stable or even declined slightly between 2001 and 2014. This finding is contrary to the popular narrative of an increasing prevalence of mental health problems. Over the same period, we found that the proportion of working age people receiving DSPs for mental health problems had increased by about 50%. Although the costs and level of disability associated with mental disorders are rising in Australia, the increases do not appear to be linked with an increase in the underlying prevalence of common mental health problems.
Previous analyses of trends in the prevalence of mental disorders have often been hampered by changes in sampling methodology or diagnostic criteria at different time points. The main strength of our study is that the sampling methods and measuring instrument were consistent across the five survey periods, enabling direct comparison of prevalence rates. The response rates were high for all surveys (at least 81%), reducing potential inaccuracies in estimates caused by non-response bias.18
Limitations include the fact that caseness of probable CMD was defined by K10 scores. Using a measure of symptom severity rather than a diagnostic scale allowed us to avoid problems arising from changes in diagnostic classification, but high levels of self-reported symptoms are not the same as a diagnosed disorder, and the potential bias inherent to self-reports can lead to misclassification; this bias, however, should be stable over time. Further, the K10 is designed to detect only symptoms of depression and anxiety, but DSPs are awarded for the full spectrum of mental disorders. People with psychoses have very low rates of employment, although data from repeat rounds of the Australian Survey of High Impact Psychosis (SHIP) indicated that these rates have not changed over recent decades,19 suggesting that psychoses are unlikely to account for the rising rate of DSPs for mental disorders. Further, substance misuse problems included in some definitions of CMD are not captured by the K10; however, other data sources, such as the National Drug Strategy Household Survey, suggest that overall rates of substance misuse did not increase in Australia during the period of our study.20 Our assessment of DSP rates was based on administrative data, and relied on the recorded primary diagnosis. Receiving a disability pension may often depend on a combination of factors, and we had no information about non-primary diagnoses. Finally, we used the number of Australians aged 16–64 years as the denominator for calculating DSP rates, but the age pension eligibility age for women varied slightly during the study period; further, a very small proportion of DSP recipients remained on this benefit after turning 65. However, the numbers of people involved would have been very small, and should not have affected our results significantly.
We found no increase in psychological distress and probable CMD in Australia over the past decade, a result consistent with findings from large national surveys conducted in the USA,11 the UK,21 and the Netherlands.12 Interestingly, our findings conflict with two earlier studies of the prevalence of CMDs in Australia. Goldney and colleagues10 reported that the prevalence of major depression increased significantly between 1998 and 2008, although their study examined a South Australian population that may have had different demographic features from ours. In contrast, the NSMHWB found that CMD prevalence decreased by 20% between 1997 and 2007;16 the decline might, however, be explained by the use of different versions of diagnostic tools across the survey periods.
Despite the constant prevalence of probable CMD over the past ten years, we observed a significant increase in the proportion of people receiving DSPs for psychological or psychiatric medical conditions, consistent with findings in other developed countries.6,22 We propose four possible explanations for the conundrum of an increasing discrepancy between rates of mental health symptoms and the level of work disability attributed to mental illness.
Firstly, there could have been a change in labelling the causes of disability; practitioners may now be more inclined to apply the diagnostic labels of psychiatric disorders, or to identify the main cause of disability as a mental disorder when it is comorbid with physical disorders. The corresponding decrease in the proportion of disability benefits for some other common comorbid conditions, such as musculoskeletal problems, indirectly supports this possibility.22 That is, the apparent rise in the rates of disability attributed to mental disorders may reflect a correction of their historically being under-reported.
Secondly, the apparent rise in disability attributed to mental illness may reflect policy changes. Australians may receive any of a range of different income support payments, according to their personal or family circumstances and to whether they are temporarily unemployed or are deemed unfit for work because of a disability or impairment. In spite of the notional separation between different support types, it has been reported that many people with mental illnesses receive income support payments other than a DSP.23 A range of policy initiatives in Australia have attempted to promote greater connection between those on income support and potential work opportunities, an unintended consequence of which may have been to transfer people with mental health problems from more work-focused income support payments to schemes such as the DSP.23
Thirdly, it is possible that workplaces in Australia are becoming less tolerant of CMDs because of the changing nature and demands of contemporary work or because of social stigmas, forcing more people with CMDs to leave the workforce.
The final possibility is that the incidence of CMDs may be increasing, but this has been offset by the increased use of treatments that effectively control symptoms without having a substantial effect on functional outcomes. It has been reported, for instance, that pharmacological and non-pharmacological interventions significantly reduced the symptoms of depression, although their impact on the patient’s capacity to work was relatively small.24
Our findings are reassuring in that they provide robust evidence that the popular perception of an epidemic of CMDs in Australia is mistaken. However, the fact that functional impairment associated with mental health problems nevertheless continues to rise is a paradox. While the increase may reflect better recognition of and greater willingness to diagnose mental disorders in working Australians, it also means that greater emphasis on and more research into improving occupational outcomes for people with mental illness are needed.
Box 1 – Age-standardised prevalence of probable common mental disorders (CMDs) in the Australian working age population, 2001–2014
Box 2 – Prevalence of probable common mental disorders (CMDs)* in different age bands of the Australian working age population, 2001–2014
|
Age group (years) |
Prevalence of probable common mental disorders (95% CI) |
||||||||||||||
|
2001 |
2004 |
2007 |
2011 |
2014 |
P† |
||||||||||
|
|
|||||||||||||||
|
18–24 |
16.3% (14.5–18.1) |
15.5% (13.8–17.2) |
11.8% (10.1–13.5) |
11.8% (10.0–13.6) |
15.4% (13.3–17.5) |
0.052 |
|||||||||
|
25–34 |
13.2% (12.1–14.3) |
11.8% (10.7–12.9) |
12.3% (11.1–13.6) |
10.9% (9.7–12.1) |
10.9% (9.7–12.1) |
0.002 |
|||||||||
|
35–44 |
12.9% (11.9–13.9) |
14.0% (12.9–15.1) |
11.5% (10.4–12.6) |
10.9% (9.8–12.0) |
11.9% (10.7–13.1) |
0.007 |
|||||||||
|
45–54 |
12.7% (11.6–13.9) |
13.5% (12.4–14.6) |
13.2% (12.0–14.4) |
11.4% (10.2–12.6) |
12.4% (11.1–13.7) |
0.12 |
|||||||||
|
55–64 |
11.7% (10.4–13.0) |
12.2% (11.0–13.4) |
13.2% (11.9–14.5) |
10.4% (9.2–11.6) |
11% (9.8–12.3) |
0.08 |
|||||||||
|
Total (18–64 years) |
13.3% (12.7–13.8) |
13.4% (12.8–13.9) |
12.4% (11.9–13.0) |
11.1% (10.5–11.6) |
12.2% (11.6–12.8) |
< 0.001 |
|||||||||
|
|
|||||||||||||||
|
*K10 score =22. †Cochran–Armitage trend test. |
|||||||||||||||
Received 11 March 2016, accepted 20 December 2016
- Samuel B Harvey1,2,3
- Mark Deady1
- Min-Jung Wang1
- Arnstein Mykletun4,5,6
- Peter Butterworth7,8
- Helen Christensen2
- Philip B Mitchell1,2
- 1 University of New South Wales, Sydney, NSW
- 2 Black Dog Institute, Sydney, NSW
- 3 St George Hospital, Sydney, NSW
- 4 Norwegian Institute of Public Health, Oslo, Norway
- 5 University of Tromsø, Tromsø, Norway
- 6 Center for Work and Mental Health, Nordland Hospital Trust, Bodø, Norway
- 7 Centre for Mental Health, Melbourne School of Population and Global Health, University of Melbourne, Melbourne, VIC
- 8 Melbourne Institute of Applied Economic and Social Research, University of Melbourne, Melbourne, VIC
No relevant disclosures.
- 1. Angell M. The epidemic of mental illness: why? The New York Review of Books [online]; 23 June 2011. http://www.nybooks.com/articles/2011/06/23/epidemic-mental-illness-why/ (accessed Mar 2017).
- 2. Murray CJ, Vos T, Lozano R, et al. Disability-adjusted life years (DALYs) for 291 diseases and injuries in 21 regions, 1990–2010: a systematic analysis for the Global Burden of Disease Study 2010. Lancet 2012; 380: 2197-2223.
- 3. McManus P, Mant A, Mitchell PB, et al. Recent trends in the use of antidepressant drugs in Australia, 1990–1998. Med J Aust 2000; 173: 458-461. <MJA full text>
- 4. Middleton N, Gunnell D, Whitley E, et al. Secular trends in antidepressant prescribing in the UK, 1975–1998. J Public Health Med 2001; 23: 262-267.
- 5. Olfson M, Marcus SC. National patterns in antidepressant medication treatment. Arch Gen Psychiatry 2009; 66: 848-856.
- 6. Knudsen AK, Øverland S, Aakvaag HF, et al. Common mental disorders and disability pension award: seven year follow-up of the HUSK study. J Psychosom Res 2010; 69: 59-67.
- 7. Harvey SB, Henderson M, Lelliott P, Hotopf M. Mental health and employment: much work still to be done. Br J Psychiatry 2009; 194: 201-203.
- 8. LaMontagne AD SK, Cocker F. Estimating the economic benefits of eliminating job strain as a risk factor for depression. Melbourne: Victorian Heath Promotion Foundation (VicHealth), 2010. https://www.vichealth.vic.gov.au/media-and-resources/publications/economic-cost-of-job-strain (accessed Mar 2017).
- 9. Henderson M, Harvey SB, Overland S, et al. Work and common psychiatric disorders. J R Soc Med 2011; 104: 198-207.
- 10. Goldney RD, Eckart KA, Hawthorne G, Taylor AW. Changes in the prevalence of major depression in an Australian community sample between 1998 and 2008. Aust N Z J Psychiatry 2010; 44: 901-910.
- 11. Kessler RC, Demler O, Frank RG, et al. Prevalence and treatment of mental disorders, 1990 to 2003. N Engl J Med 2005; 352: 2515-2523.
- 12. de Graaf R, ten Have M, van Gool C, van Dorsselaer S. Prevalence of mental disorders and trends from 1996 to 2009. Results from the Netherlands Mental Health Survey and Incidence Study-2. Soc Psychiatry Psychiatr Epidemiol 2012; 47: 203-213.
- 13. Australian Bureau of Statistics. 4364.0.55.001. Australian Health Survey: first results, 2011–12. Issued Oct 2012. http://www.abs.gov.au/ausstats/abs@.nsf/Lookup/4364.0.55.001main+features12011-12 (accessed Mar 2017).
- 14. Andrews G, Slade T. Interpreting scores on the Kessler Psychological Distress Scale (K10). Aust N Z J Public Health 2001; 25: 494-497.
- 15. Kessler RC, Andrews G, Colpe LJ, et al. Short screening scales to monitor population prevalences and trends in non-specific psychological distress. Psychol Med 2002; 32: 959-976.
- 16. Australian Bureau of Statistics. 4326.0. National Survey of Mental Health and Wellbeing: summary of results. Issued Oct 2008. http://www.abs.gov.au/ausstats/abs@.nsf/mf/4326.0 (accessed Mar 2017).
- 17. Australian Government, Department of Families, Housing, Community Services and Indigenous Affairs. Characteristics of disability support pension recipients. June 2011. Canberra: DFHCSIA, 2011. https://www.dss.gov.au/sites/default/files/documents/05_2012/dsp_characteristics_june2011.pdf (accessed Mar 2017).
- 18. Knudsen AK, Hotopf M, Skogen JC, et al. The health status of nonparticipants in a population-based health study: the Hordaland Health Study. Am J Epidemiol 2010; 172: 1306-1314.
- 19. Waghorn G, Sukanta S, Harvey C, et al. Earning and learning in those with psychotic disorders: the second Australian national survey of psychosis. Aust N Z J Psychiatry 2012; 46: 774-785.
- 20. Australian Institute of Health and Welfare. National Drug Strategy Household Survey detailed report 2013 (AIHW Cat. No. PHE 183; Drug Statistics Series No. 28). Canberra: AIHW, 2014.
- 21. Brugha TS, Bebbington PE, Singleton N, et al. Trends in service use and treatment for mental disorders in adults throughout Great Britain. Br J Psychiatry 2004; 185: 378-384.
- 22. Black DC. Working for a healthier tomorrow. London: The Stationery Office, 2008. https://www.gov.uk/government/uploads/system/uploads/attachment_data/file/209782/hwwb-working-for-a-healthier-tomorrow.pdf (accessed Mar 2017).
- 23. Butterworth P, Burgess P, Whiteford H. The changing profile of mental disorders among Disability Support Pension recipients. Med J Aust 2011; 195: 53-54. <MJA full text>
- 24. Nieuwenhuijsen K, Bültmann U, Neumeyer-Gromen A, et al. Interventions to improve occupational health in depressed people. Cochrane Database Syst Rev 2008; (2): CD006237.
Abstract
Objectives: To assess changes in the prevalence rates of probable common mental disorders (CMDs) and in rates of disability support pensions (DSPs) for people with psychiatric disorders in Australia between 2001 and 2014.
Design, setting and participants: Secondary analysis of data from five successive Australian national health surveys of representative samples of the working age population (18–65 years of age) and national data on DSP recipients.
Main outcome measures: Prevalence of probable CMDs with very high symptom level (defined by a Kessler Psychological Distress Scale [K10] score of 30 or more) or with high symptom level (K10 score of 22 or more); the proportion of working age Australians receiving DSPs for psychiatric conditions.
Results: There was no change in the prevalence rate of probable CMDs with very high symptom levels between 2001 and 2014, but a slight decrease in the prevalence of probable CMDs with high symptoms levels, particularly among those under 45 years of age. Over the same period, the proportion of working age individuals receiving DSPs for psychiatric conditions increased by 51% (for trend, P < 0.001), equivalent to one additional DSP for every 182 working age Australians.
Conclusions: Contrary to popular belief, the prevalence of probable CMDs in Australia was stable between 2001 and 2014. However, the proportion of the working age population receiving DSPs for psychiatric conditions increased dramatically over the same period. This conundrum is a major public health problem that should be further examined.