


Despite recommendations by the World Health Organization and the National Health and Medical Research Council to limit the drinking of sugar-sweetened beverages (SSBs), Australians are particularly high consumers of such products.1 In the report of the Australian Health Survey, 39% of males and 29% of females over 2 years of age had consumed SSBs on the day prior to the interview in 2011–2012,1 and these drinks were the largest sources of sugar in the Australian diet.2
Soft drinks in Australia are chiefly sweetened with sugar cane-derived sucrose (online Appendix), a disaccharide of 50% glucose and 50% fructose; overseas, they are predominantly sweetened with high fructose corn syrup (United States) or sucrose-rich sugar beet (Europe). The sucrose, fructose and glucose content of soft drinks therefore varies between regions.
Glucose (but not fructose) rapidly elevates plasma glucose and insulin levels; fructose intake increases triglyceride production in the liver. Sucrose elicits a moderately rapid rise in blood glucose and insulin levels, as it must first be metabolised to free glucose and fructose. Variations in soft drink formulation will therefore have a biological impact because of differences in the final concentrations of glucose and fructose.3 As differences in the sugar content of soft drinks have not been systematically examined, we compared the final glucose and fructose content of popular soft drinks available in different regions.
The concentrations of sugars in five samples each of soft drinks marketed under the trade names Fanta, Sprite, Coca-Cola and Pepsi in the three regions Australia, Europe and the US (that is, 60 samples in total) were analysed by an independent, certified laboratory (National Measurement Institute, Australia) with high performance liquid chromatography. European samples of Fanta, Sprite, and Coca-Cola manufactured by the Coca-Cola Hellenic Bottling Company (HBC) Italia were representative of the corresponding soft drinks available in 28 European countries; samples of Pepsi manufactured by PepsiCo Beverages Italia were representative of the beverage available in 18 European countries. Each soft drink sample was derived from a different production batch; none contained intense sweeteners, such as aspartame or stevia. Total fructose and glucose concentrations (calculated final monosaccharide concentrations), allowing for contributions from sucrose, were calculated for each drink. Concentrations in each drink brand were compared in one-way analyses of variance (ANOVA) and, where appropriate, individual means were compared in post hoc least significant difference tests.
The mean total glucose concentration of Australian soft drinks was 0.96 g/100 mL (SD, 0.22) higher than for the corresponding US drinks, a mean 22% (SD, 6%) difference (P < 0.05; Box). Most glucose in Australian formulations was attributable to sucrose (online Appendix). The total glucose concentration of European soft drinks was generally similar to that of Australian formulations (1.04 g/100 mL [SD, 0.34] higher than US formulations, or 23% [SD, 8%] greater; P < 0.05; Box). The total fructose concentration was lower in Australian (mean difference, 0.97 g/100 mL; SD, 0.28) and European formulations (0.89 g/100 mL; SD, 0.35) than in corresponding US formulations (P < 0.05; Box). The concentration of total sugars was, consequently, similar for corresponding drinks from the three regions.
The potential health implications of regional differences in soft drink sugar content have not previously been examined, despite the differing metabolic effects of glucose and fructose.4 While the potential adverse effects of fructose overconsumption, particularly lipid accumulation, have been widely reported,4,5 those of Australian soft drinks containing high glucose concentrations have not been investigated.
Our short report should motivate specific examination of the health effects of Australian soft drink formulations.
Box – Mean concentrations of total glucose (A) and total fructose (B) in popular soft drinks in Australia, Europe and the United States
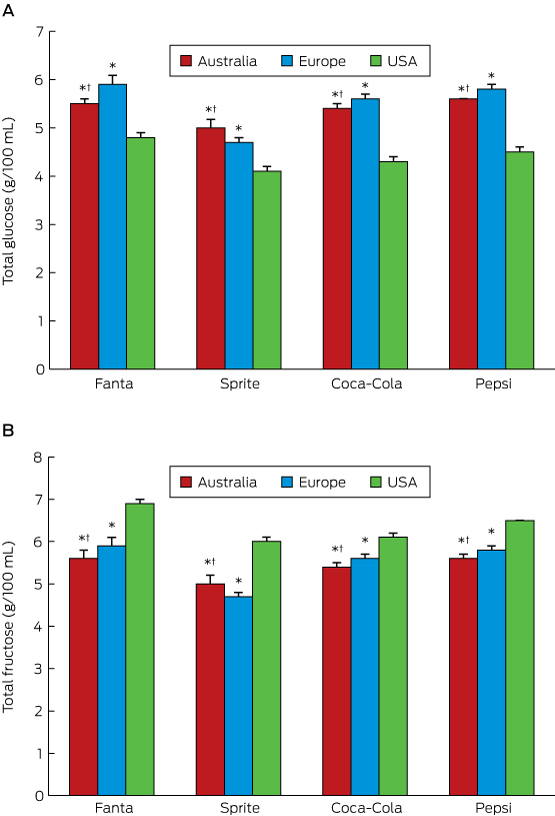
Five samples of each soft drink from each region were analysed. * P < 0.05 v US concentration; † P < 0.05 v European concentration. The full data for the concentrations of glucose, fructose, and sucrose, and of total glucose and total fructose in each drink is included in the online Appendix.
Received 16 November 2016, accepted 3 March 2017
- 1. Australian Bureau of Statistics. 4364.0.55.007. Australian Health Survey: Nutrition first results — foods and nutrients, 2011–12. Table 18: Consumption of sweetened beverages. May 2014. http://www.abs.gov.au/AUSSTATS/abs@.nsf/DetailsPage/4364.0.55.0072011-12?OpenDocument (accessed Mar 2017).
- 2. Australian Bureau of Statistics. 4804.0. National Nutrition Survey: foods eaten, Australia, 1995 [website]. Jan 1999. http://www.abs.gov.au/AUSSTATS/abs@.nsf/0/9A125034802F94CECA2568A9001393CE (accessed Mar 2017).
- 3. Jameel F, Phang M, Wood LG, Garg ML. Acute effects of feeding fructose, glucose and sucrose on blood lipid levels and systemic inflammation. Lipids Health Dis 2014; 13: 195.
- 4. Bantle JP, Raatz SK, Thomas W, Georgopoulos A. Effects of dietary fructose on plasma lipids in healthy subjects. Am J Clin Nutr 2000; 72: 1128-1134.
- 5. Chong MF, Fielding BA, Frayn KN. Mechanisms for the acute effect of fructose on postprandial lipemia. Am J Clin Nutr 2007; 85: 1511-1520.
This work was funded by a National Health and Medical Research Council Program grant and the Victorian Government Operational Infrastructure Support scheme.
No relevant disclosures.