


The known Although there are estimates of Indigenous health expenditure, little information is available regarding the total economic burden of Indigenous health inequality.
The new Indigenous health inequality is a substantial economic deadweight, costing the Northern Territory an estimated $16.7 billion between 2009 and 2013 (43% from lost life-years, 35% from lost productivity, 22% from higher direct health costs), equivalent to 19% of the NT gross state product.
The implications Closing the Indigenous gap will have far-reaching potential benefits for the economic future of the NT.
The Northern Territory covers one-sixth of the Australian landmass, but includes only 1% of its population. Aboriginal and Torres Strait Islander (Indigenous) people constitute about 27% of the NT population (compared with 2.5% nationally) (Box 1).1 Compared with the rest of the population, Indigenous Australians have disproportionate levels of social isolation, poverty, unemployment, lack of education, and inadequate access to health care.2 They also suffer poorer health; for Indigenous people in the NT born between 2010 and 2012, life expectancy at birth was 63 (men) and 69 years (women),3 17 and 14 years less than for non-Indigenous Territorians.
There is consensus that closing the health gap between Indigenous and non-Indigenous Australians requires concerted efforts by all sections of society. In 2009, Australian governments announced a vision for eliminating this gap within a generation: that is, by 2031 (“Closing the Gap”).4 The main focus was on broad consultations with Indigenous people about a range of measures, including health, childcare, schooling and economic participation.4
In this regard, two important questions were asked but remained largely unexplored:
How much does the Indigenous health gap cost society?
What are the potential economic benefits if the gap were to be eliminated?
The purpose of our study was to provide basic information on the potential economic benefits of reducing the Indigenous health gap, by quantifying the magnitude of the economic burden associated with Indigenous health inequality in the NT on the basis of standard cost-of-illness methodology and using the most recent data.5-7
Methods
Life expectancy was calculated using population and death data for 2009–2013. Indigenous and non-Indigenous resident population and death registration data were gathered from the Australian Bureau of Statistics and the Australian Coordinating Registry.8 The cost-of-illness approach was adopted for estimating the costs associated with the Indigenous health gap from a societal perspective; that is, all costs were included, regardless of who paid or received the payment: individuals, health care providers, Indigenous and non-Indigenous populations, or a government.7 This approach casts light on the overall magnitude and distribution of the economic costs of illness. All values were expressed in 2011 Australian dollars to account for inflation.
The total monetary value of the Indigenous health gap was estimated by calculating cost differences between the Indigenous and non-Indigenous populations in three categories: direct health costs (hospital, primary care, and other health services, including public health);9 indirect costs associated with lost productivity (missed income, welfare payments, and missed tax revenue, assuming equal opportunity for employment for Indigenous and non-Indigenous people);7 and intangible costs associated with premature deaths (based on years of life lost, YLL).7
Direct health costs were derived from data on overall health expenditure for Australia and expenditure for Indigenous people specifically;9,10 expenditure for non-Indigenous people was calculated by subtracting Indigenous expenditure from total expenditure. The cost differential (excess cost) for Indigenous health care was estimated by calculating the difference between actual expenditure on Indigenous health care and the estimated expenditure if the per capita costs were the same as for non-Indigenous NT residents.
A workforce supply and demand framework was used to assess the indirect costs caused by lost productivity, based on census data and other sources for employment, taxation and welfare payment data (Box 2).1,7,11 Indirect costs (productivity loss) encompassed excess welfare payments by governments, missed tax revenue, and lost efficiencies for the economy related to inadequate human capital development and human resources utilisation. The estimation of indirect costs is described in the Appendix.
The intangible costs attributable to the higher burden of disease were estimated by multiplying the excess YLLs by the value of a statistical life-year (VSLY).12 The YLLs were calculated using NT death data linked with the age-specific life expectancies from the Australian Burden of Disease (BOD) study.13 Following the BOD methodology, YLLs were not discounted for future years, and were costed at $120 000 per life-year, based on the review by Access Economics.12 Sensitivity analysis was undertaken with VSLY assumed to be $50 000, $100 000 or $140 000 per YLL. General inflation rates were applied to pricing the VSLY between 2009 and 2013.
Ethics approval
This study was endorsed by the Human Research Ethics Committee of the NT Department of Health and the Menzies School of Health Research (reference, HREC-2015-2400).
Results
Between 1 January 2009 and 31 December 2013, 9867 deaths of NT residents were registered; 62% were males, and 47% were Indigenous Australians (mean age at death, 51 years v 67 years for non-Indigenous deaths). Life expectancy at birth for Indigenous men and women was 64 and 69 years respectively, each 15 years lower than for non-Indigenous residents (79 and 84 years respectively).
Over the 5-year study period, direct health costs totalled $9.3 billion (2011 dollars), of which 58% were incurred by Indigenous patients (Box 3), more than double their proportion of the NT population. Per capita expenditure for Indigenous patients was 3.2 times that for non-Indigenous patients (based on total 5-year estimated resident population numbers: Indigenous, 345 968; non-Indigenous, 819 551). This ratio was slightly higher for hospital (3.5) than for primary care and other services (each 3.1). The total excess direct health costs were estimated at $3.7 billion during the 5 years, equivalent to about 40% of total expenditure (Box 3).
The indirect costs arising from lost productivity were estimated by matching the Indigenous supply–demand balance (equilibrium) with that of the non-Indigenous workforce (Box 2). The excess costs associated with lost productivity attributable to the Indigenous health gap were estimated to be $1.17 billion in 2011, of which $359 million (31%) were excess welfare payments, $293 million (25%) foregone tax revenue, and $515 million (44%) lost efficiencies (Appendix). The total costs of lost productivity attributed to Indigenous health inequality totalled $5.8 billion during 2009–2013 (Box 4). Wage responsiveness (elasticity) of demand was 1.8, and responsiveness of supply of the Indigenous workforce was 1.5, indicating that the demand and supply for the Indigenous workforce were respectively 80% and 50% higher than those for the non-Indigenous workforce (each 1.0 for demand and supply; Box 2). Based on Box 2, about 20 000 extra jobs at the average wage level would be required to close the gap, equivalent to a 14% expansion of the NT economy.
The intangible cost (burden of disease) estimates were based on excess YLLs. Over the 5-year period, there were 153 458 YLLs in the NT, 87 439 of which (57%) were attributable to Indigenous people, a rate that was 3.1 times that for the non-Indigenous population. The excess 59 571 Indigenous YLLs was equivalent to a total cost of $7.2 billion between 2009 and 2013 (Box 4). Intangible costs comprised the largest category of excess costs in the NT (43%), substantially higher than either direct health costs (22%) or indirect costs caused by lost productivity (35%) (Box 4).
The total costs resulting from Indigenous health inequality in the NT during 2009–2013 were estimated to be about $16.7 billion, equivalent to nearly one-fifth of the NT gross state product (GSP) for this period (Box 4).14 This result suggests that eliminating the Indigenous health gap could potentially save $745 million each year in direct health costs alone. In the medium and long term, closing the gap would save $13 billion in indirect and intangible costs over 5 years; savings in direct health costs would be less than one-quarter of the total long term financial benefit of closing the gap.
The results of our sensitivity analysis are included in the Appendix.
Discussion
We present evidence that Indigenous health inequality in the NT is both substantial and costly. The total costs attributable to Indigenous health inequality between 2009 and 2013 amounted to $16.7 billion, equivalent to 19% of GSP, a measure of the size of the NT economy. As a comparison, the costs of health inequalities for African, Asian and Hispanic Americans in the United States were estimated to be US$1.24 trillion during 2003–2006, corresponding to 2.4% of the American gross domestic product (GDP).5 The life expectancy gap between black and white Americans was only 4 years in 2010,15 as opposed to the 15 years between the Indigenous and non-Indigenous populations in the NT. A European Union study showed that the cost associated with socio-economic health inequalities was equivalent to 9.4% of GDP.6 Using the general equilibrium what-if analysis, an earlier Deloitte Access Economics study reported that the Indigenous employment gap imposed a cost of close to 10% of GSP in the NT.2 Our study found that 40% of direct health costs in the NT were associated with Indigenous health inequality, higher than the corresponding figures in the US (30%) and EU studies (20%).5,6
Our findings suggest that there would be enormous financial benefits for the NT in the longer term should closing the gap become a reality. The evidence we have presented implies that the total potential long term benefits would be $3.3 billion annually in real terms, and a boost of nearly 20% of GSP in relative terms (Box 4), double the projection by the Deloitte study (9% over 20 years).2 A possible explanation for this difference may be the different focuses of the studies: the Deloitte analysis concentrated on employment, whereas we assessed much broader benefits from a societal perspective. Closing the gap is feasible: between 1994 and 2008, Indigenous employment in Australia increased by 55–70%.16
There are many contributors to health inequality in the NT. Poverty is a cause and consequence of ill health, and the Indigenous population is particularly vulnerable to poverty, especially in remote areas. For example, the NT market basket survey of food and drink prices found that in 2014 they were 54% higher in remote than in urban areas.17 After adjusting for these higher prices, the real income of the average Indigenous person living in a remote community was only 29% of the overall NT average. Thirty per cent of NT Indigenous people are located 50 kilometres or more from a primary school and 100 kilometres or more from a health clinic. Remote areas lack economies of scale; 87% of NT Indigenous communities have populations of less than 100 people. Strategies for redressing health disparities should consider how the impact of remoteness might be ameliorated. Solutions may include ensuring access to essential government services for people residing in remote areas, and facilitating resettlement for those who wish to move to larger population centres.18 Overcoming the effects of remoteness, improving public housing, and raising living standards are necessary prerequisites for closing the gap,19 and will also allow economies of scale and a larger population base, which mean that education and health services can be provided more efficiently. This, in turn, will facilitate better access to labour markets for Indigenous people.
Economic growth in Indigenous communities is fundamental to improving Indigenous health and saving Indigenous human resources in the longer term.11 Closing the Indigenous health gap must therefore be seen more broadly as being dependent on closing gaps in both education and employment. We found that the income responsiveness of demand and supply (elasticity) for the Indigenous workforce was much greater than for the non-Indigenous population (80% and 50% higher respectively). This remarkable finding is consistent with other studies which have found that the response to improving education and employment opportunities is greater for remote Indigenous than for non-remote non-Indigenous populations.20 That poor Indigenous health can be improved by reducing poverty is a testable hypothesis, as it focuses on tackling the root cause of ill health, and contributes to economic growth and prosperity.
Several technical health economic innovations were explored in our analysis. We adopted the cost-of-illness approach for assessing health inequality, a technique successfully applied in a recent US study.5 We incorporated BOD data into our analysis; this is the first study to use such data to estimate the costs of health inequality. We developed a supply and demand model of the NT workforce, using empirical data to determine the indirect costs of lost productivity attributable to the Indigenous health gap.
There were several potential limitations to our study. First, we acknowledge that our cost estimates of health inequality may not be precise. The indirect and intangible cost estimates were based on economic modelling and a pre-specified VSLY; however, it is likely that the assumed VSLY was conservative.12 Second, we made no allowance for a definite timeframe for closing the gap, primarily because this depends on the implementation of the Closing the Gap policy. Third, our costings may be incomplete, as we did not include transport, capital, informal care and crime-related costs. Finally, there was no in depth discussion of possible solutions for health-related inequality. Genetic factors play only a limited role in Indigenous health inequality21 when compared with more important and interconnected political and socio-economic factors, such as lower living standards, income and employment, lack of access to education2,21 and primary health care,22 and social isolation.18
Notwithstanding these limitations, our study indicates that, should the aspirations of the Closing the Gap initiative be realised, savings will be far greater in terms of improved productivity and saved human life-years than in direct health care service costs. The complete benefits of closing the gap will flow from economic development.
Our study shows that Indigenous health inequality is a costly economic deadweight in terms of lost life-years, lost productivity, and higher expenditure on health and social security. Our analysis provides a strong economic case for making investments to close the Indigenous health gap. The cost estimates highlight the enormous opportunity costs caused by this gap, and the potential cost savings to be made by closing it, not to mention the non-pecuniary benefits of a more just society.
Box 1 – Baseline demographic and socio-economic data for Indigenous and non-Indigenous people in the Northern Territory, 2011*
Indigenous residents |
Non-Indigenous residents |
||||||||||||||
Population |
56 778 (26.8%) |
155 165 (73.2%) |
|||||||||||||
Completed year 12 |
9% |
42% |
|||||||||||||
Employed |
22% |
62% |
|||||||||||||
Weekly personal income, mean |
$398 |
$991 |
|||||||||||||
Residing in remote area |
63% |
6% |
|||||||||||||
* Source: Australian Bureau of Statistics 2011 Census.1 | |||||||||||||||
Box 2 – Estimated supply and demand curves in the Indigenous and non-Indigenous labour markets, Northern Territory, 2011
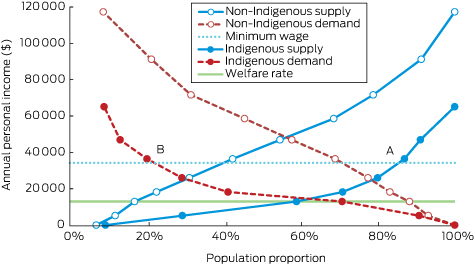
Data sources: Australian Bureau of Statistics 2011 Census, Basic Community Profile and Indigenous Profile, Northern Territory.1 At the minimum wage, approximately 85% of the Indigenous working-age population (point A) would be willing to supply labour, compared with a demand for Indigenous labour at this level of only 22% (point B).
Box 3 – Direct health costs for Indigenous and non-Indigenous people in the Northern Territory, 2009–2013, by area of expenditure ($ million, 2011)
Box 4 – Cost estimates of Indigenous health inequality in the Northern Territory, 2009–2013 ($ million, 2011)
Direct health costs |
Indirect costs |
Intangible costs |
Total excess costs |
GSP |
Total excess costs as proportion of GSP |
||||||||||
2009 |
630 |
1100 |
1218 |
2947 |
15 887 |
18.6% |
|||||||||
2010 |
679 |
1133 |
1260 |
3071 |
16 456 |
18.7% |
|||||||||
2011 |
786 |
1167 |
1332 |
3284 |
16 870 |
19.5% |
|||||||||
2012 |
835 |
1202 |
1936 |
3973 |
18 131 |
21.9% |
|||||||||
2013 |
796 |
1238 |
1429 |
3463 |
19 463 |
17.8% |
|||||||||
2009–2013 |
3725 (22.2%*) |
5838 (34.9%*) |
7175 (42.9%*) |
16 739 |
86 806 |
19.3% |
|||||||||
GSP = Gross state product. * Proportion of total excess costs. | |||||||||||||||
Received 25 February 2016, accepted 24 May 2016
- Yuejen Zhao1
- Siva R Vemuri2
- Dinesh Arya1
- 1 Northern Territory Department of Health, Darwin, NT
- 2 Charles Darwin University Business School, Darwin, NT
No relevant disclosures.
- 1. Australian Bureau of Statistics. Census 2011 Australia: community profiles. Canberra: ABS; 2013. http://www.abs.gov.au/websitedbs/censushome.nsf/home/communityprofiles?opendocument&navpos=230 (accessed June 2016).
- 2. Deloitte Access Economics. Economic benefits of closing the gap in Indigenous employment outcomes. Sydney: DAE, 2014. http://www2.deloitte.com/content/dam/Deloitte/au/Documents/finance/deloitte-au-fas-economic-benefits-closing-gap-10-feb-2014-240914.pdf (accessed Mar 2016).
- 3. Australian Bureau of Statistics. 3302.0.55.003. Life tables for Aboriginal and Torres Strait Islander Australians, 2010–2012. Canberra: ABS, 2013. http://www.abs.gov.au/ausstats/abs@.nsf/mf/3302.0.55.003 (accessed Mar 2016).
- 4. Council of Australian Governments. National Indigenous reform agreement (Closing the Gap). Canberra: COAG, 2009. https://www.coag.gov.au/node/145 (accessed Mar 2016).
- 5. LaVeist TA, Gaskin DJ, Richard P. The economic burden of health inequalities in the United States. Washington DC: Joint Center for Political and Economic Studies, 2009. http://www.hhnmag.com/ext/resources/inc-hhn/pdfs/resources/Burden_Of_Health_FINAL_0.pdf (accessed Mar 2016).
- 6. Mackenbach JP, Meerding WJ, Kunst AE. Economic costs of health inequalities in the European Union. J Epidemiol Community Health 2011; 65: 412-419.
- 7. World Health Organization. WHO guide to identifying the economic consequences of disease and injury. Geneva: WHO, 2009. http://www.who.int/choice/publications/d_economic_impact_guide.pdf (accessed Mar 2016).
- 8. Australian Bureau of Statistics. 3238.0. Estimates and projections, Aboriginal and Torres Strait Islander Australians, 2001 to 2026. Canberra: ABS, 2014. http://www.abs.gov.au/ausstats/abs@.nsf/mf/3238.0 (accessed Mar 2016).
- 9. Australian Institute of Health and Welfare. Expenditure on health for Aboriginal and Torres Strait Islander people 2010–11. An analysis by remoteness and disease (AIHW Cat. No. HWE 58; Health and Welfare Expenditure Series No. 49). Canberra: AIHW, 2013. http://www.aihw.gov.au/WorkArea/DownloadAsset.aspx?id=60129544363 (accessed Mar 2016).
- 10. Australian Institute of Health and Welfare. State and territory health expenditure, current and constant prices, 1996–97 to 2013–14. Canberra: AIHW, 2015. http://www.aihw.gov.au/expenditure-data/ (accessed Mar 2016).
- 11. Mankiw NG. Principles of macroeconomics. 6th edition. Mason: South-Western, Cengage Learning, 2012.
- 12. Access Economics. The health of nations: the value of a statistical life. Canberra: Australian Safety and Compensation Council, 2008. http://www.safeworkaustralia.gov.au/sites/SWA/about/Publications/Documents/330/TheHealthOfNations_Value_StatisticalLife_2008_PDF.pdf (accessed Mar 2016).
- 13. Australian Institute of Health and Welfare. Australian Burden of Disease Study. Fatal burden of disease 2010 (AIHW Cat. No. BOD 1; Australian Burden of Disease Study Series No. 1). Canberra: AIHW, 2015. http://www.aihw.gov.au/WorkArea/DownloadAsset.aspx?id=60129550178 (accessed Mar 2016).
- 14. Australian Bureau of Statistics. 5220.0. Australian national accounts: state accounts, 2012–13. Canberra: ABS, 2013. http://www.abs.gov.au/AUSSTATS/abs@.nsf/Lookup/5220.0Main+Features12012-13?OpenDocument (accessed Mar 2016).
- 15. Kochanek KD, Arias A, Anderson RN. How did cause of death contribute to racial differences in life expectancy in the United States in 2010? (NCHS Data Brief No. 125). Hyattsville, MD: National Center for Health Statistics, 2013. http://www.cdc.gov/nchs/data/databriefs/db125.pdf (accessed Mar 2016).
- 16. Gray M, Hunter B, Lohoar S. Increasing Indigenous employment rates (Issues paper no. 3, for the Closing the Gap Clearinghouse). Canberra: AIHW, 2012. http://www.aihw.gov.au/uploadedFiles/ClosingTheGap/Content/Publications/2012/ctg-ip03.pdf (accessed Mar 2016).
- 17. Department of Health. Northern Territory market basket survey. Darwin: DoH, 2014. http://digitallibrary.health.nt.gov.au/prodjspui/bitstream/10137/616/2/Northern%20Territory%20%20Market%20Basket%20Survey%20report%202014.pdf (accessed Mar 2016).
- 18. United Nations. Urban Indigenous peoples and migration: a review of policies, programmes and practices (United Nations Housing Rights Programme Report No. 8). Nairobi: United Nations Human Settlements Programme; Office of the High Commissioner for Human Rights, 2010. http://unhabitat.org/books/urban-indigenous-peoples-and-migration-a-review-of-policies-programmes-and-practices/# (accessed Mar 2016).
- 19. Australian Productivity Commission. Overcoming Indigenous disadvantage. Factsheet: Indigenous men and women; key indicators 2011. Canberra: Steering Committee for the Review of Government Service Provision, 2011. http://www.pc.gov.au/research/ongoing/overcoming-indigenous-disadvantage/key-indicators-2011/key-indicators-2011-factsheet-men-women.pdf (accessed Mar 2016).
- 20. Stephens BJ. The determinants of labour force status among Indigenous Australians. Australian J Lab Econ 2010; 13: 287-312.
- 21. Durie MH. The health of Indigenous peoples: depends on genetics, politics, and socioeconomic factors. BMJ 2003; 326: 510.
- 22. Zhao Y, Thomas SL, Guthridge SL, et al. Better health outcomes at lower costs: the benefits of primary care utilisation for chronic disease management in remote Indigenous communities in Australia’s Northern Territory. BMC Health Serv Res 2014; 14: 1.
Abstract
Objectives: To estimate the potential economic benefits of closing the Indigenous health gap by quantifying the economic burden associated with Indigenous health inequality in the Northern Territory.
Design, setting and participants: A cost-of-illness study was conducted from a societal perspective for NT residents for the period 2009–2013. The total cost of the Indigenous health gap was estimated by calculating the cost differences between Indigenous and non-Indigenous populations in health services, lost productivity and lost life-years on the basis of data from the 2011 census, as well as on burden of disease, health expenditure, welfare, taxation and other published financial data.
Main outcome measures: The total and per capita costs in three categories were analysed: direct health costs, the indirect costs of lost productivity, and intangible costs associated with premature deaths.
Results: The excess cost of the Indigenous health gap was estimated to be $16.7 billion for the 5-year study period, equivalent to 19% of the NT gross state product. The excess costs associated with the Indigenous health gap included 22% caused by higher health expenditure for servicing the gap, 35% attributable to lost productivity caused by illness, and 43% associated with lost life-years.
Conclusions: Our findings highlight the long term potential benefits of the Australian governments’ Closing the Gap initiative for the NT. Successful implementation of this initiative will require improving government services by combating discrimination, developing local economies, overcoming poverty, and reducing the disadvantages associated with remoteness.